Equities Asset Class Review - Douglas Kidd Investment Officer 19 February, 2020
←
→
Page content transcription
If your browser does not render page correctly, please read the page content below
Equities Asset
                Class Review

            Douglas Kidd
            Investment Officer
            19 February, 2020

2/19/2020                        1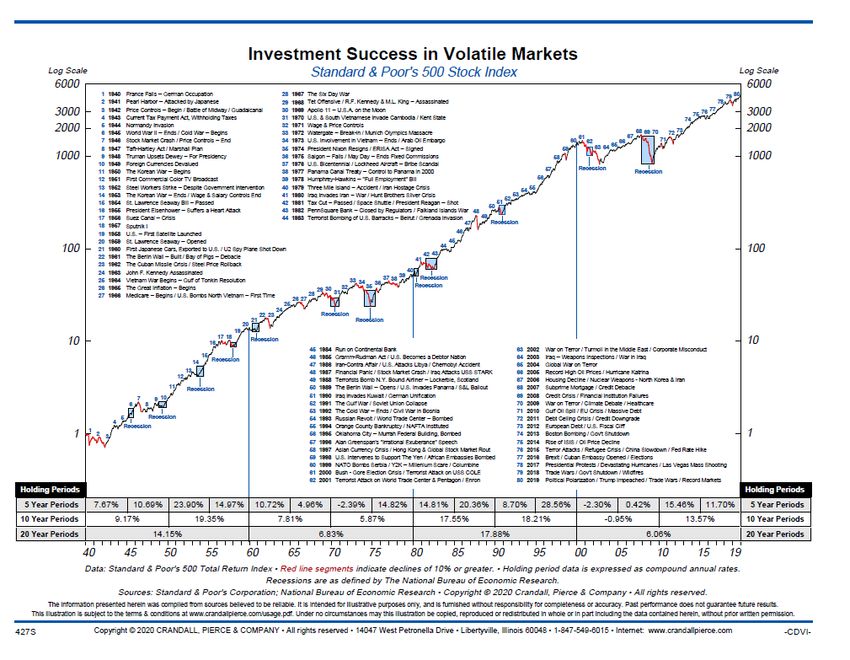
Executive Summary
  • An asset class with very good long term returns, equities are essential
    for the FCERA portfolio to meet its long term return target of 7%
  • In 2019, All types of equities delivered strong returns
  • The FCERA passive equity portfolio (benchmarks only) returned 25.4%
  • The FCERA portfolio as been underweight US, overweight value,
    overweight EM. Each of these has detracted from performance
  • Active managers have not added value
  • The Board is encouraged to select an overall benchmark, then select
    tilts or weighting decisions relative to that benchmark: e.g. value,
    emerging markets, small cap, and then to review all active managers

2/19/2020                                                                     2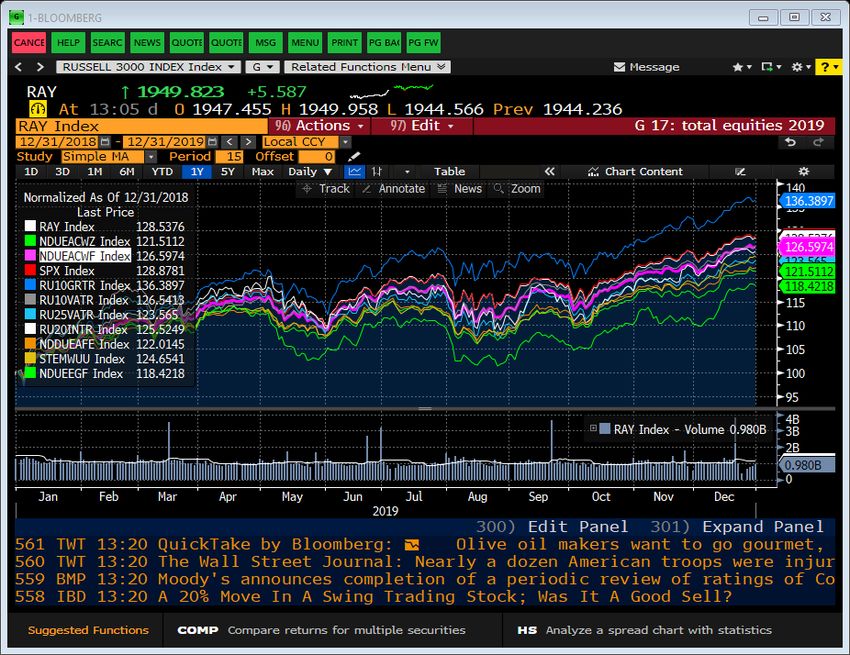
2/19/2020 3
2019 Largest Stocks by Market Capitalization

                      $1.9T   Saudi Aramco
                      $1.3T   Apple
                      $1.2T   Microsoft
                      $922B   Alphabet (Google)
                      $916B   Amazon
                      $585B   Facebook
                      $569B   Alibaba
                      $553B   Berkshire Hathaway
                      $461B   Tencent
                      $461B   JP Morgan

2/19/2020                                                  4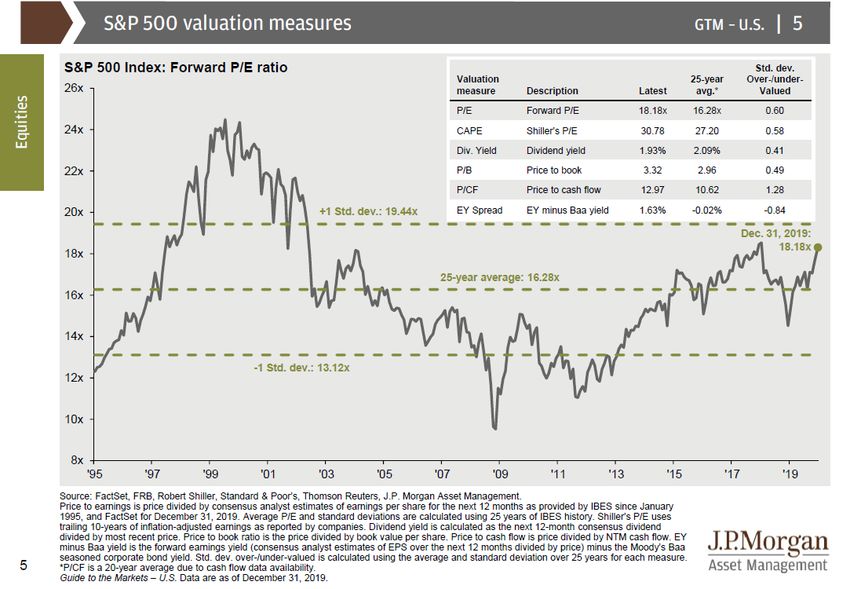
1999 Largest Stocks by Market Capitalization

                 $586B   Microsoft (MSFT)
                 $475B   General Electric (GE)
                 $349B   Cisco Systems (CSCO)
                 $286B   Wal Mart (WMT)
                 $277B   Intel (INTC)
                 $275B   Nippon Tel & Tel (9433 JP)
                 $266B   Exxon Mobil (XOM)
                 $238B   Lucent (R.I.P.)
                 $197B   Nokia (NOK)
                 $196B   BP (BP)

2/19/2020                                                  5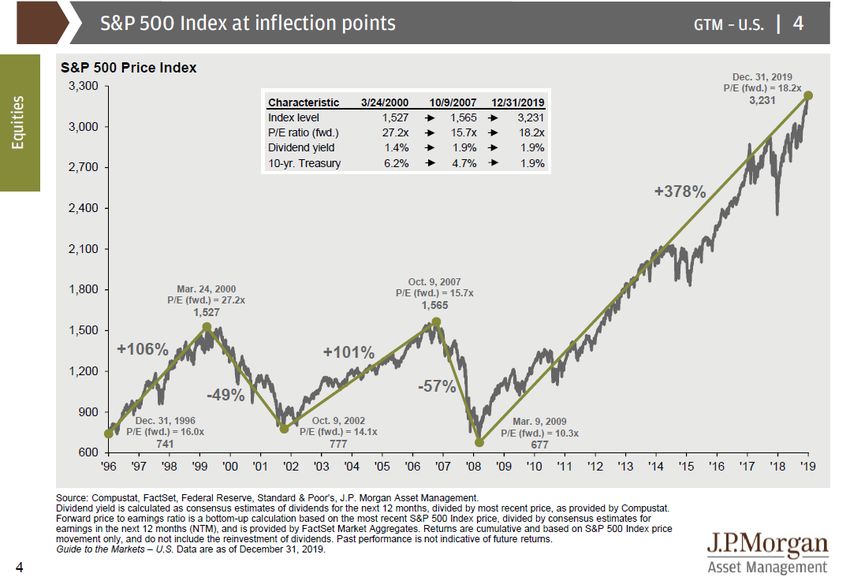
“The Nifty 50” from the early 70’s
                    aka “One Decision Stocks”

                   Only 29 are still publicly traded
            Remember Eastman Kodak, SS Kresge, Polaroid?

2/19/2020                                                  6
Dow Jones Industrials, September 1929
                                                          General Foods Corporation †
             Allied Chemical and Dye                                                                   Paramount Publix
                                                          (formerly Postum
             Corporation                                                                               Corporation
                                                          Incorporated)
             American Can Company                         General Motors Corporation                   Radio Corporation of America
             American Smelting & Refining General Railway Signal
                                                                                                       Sears Roebuck & Company
             Company                      Company
             The American Sugar Refining                                                               Standard Oil Co. of New
                                                          B.F. Goodrich Corporation
             Company                                                                                   Jersey
             American Tobacco Company                     International Harvester
                                                                                                       The Texas Company
             (B shares)                                   Company
                                                          International Nickel Company,
             Atlantic Refining Company                                                  Texas Gulf Sulphur Company
                                                          Ltd.
             Bethlehem Steel Corporation                  Mack Trucks, Inc.                            Union Carbide Corporation
                                                                                                       United States Steel
             Chrysler Corporation                         Nash Motors Company
                                                                                                       Corporation
             Curtiss-Wright Corporation † National Cash Register                                       Westinghouse Electric
             (formerly Wright Aeronautical) Company                                                    Corporation
             General Electric Company                     North American Company                       F. W. Woolworth Company
            Wright Aeronautical merged with the Curtiss Aeroplane and Motor Company to become Curtiss-Wright. Postum Inc. changed its name to General Foods.

2/19/2020                                                                                                                                                      7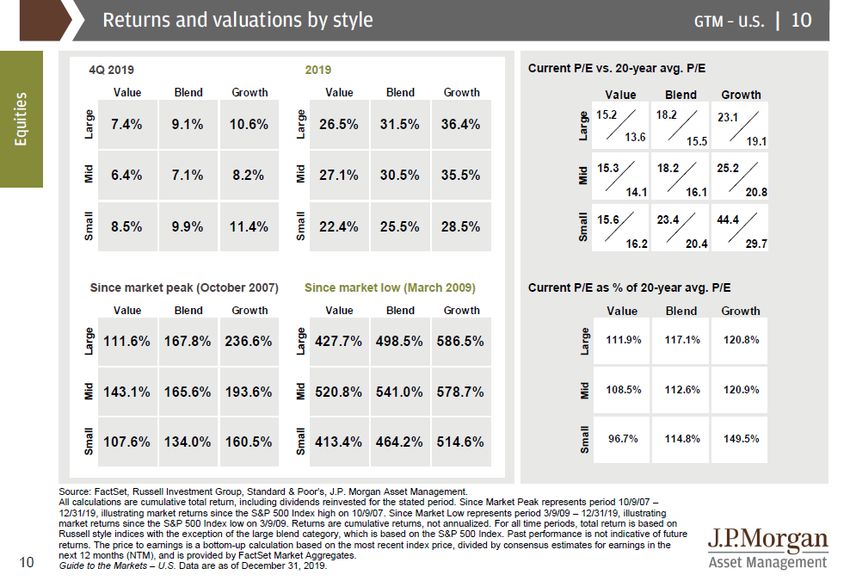
This may be the longest running bull market in history

2/19/2020                                                            8

Price/Earnings is a
            valuation measure,
               now very rich

2/19/2020                         9
High P/E is not a sell signal, but does suggest lower
                            returns in the future

2/19/2020                                                           10
Value continues
to lag growth
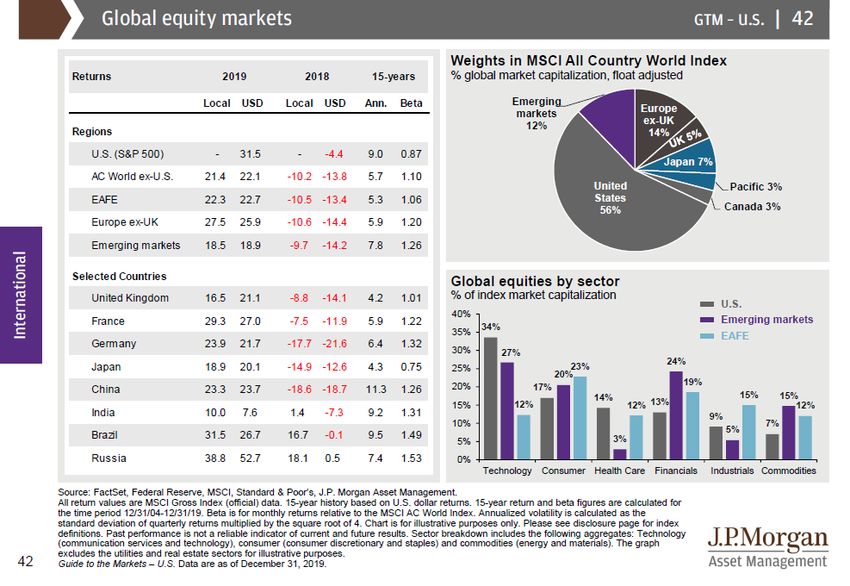
2/19/2020 11The US was strongest
in 2019 Note the weights
in the ACWI
benchmark
Note: US is
dominated by
Big Tech
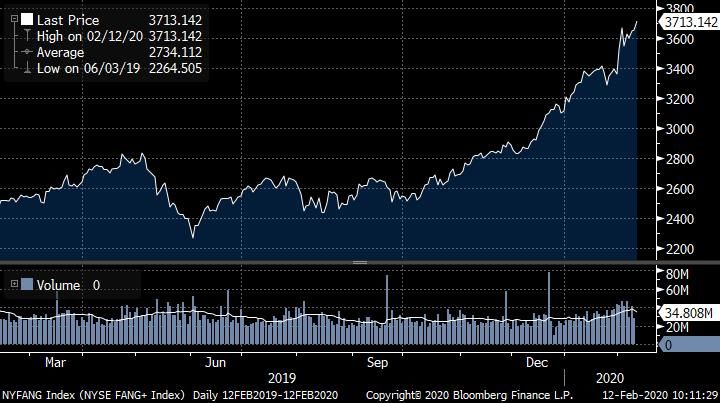
2/19/2020 12This is a one year chart of the “NY Fang” Index, which
comprises the big tech stocks plus Amazon and Netflix
2/19/2020 13But, Long Term, Econ Growth is the justification for EM Equities
(Verus Cap Mkt assumptions are for 9% return vs. 5.5% US)
2/19/2020 14The Equities Portfolio Risk Factor Pyramid
Beyond the Growth Factor Beta, Can We Get Paid Adequately
for Taking on other “Risks” and/or find Alpha?
Alpha, not just Beta
Low Correlation to Growth
-Illiquidity > Private Equity
-Long/Short > Hedge Funds
Factor Tilts, e.g. Alt Beta
-Small size, Value
-Momentum, Quality, Low Vol
-Currencies
-Countries
Equity Beta, Sensitivity to
Economic Growth
2/19/2020 15The Active vs. Passive Debate
• Asset allocation is the primary driver of investment returns
• Asset allocation outweighs manager selection as a return driver
• Passive exposure to Equity Beta or asset class lowers tracking risk & fees
• Factor tilts can add incremental value (“Alternate Beta”)
• Active management (manager selection) adds risk, might add return
• “Pure alpha” or uncorrelated (low/no Beta) returns with low correlation
benefit are the best diversifiers, aka absolute return
• FCERA made a shift in 2019 toward passive equities
(Alpha is elusive, difficult to prove, and more difficult to sustain.)
2/19/2020 16Sample Benchmark Nest
• Equities: MSCI ACWI (All Country World Index)
• 23 developed markets, 26 EM countries
• 8820 constituents, so broadly representative
• Primarily Large Cap, but the IMI variant includes small caps
• Easily replicated, broadly representative of global equities
• Investable passively
• MSCI US: US-only subset of ACWI
• World ex-US (Hedged or un-Hedged?) : dev non-US
• ACWI EM: Emerging Markets
FCERA has not historically had an overall equities
benchmark, which would have facilitated a conscious
discussion on geographic weightings
2/19/2020 17Equity Benchmarks
Implications
ACWI Benchmark geographic mix as of 12/31/2019
• US: 55.6% For Example,
• Developed Non-US: 34.4% FCERA remains
• EM: 11% underweight the
US relative to the
FCERA geographic mix as of 12/31/2019 ACWI index
• US: 51.3% (with Parametric overlay)
• Developed Non-US: 35.3% FCERA has been
consistently
• EM: 13.4%
overweight EM
Since US stocks have materially outperformed, this
has cost performance historically. What will the
future hold?
2/19/2020 18FCERA Equity Portfolio 2019
Benchmark(s) Performance
Growth better than value, US better than non-US
This is where you putRAYthe Bloomberg
Russell 3000
MSCI ACWI
performance chart
Russell 3000
MSCI ACWI ex-US ndueacwz ex-US
ACWI ndueacwf ndueacwf
S&P 500
Russell 1000 Growth spx S&P 500
Russell 1000 Value Russell 1000
Russell 2500 Value ru10gatr Growth
Russell 2000 Russell 1000
EAFE
ru10vatr Value
S&P Dev ex-US Sm Cap
MSCI EM
Russell 2500
ru25vatr Value
ru20intr Russell 2000
nddueafe EAFE
S&P Dev ex-
stemwuu US Sm Cap
ndueegf MSCI EM
2/19/2020 19Relative to ACWI, assuming no changes in 2019
The Broadest
• The geographic weighting decision cost 170bp, 24.9 vs. 26.6%
equity
• The factor tilts added back 50bp, 25.4 vs. 24.9%
benchmark
• All together, benchmark decisions cost 120bp, 25.4 vs. 26.6%
2019 BOY 2020 BOY 2019 Perf
Index Category 2019 Perf FCERA % Equities % weighted
MSCI ACWI Index 26.6% 36.8% 100.0% 26.60%
Russell 3000 Index 28.5% 17.9% 48.7% 13.88% FCERA
MSCI ACWI
ex-US Index 21.5% 18.9% 51.3% 11.03%
weighted
Total Equities 24.91% geographic
S&P 500 Large Cap 28.9% 3.8% 10.42% 3.01% benchmarks
Russell 1000
Growth Large Cap Growth 36.4% 5.9% 15.94% 5.80%
Russell 1000
Value Large Cap Value 26.5% 5.5% 14.89% 3.95%
Russell 2500
Value Small Cap Value 23.6% 1.4% 3.77% 0.89%
Russell 2000 Small Cap 25.5% 1.4% 3.70% 0.94%
EAFE Large Cap 22.0% 4.6% 12.44% 2.74%
FCERA
EAFE Large Cap 22.0% 4.5% 12.35% 2.72% composite
S&P Dev ex- benchmark
US Sm Cap Small Cap 24.7% 3.0% 8.16% 2.02%
MSCI EM EM 18.4% 3.2% 8.80% 1.62%
MSCI EM EM 18.4% 3.5% 9.53% 1.75%
Memo: total portfolio 36.8% 100.00% 25.43%
2/19/2020 20Assuming no change to the portfolio during 2019,
manager performance was roughly even with
benchmarks, but still reflect a very strong year
Weighted
Manager Actuals Actual vs. Benchmark Actuals
State Street 28.90% 0.00% 3.01%
T Rowe Price 29.80% -6.60% 4.75%
AJO 21.70% -4.80% 3.23%
Systematic 27.78% 4.18% 1.05%
Pimco StocksPlus 27.65% 2.15% 1.02%
Artisan 30.85% 8.85% 3.84%
RAFI 17.44% -4.56% 2.15%
Mondrian 25.90% 1.20% 2.11%
Baillie Gifford 28.00% 9.60% 2.46%
Mondrian 18.30% -0.10% 1.74%
NT EAFE
Weighted FY performance 25.38%
Existing Benchmark Performance 25.43%
2/19/2020 21But Changes were made to Equity Portfolio 2019
• Terminated Systematic mandate
• Changed TIPS provider from SSGA to Northern Trust
• Changed S&P500 passive from SSGA to Northern Trust
• Redeemed $195mil from T Rowe Price
• Redeemed $157mil from AJO
• Added to S&P 500 passive with Northern Trust: total $540mil
• Redeemed $146mil from Artisan International Large Cap
• Redeemed $ 125mil from Research Affiliates
• Initiated investment in EAFE passive with Northern Trust: $275mil
2/19/2020 222019 Continued along Rebalancing Glidepath
With Very Strong Equity Markets, this will
Prove Additive to Performance
At 12/2018 Target 12/2019 Actual 12/2019
Domestic Equities 18.0% 23.0% 23.4%
Large Cap 15.0% 18.0% 16.2%
Small Cap 3.0% 5.0% 5.0%
overlay 2.2%
International Equities 20.0% 22.0% 22.2%
Large Cap 10.0% 13.0% 12.9%
Small Cap 3.0% 3.0% 3.2%
Emerging Mkts 7.0% 6.0% 6.1%
overlay 0.0% 0.0%
Total Equities 38.0% 45.0% 45.6%
NOTE: private equity 4.7% 6.0% 4.8%
overlay 1.3% 1.3%
All Equity 44.0% 51.0% 51.7%
2/19/2020 23Potential Board Considerations For Equities • Establish Overall equities benchmark: common or custom • Revisit Sub Asset Class benchmarks: Value? Growth? Small? • Set geographic weightings, relative to benchmark • Consider various factor tilts to add Alternate Beta, esp. quality, low vol • Revisit Active Manager lineup against passive alternatives 2/19/2020 24
You can also read