Rebuilding for a More Equitable Future: Priorities for Washington's 2021 Legislature - AAUW Edmonds SnoKing
←
→
Page content transcription
If your browser does not render page correctly, please read the page content below
Rebuilding for a More
Equitable Future:
Priorities for Washington’s
2021 Legislature

MARILYN WATKINS , EOI JAN 9, 2021
FOR AAUW EDMONDS SNOKING

                           OPPORTUNITYINSTITUTE.ORG   1
Successes and Aspirations
Paid Family & Medical Leave
Equal Pay & Opportunity Act
Childcare affordability & compensation
Health care affordability and access
Higher education access
Fair and sufficient state revenue
OPPORTUNITYINSTITUTE.ORG 2
Washington State Legislature
Session begins January 11, 2021
D majorities, increasing diversity:
57 to 41 in House, 28 to 21 in Senate
2021 priorities:
Budget – supplemental & biennial
COVID relief and recovery
Racial justice
Climate change
OPPORTUNITYINSTITUTE.ORG 3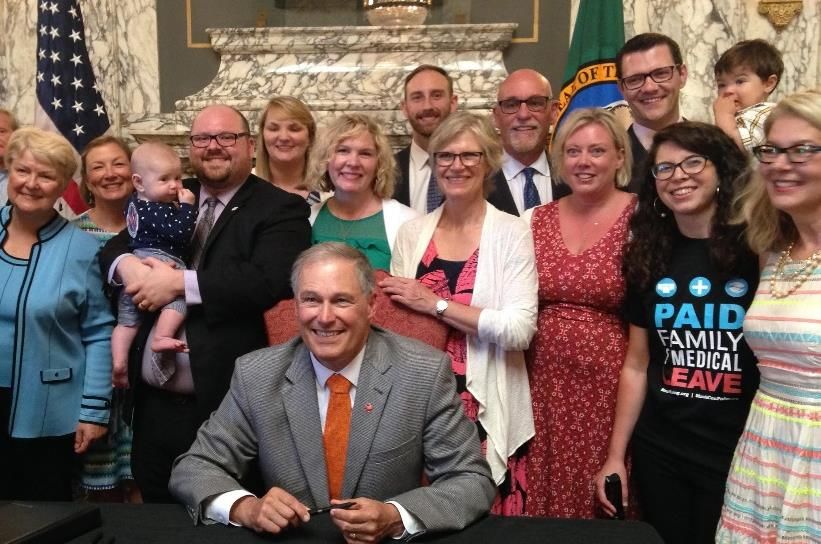
2021 Virtual session
Legislators will hear and pass many fewer bills
All committee meetings, hearings, and legislative debates will be streamed live
on TVW and archived
Written testimony can be submitted through leg.wa.gov, closing 24 hours after
hearing
Live testimony can be given via Zoom or phone – you must sign up at least 1
hour in advance
Link from leg.wa.gov or tvw.org
OPPORTUNITYINSTITUTE.ORG 4
Washington economy and population
grew rapidly 2010-Feb. 2020 – but:
• Top 1% experienced soaring wealth
• Top 20% enjoyed growing incomes
• Majority struggled with skyrocketing costs for housing, health care, child
  care, higher education
• Racial inequality intensified

                                  OPPORTUNITYINSTITUTE.ORG                     5
Wages reflect racial and gender inequity
Men make $13,000 more                        Median earnings WA full-time workers, 2018
annually than women for     $90,000
full-time work.             $80,000
                            $70,000
                            $60,000
White & Asian women         $50,000
make more than men of       $40,000
other racial groups.        $30,000
                            $20,000
                            $10,000
Median earnings mean half        $0
make less – some make                     White            Black           Native       Asian    Pacific   Latinx
much less, some much                                                      American              Islander
more.
                                                                          Women        Men

                            Source: US Census Bureau, American Community Survey 2018

                                               OPPORTUNITYINSTITUTE.ORG                                             6
Single moms and kids at high risk of
poverty before COVID
           Families with Children in Poverty, WA 2019
                                                                                             42.4%
                                                                                                          39.0%
                                                                          31.7%
                     25.7%                     24.2%

                                                                                                     14.4%
                                                                  6.9%                  9.1%
               2.9%                      2.8%

                 White                      Asian                     Black                Latinx    Native Amer
                                                           Married           Single moms

Source: US Census Bureau, American Community Survey 2019

                                                             OPPORTUNITYINSTITUTE.ORG                              7
COVID recession has deepened divides

207,000 Washington families with
children under 18 don’t have enough to                                                                     Feb-Nov     Avg.
                                                                                                              job    Monthly
eat
                                                                                                            change   Earnings
2.7 million Washington workers have                                                Clothing Retail          - 38%    $1,986
lost employment income since March                                                 Accommodations           - 37%    $2,572
1.65 million expect to lose                                                        Arts & Rec               - 19%    $2,870
employment income                                                                  Food Service             - 12%    $2,042
                                                                                   Professional Services    + 4%     $8,734
Top 1% continues to gain wealth

Sources: US Census Pulse Survey and QWI; ESD historical jobs data, seasonally adjusted

                                                                   OPPORTUNITYINSTITUTE.ORG                               8
COVID has exacerbated health disparities
5,263
         4,978      COVID cases per 100,000,                                                             COVID deaths per 100,000
                                                                                            195
                       WA Jan 19-Dec 23
                                                                                    133
                    2,498                                                                                     104
                              2,023
                                         1,409                                                         56
                                                    1,170     1,122                                                               47
                                                                                                                    43
                                                                                                                         34

 Source: As of Dec 23, 2020: https://www.doh.wa.gov/Portals/1/Documents/1600/coronavirus/data-tables/COVID-
 19MorbidityMortalityRaceEthnicityLanguageWAState.pdf

                                                             OPPORTUNITYINSTITUTE.ORG                                         9
State slashed budget in last recession.
Budget cuts 2009-11:
• reduced jobs and incomes, slowed economic recovery
• slashed public health & mental health services long term
• kept childcare and early learning chronically underfunded
• exacerbated racial, gender, and regional inequality
• deprived working families, small businesses, and public agencies of the
  resilience that would have put us in a much stronger position to respond
  to the COVID-19 pandemic

                                OPPORTUNITYINSTITUTE.ORG                     10
Paid Family & Medical Leave helped 170,000
in 2020 – but leaves some behind
HB 1073 --Priority equity improvements:
Reduce qualifying threshold for workers
impacted by COVID
Provide job protection and health insurance for
employees that have been working for 90 days
Expand definition of family
OPPORTUNITYINSTITUTE.ORG 11We can build a more equitable, thriving
economy post-COVID post-Trump if we:
Invest in people and critical services
Prioritize equitable access and outcomes
across state programs and policies
Stay engaged
OPPORTUNITYINSTITUTE.ORG 12We need major investments in health
Steps toward achieving affordable and equitable health care:
• Create Cascade Care subsidies for individual
market
• Extend coverage for new mothers (SB 5068)
• Expand coverage for immigrants
• Invest in foundational public health
• Advance universal coverage
OPPORTUNITYINSTITUTE.ORG 13Child Care on brink before pandemic,
now collapsing
Pre-COVID: Teachers & staff made poverty wages, yet care
unaffordable for families. Now:
29% of workers in child care have been laid off
14% of centers, family homes, and school-aged-care
programs have closed
17% of licensed slots have been lost
42% of all programs are in danger of permanent closure.
COVID health mandates have increased costs of care
OPPORTUNITYINSTITUTE.ORG 14Higher education first in line
for cuts in past recessions
State investment per FTE student in
higher ed, WA 1989-2020, 2019 $$
$25,000
$18,682 Investment can spur more
$20,000
$11,901
equitable recovery, focused on:
$15,000
$10,000 $6,416 Equitable access for students across
$5,000 race, geography, 1st gen
$6,734 $6,204 $5,099
Staffing and resources to both educate
$0
students and help them achieve
UW CTCs degrees
OPPORTUNITYINSTITUTE.ORG 15The budget challenge: Our state revenue
system is inadequate even in good times
WA State General Fund as Share of State Personal Income, 1991-2021
7% 6.6%
6% 5.8%
5.2%
5%
4%
3%
2%
1%
0%
2004
1991
1992
1993
1994
1995
1996
1997
1998
1999
2000
2001
2002
2003
2005
2006
2007
2008
2009
2010
2011
2012
2013
2014
2015
2016
2017
2018
2019
2020
2021
Source: EOI analysis of OFM and BEA data. 2020-21 based on House budget
OPPORTUNITYINSTITUTE.ORG 16Taxable Retail Sales as a % of State Personal Income,
WA 1979-2017
5.5%
4.8% 4.3%
4.2%
3.6%
3.2%
1979 1981 1983 1985 1987 1989 1991 1993 1995 1997 1999 2001 2003 2005 2007 2009 2011 2013 2015 2017
Source: Washington Economic and Revenue Forecast Council data
OPPORTUNITYINSTITUTE.ORGOur tax system is unfair – and makes
inequity worse
Share of income to state & local taxes in
18% Washington, Idaho, and Oregon •The wealthy pay less taxes
WA ID OR in WA than in other states
Percent of Income to taxes
10.1%
9%
11%
•But middle- and low-
8%9.1%
7%
8.1% income people pay more
3% •Neighboring states far
more equitable
bottom20% middle 20% top 1%
Household Income
Source: Institute on Taxation and Economic Policy, “Who Pays,” 2018
OPPORTUNITYINSTITUTE.ORG 18Progressive new state revenue a MUST
Options include:
Capital gains
Corporate tax on high compensation
Estate tax increase
Close the global corporate loophole and fully fund College Grant program
Close the financial income loophole for non-financial companies
Wealth tax
Tax on Income in Excess of $1 million
OPPORTUNITYINSTITUTE.ORG 19Anyone can be an advocate
Do more than just vote and get the right people elected
Get informed
Take action
Share your experiences
OPPORTUNITYINSTITUTE.ORG 20Stay informed
•Sign up for EOI e-newsletter: opportunityinstitute.org
•Watch for and respond to action alerts
•Email any questions or requests:
Marilyn@opportunityinstitute.org
OPPORTUNITYINSTITUTE.ORG 21You can also read