Dental Update - State of Rhode ...
←
→
Page content transcription
If your browser does not render page correctly, please read the page content below
Dental Update
                                    February 2020

“Oral health is multifaceted and includes the ability to speak, smile, smell, taste, chew,
swallow and convey a range of emotions through facial expressions with confidence and
without pain, discomfort, and disease of the craniofacial complex…It is a fundamental
component of health and physical and mental well-being.” - 2016, FDI World Dental
Federation General Assembly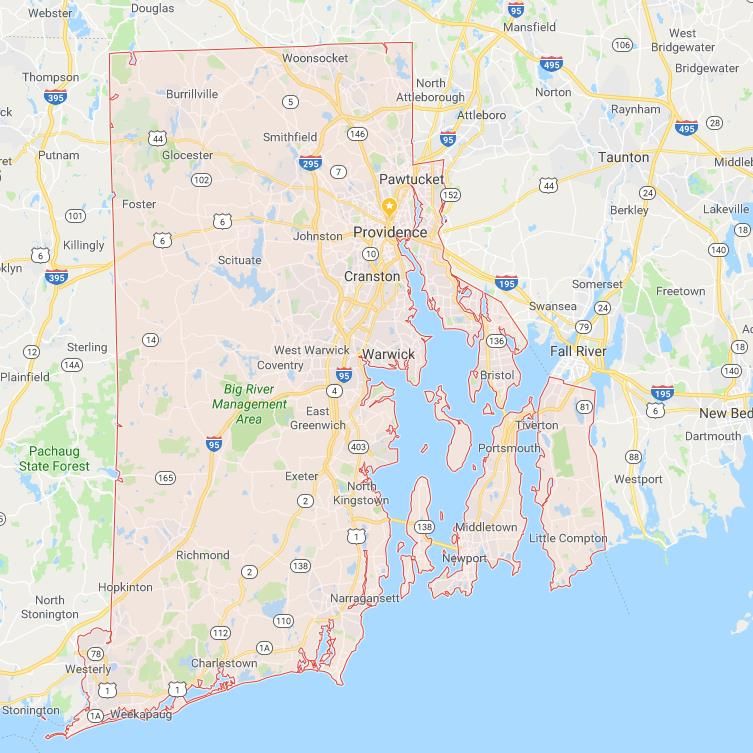
Total visits to ED for Non-Traumatic Dental
Conditions by Payer, 2014-18, Rhode Island
    12,000

                 10,191                10,253
    10,000                                            9,619

                                                                       8,130
     8,000
                                                                                       6,960

     6,000        5,284                5,520          5,384
                                                                       4,349
     4,000                                                                             3,435

     2,000              2,063
                                           1,802          1,678            1,512              1,410

        0
                     2014               2015           2016             2017            2018

               All          Medicaid       Commercial Insurance      Self-Pay      Medicare

2            Rhode Island Department of Health, Hospital Discharge Data, 2018.
Total ED Charges for Non Traumatic
Dental Conditions, 2014-2018
         $17.9M              $18.4M

           $1.M               $1.8M                $16.4M            $16.M
                                                   $1.1M                                $15.2M
          $2.6M                                                       $1.3M
                              $2.7M
                                                   $2.4M                                 $1.9M
                                                                      $2.M
          $2.9M                $2.M
                                                                                          $2.M
                                                   $1.9M              $2.3M
                              $3.5M                                                      $2.2M
          $3.9M                                    $3.2M
                                                                      $3.2M
                                                                                         $3.2M

          $7.6M               $8.3M                $7.8M             $7.3M
                                                                                         $6.M

           2014                2015                 2016              2017                2018
              Medicaid      Commercial Insurance      Self-Pay    Medicare     Other      Total

3   Rhode Island Department of Health, Hospital Discharge Data, 2018. Adjusted to 2018 dollars.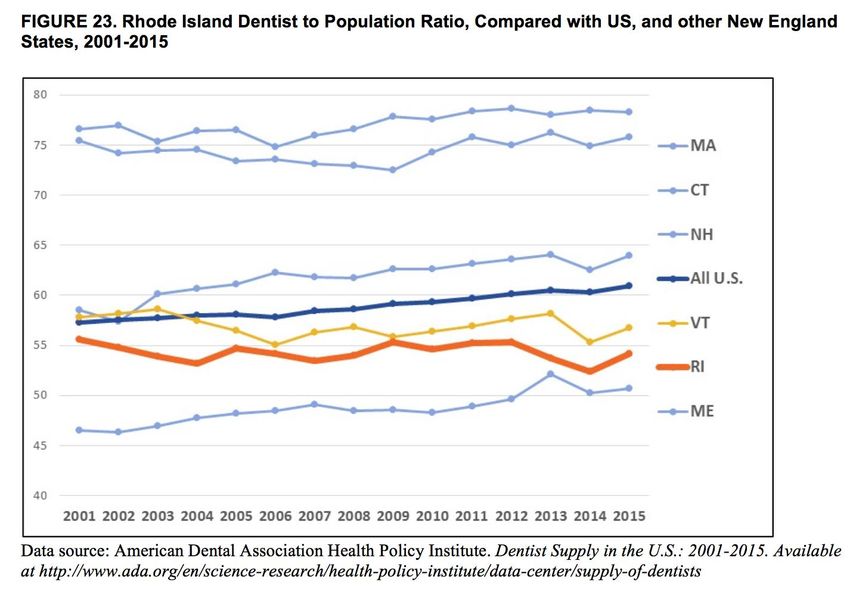
Emergency Department Use by Age (2017)
    Use of the Emergency Department (ED) for dental complaints is high in early adulthood.
    This group is least likely to have regular dentist visits and use preventive services.

4
                      Hospital Discharge Data (HDD), RI, 2017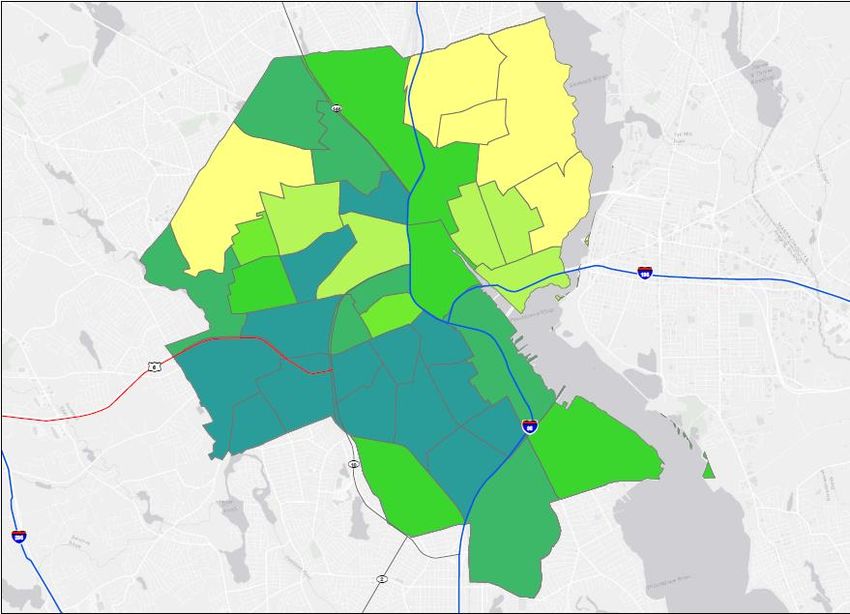
Use of ED for Non-Traumatic Dental
    Conditions: Disparities by Location

5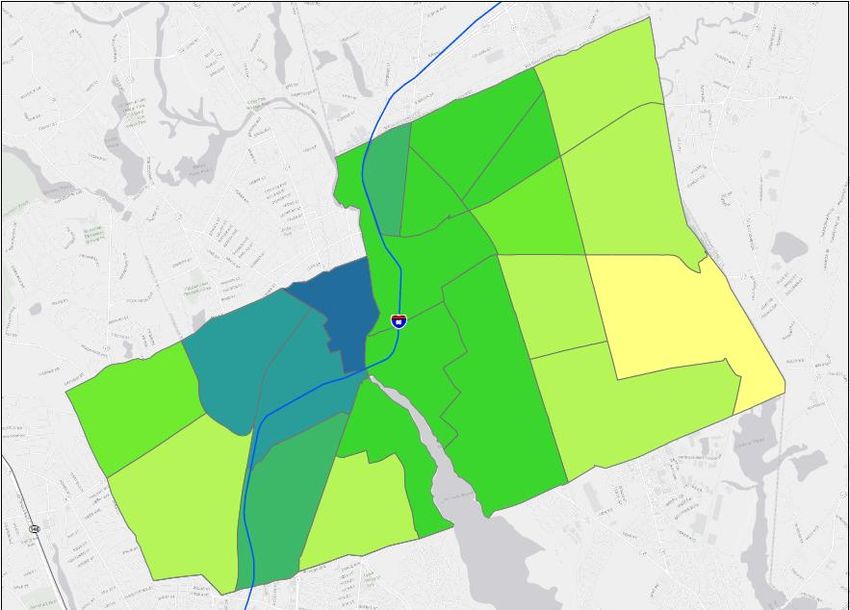
Use of ED for Non-Traumatic Dental
Conditions: Disparities by Race/Ethnicity
    180                                    171.14

    160

    140

    120
                                                            98.58
    100

    80                                                                          70.85

    60                   52.24

    40

    20

     0
                                 Rate of ED visits for NTDC per 10,000 people
          Non-Hispanic White        Non-Hispanic Black       Hispanic      Non-Hispanic Other

6          Rhode Island Department of Health, Hospital Discharge Data, 2018.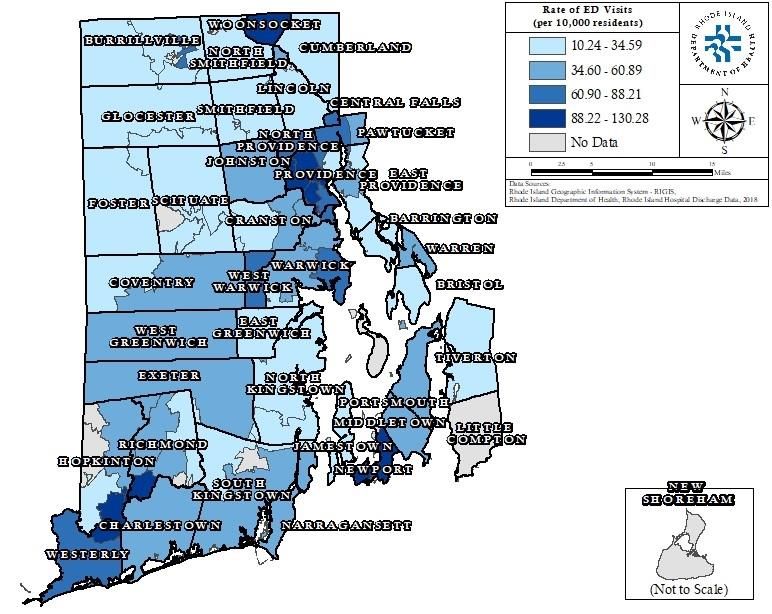
Dental Use by Age by Medicaid Members in RI
    While use among children and teens is high, fewer than 30% of adults used
    any dental service. Of greater concern, use of preventive services – those that
    improve health and reduce long-term cost – dips below 20% for most adults.

8
                                     2017 RI MMIS data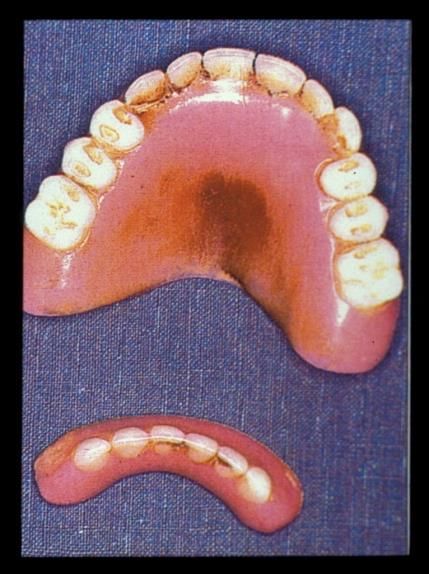
Benefits of Increasing Use of Dental
 Services in Early Childhood
Create a lifelong healthy oral health foundation
Building closer relationships between medical
and dental providers to improve health outcomes
Decreasing health care costs through decreasing
future procedures and ER visits

                                                         Use of OR for RIte Smiles Kids

Non-dental charges for 2 hour OR case estimate= $5000*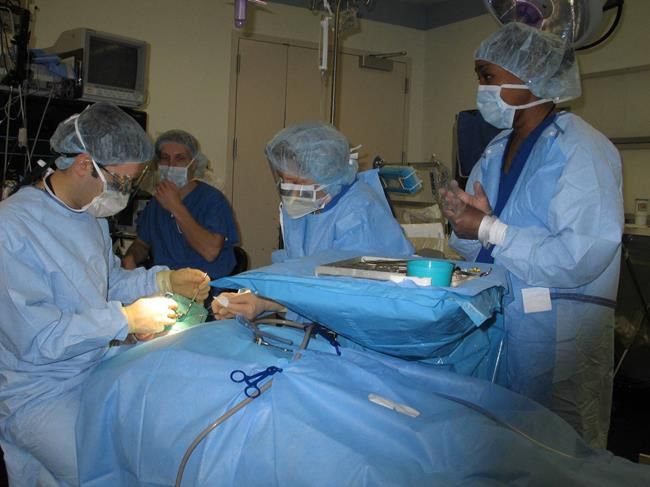
TO INCREASE DENTAL UTILIZATION FOR AGE ONE CHILDREN AND PREGNANT
                                              WOMEN
    The Perinatal and Infant Oral Health Quality Improvement Project was awarded to Rhode Island (RI) by HRSA in 2015. The goal is
    to increase dental utilization for age one children and pregnant women…here’s how RI made that goal a reality!
1
               FIND YOUR CHAMPION                                            3     DEVELOP COORDINATED MESSAGING
               Identify partners with a shared vision to improve oral              Ensure that all partners are spreading the same message.
               health outcomes. RI’s Family Home Visiting Program (FHV)                    The OHP and partners created and disseminated over
               is an essential partner to deliver oral health education to         9,000 bilingual brochures promoting the importance of oral
               families and their very young children. The RI Oral Health          health during pregnancy and the age one dental visit. Our
               Program (OHP) continues to partner with FHV through                 Age One Champion list provides families and providers with
               trainings and data collection.                                      a list of dentists in RI who accept age one children.

    2
                  EDUCATE HEALTH CARE PROFESSIONALS
                  As part of the effort to increase medical and dental
                                                                                       RI Medicaid data is proof that finding champions,
                  integration RI provided 42 medical practices with
                                                                                  educating health care professionals, and developing
                  education about the importance of integrating oral
                                                                                  coordinated messaging increases age one dental visits.
                  health into overall health through fluoride varnish
                  training, academic detailing, and quality improvement
                  training.
Impact of Low Adult Dental Utilization
• Members resort to the ED or wait for the annual
Mission of Mercy free dental clinic
• Oral health strongly correlates to overall health
outcomes; low use among those with chronic
conditions leads to higher overall medical costs.1
• Oral health is important for success and quality of
life. A Harvard Dental study found Improving dental
esthetics increases likelihood of employment.2
Current state:
o Low use of preventive services leads to higher costs
for treatment services
o Health centers provide care, but locations have
significant limitations in scope of services provided
(e.g. dentures, oral surgery)
o Private practice participation has decreased, despite
being cost-effective and well-distributed among RI
cities and towns
11 1. "Medical Dental Integration Study" (Study) Optum and UnitedHealthcare (2013).
2. Halasa-Rampel, Y. Broken Smiles, presentation at Harvard Sch. of Dental Medicine, 2018.Potential Cost Savings National Association of Dental Plans (NADP) 2014 analysis showed that when a preventive dental benefit was provided for adult Medicaid recipients, medical costs for patients with seven chronic conditions were lowered, ranging from 31 to 67 percent. Sample of 15,483 non-Medicare adults between the ages of 25 and 64 from the 2014 Medical Expenditure Panel survey (MEPS) . Preventive dental care indicates having at least one dental visit during the year in which there was a cleaning, examination, fluoride treatment, or sealant procedure
Stories from Families
     Vulnerable adults unable to find complex oral surgery services.
     Adults needing denture services having difficulty finding care

      Lines for free dental care, R.I. Mission of Mercy, 2019

13
City/Town Util 0-18 Util 19-64
CENTRAL FALLS 57% 32.5%
CHARLESTOWN 42% 27.2%
COVENTRY 56% 30.8%
CRANSTON 52% 30.5%
CUMBERLAND 45% 24.3%
EAST GREENWICH 51% 31.1%
EAST PROVIDENCE 48% 24.4%
EXETER 56% 24.8%
FOSTER 49% 36.2%
Pawtucket GLOCESTER 46% 31.9%
HOPKINTON 77% 30.2%
JAMESTOWN 39% 32.6%
JOHNSTON 47% 31.0%
LINCOLN 51% 26.3%
LITTLE COMPTON 43% 20.2%
MIDDLETOWN 54% 25.3%
NARRAGANSETT 55% 38.6%
NEWPORT 51% 24.4%
NORTH KINGSTOWN 51% 35.9%
NORTH PROVIDENCE 47% 26.4%
NORTH SMITHFIELD 46% 28.2%
PAWTUCKET 49% 30.1%
PORTSMOUTH 45% 18.0%
Providence PROVIDENCE 53% 28.0%
Note: A sampling of cities were selected for illustration.
Green indicates above average, pink indicates below average.
Data sources: CDC BRFSS 2016, US Census Bureau, 2010
Census, ACS 2012-2016. Maps not to scaleRI Dentist Participation in Adult Medicaid Has Plummeted
CT
RI MA
The proportion of dentists participating in the Adult Medicaid program fell from
29% in 2012 to 19.5% in 2016.
Primary reasons expressed by dentists:
1. Rates are not compatible with costs of care and have not changed since
1992. Costs of running a practice continue to increase
2. Patients are late or miss appointments, don’t follow through with
recommended prevention strategies, have difficulty making decisions
about care, have medically complex needs, etc.
15 Health Policy Institute, American Dental Association, 2016 Data,
https://www.ada.org/en/~/media/ADA/Science%20and%20Research/HPI/Files/HPIgraphic_0417_1Workforce Dentists per 100,000 • US: 62 • RI: 54 • MA: 78 • CT: 72 Data from Health Policy Institute (HPI) of the American Dental Association (ADA), which asks First-year students in each dental school, what is your home state?
Dental Workforce Members

• Dental Assistants
• Dentists
• Dental Specialists
    • Pediatric Dentists
    • Oral Surgeons
    • Others
• Dental Hygienists
    • Public Health Dental
       Hygienists
• Dental Therapists
17
How to Increase Provider
Participation in the Adult Program??
• Managed care
• California- Prop 56
• Colorado- Take 5 program
• Connecticut- rate increase
• These programs succeeded through collaboration
with state dental associations
18You can also read