ASTHMA IN PITTSBURGH AND ALLEGHENY COUNTY, CURRENT INFORMATION AND FUTURE DIRECTIONS - LUANN BRINK, PH.D., M.P.H. VISITING ASSISTANT PROFESSOR ...
←
→
Page content transcription
If your browser does not render page correctly, please read the page content below
Asthma in Pittsburgh and
Allegheny County, Current
  Information and Future
        Directions
           LuAnn Brink, Ph.D., M.P.H.
           Visiting Assistant Professor
 University of Pittsburgh Graduate School of
                  Public Health
        Department of Epidemiology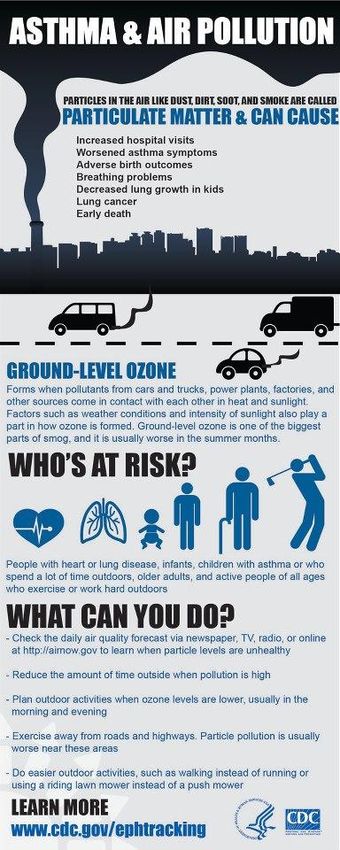
Objectives
• The increasing prevalence of asthma
• The local importance of asthma
• The history of asthma/air pollution
  epidemiology
• The impact of air pollution on asthma
• The local impact of air pollution on
  asthma

The burden of asthma
• In 2009, 25 million people, or 8% of the
  population, had asthma.
  – Compared to 2001, when 20 million, or 7%
  – Asthma rates rose the most among black
    children, an almost 50% increase

CDC Vital Signs “Asthma in the US,” May 2011
Asthma in Allegheny County
 Adults by Race, 2002 and 2009-
25
              2010
20

15
                                                         Black
10                                                       White

 5

 0
                 2002                        2009-2010
     Adapted from AC BRFSS, published 2012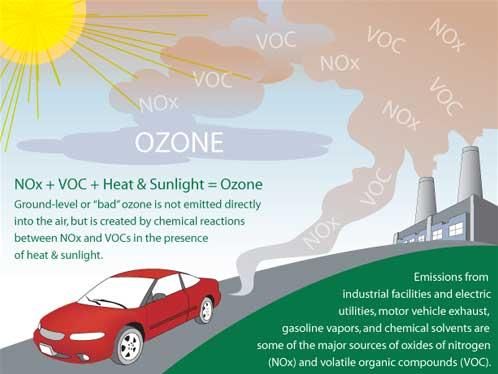
Adults with asthma in the US, 2009

  SOURCE: Behavioral Risk Factor Surveillance System,
  2009

Comparison of National and
   Local Asthma Rates by Race,
20
              2010
18
16
14
                      Current Asthma -- all
12
10                    Current Asthma --
 8                    White
                      Current Asthma --
 6
                      Black
 4
 2
 0
     US   PA    AC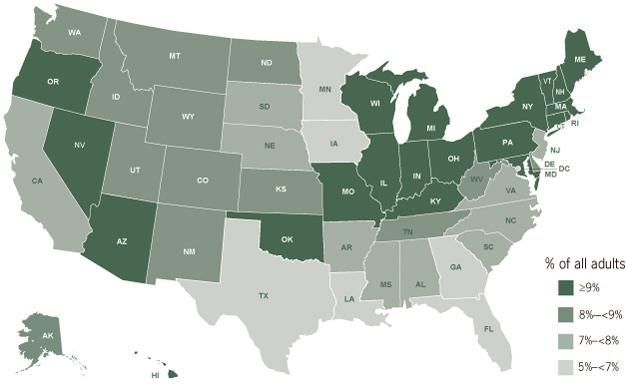
Criteria Pollutants
•   Ozone
•   Nitrogen Oxides
•   Sulfur Oxides
•   Particulate Matter
•   Carbon Monoxide
•   Lead

                           John Balmes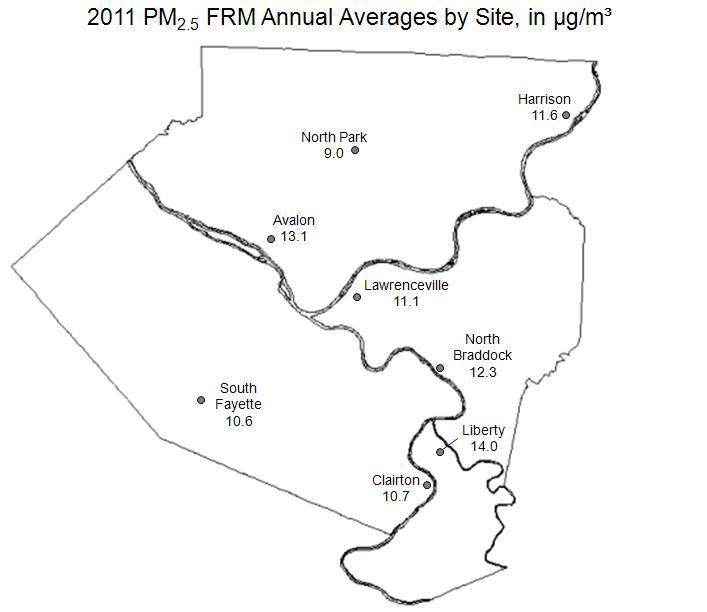
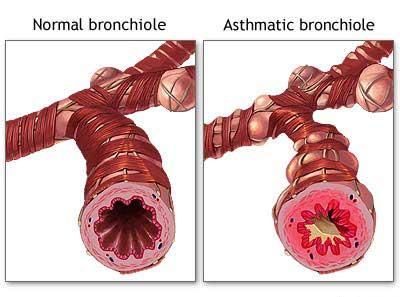
Potential biological mechanism of PM
                effects
Mechanisms of Ozone Toxicity Direct oxidation Free radical formation Lipid peroxidation Secondary inflammation/repair
Nitrogen Oxide
• NO2 not as potent of an oxidant as
  ozone
• NO2 reacts with H2O to form HNO3
Sulfur Dioxide
• The NAAQS for SO2 allows for relatively
  high short-term peak exposures.
• People with asthma are not protected
  from exacerbations caused by brief
  exposures.
Particulate Matter (PM)
• Several studies have documented
  increased respiratory symptoms or
  increased hospitalizations for acute
  respiratory illness in people in
  association with PM exposures.
• Decreased peak flow has been
  observed in panels of normal and
  asthmatic children in association with
  PM10.
The potential impact of traffic
           pollution
• Several studies have shown increased
  respiratory symptoms in children living
  near roadways with increased traffic
  density.
• Several studies have shown increased
  asthma prevalence in relation to traffic
  exposure (with NO2 often showing the
  best single pollutant correlations).
Stebbings 1978 • Pulmonary Function Tests on 224 school children during and after the Pittsburgh air pollution episode of 11/75 • 4 exposed and 2 control schools • Noted strong upward trends in Forced Vital Capacity after episode
Delfino, 1994
• Hospital admissions for respiratory illnesses in
  Montreal between 1984-88 were 21.8% (9.7-33.8%)
  higher for 8-hour maximum increase of 38 ppb
  ozone in the summer
  – Among those >64 years of age
• Asthma admissions in May-October increased by
  2.7% over mean levels for each 12 ug/m3 increase
  in PM10 levels 3 days prior to admission
• In July and August, admissions were 9.6% higher
  when SO4 had exceeded 8.1 ug/m3 4 days prior
  to admission day.
• PM10 had not exceeded the NAAQS of 150 ug/m3
  during the time period.
Villeneuve – 2007
• Case-crossover study of asthma ED
  visits and found that in the summer,
  SO2, NO2, CO, PM2.5, PM10 and
  ozone had significant effects .
  – Children aged 2-4 and elderly were most
    affected
• CO OR=1.48
• NO2 OR=1.5
Yap CA 2013 • Hospital admission in CA by zip code between 2000-2005 • Daily counts of respiratory admissions for – High and low SES by county • Time series adjusting for time trends, seasonality, day of week, temperature, with pollution lags 0-6 days found an association of asthma and pollution • For LA, Riverside, San Bernardino, and San Diego Counties, RR 1.03-1.07/10 ug PM2.5
July 27, 2011
The Relationship of Ambient Ozone and PM2.5
 Levels and Asthma Emergency Department
   Visits: Possible Influence of Gender and
                     Ethnicity
   Glad, Brink, Talbott, Lee, Xu, Saul, Rager

• Data from UPMC, which serves 60% of
  Allegheny County
  – 6979 patients seen in 6 EDs between
    January 2002 and December 2005
  – Discharged with asthma (ICD-9, 493.x)
Daily Air Pollution Data for AC
• Ozone and PM2.5 were obtained from
the ACHD Air Quality Program
– 3 ozone monitors
– 2 continuously operating PM2.5 monitors
• Used ones in center of city, near hospitals of
interest
– Daily 1-hour maximum ozone
– Daily mean PM2.5
– Daily mean temperature and humidityStudy Population • 60.3% Caucasian – Mean age 42.4 – 17.7% over age 65 – 10.9% under age 14 • 37.8% African Americans – Mean age 35.2 – 7.6% over age 65 – 18.9% under age 14
Visits for Asthma
• Ranged from 1-19 visits per person
• African Americans had slightly more
  visits within the time period
The Case-Crossover Design
• First proposed by Maclure in 1991
• Originally designed to avoid selection
  bias from a case-control study
• Designed to answer the question “Is a
  particular health event triggered by
  something that happened just before the
  health event”
• Basic idea: compare a patient’s
  exposure experience on the day of their
  outcome (heart attack) with their
  exposure experience on the day before
Features of Case-Crossover Design
• Only cases are analyzed
• The same individuals “cross over”
  between being cases and being
  controls
  – The idea is that people cross over
    between short periods of exposure to
    hypothetical triggers and much longer
    periods of unexposed time.
Selecting the Referent (Control) Times
• Referent times act as the individually-
matched “controls”
• Approaches to selecting a referent
period
– Basic approach - Match one hazard period
to one referent period (matched pair interval
approach)
– Multiple interval approach – Match one
hazard period to multiple referent periods
• Symmetric bi-directional approach
• Time-stratified approachTime Stratified Sampling Approach
Sun Mon Tue Wed Thu Fri Sat
1 2 3 4
5 6 7 8 9 10 11
12 13 14 15 16 17 18
19 20 21 22 23 24 25
26 27 28 29 30
49Confounding
• The case-crossover design controls for
measured and unmeasured
confounders that do not change over
time, such as age, gender, genes.
• Confounding by time-varying factors
is possible – e.g., seasonal patterns,
day of week, long term trends
– Can be limited by choice of referent
time periodsGlad, Brink, Talbott 2012
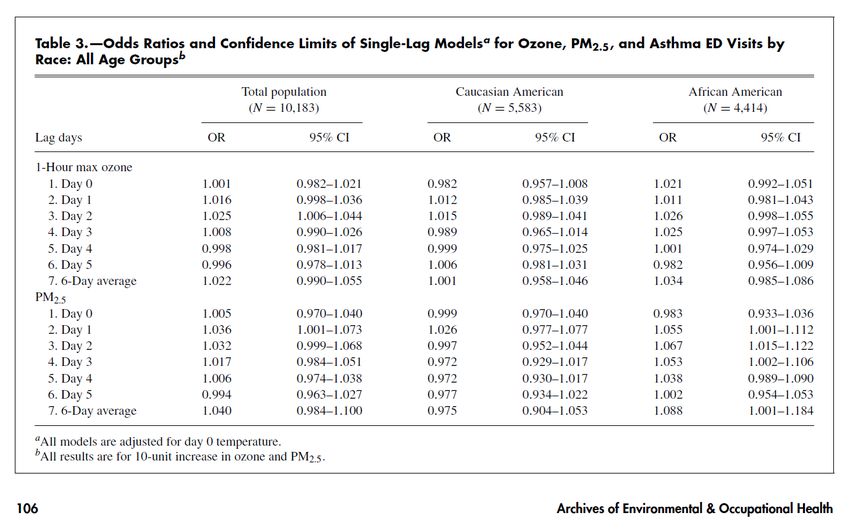
Conclusions
• A 10 ppb increase in the 1-hour daily
  maximum ozone level was significantly
  related to a 2.5% increase in asthma
  ED visits 2 days later
• When considering PM2.5 also, ozone
  contributed a 2.1% increase 2 days
  later.
• One day after PM2.5 exposure, a 3.6 %
  increase in asthma ED visits occurred
Conclusions continued
• Although the entire population were
  affected 2 days after a PM2.5 pollution
  event, this effect was not significant
  among Caucasians (1.015, 0.989-1.041)
  – It was higher among African Americans,
    1.025, 0.997-1.053, driving the overall
    effect
Possible reasons for differences • Access to medical care • Access to air conditioning • Intrinsic differences • Different distributions of pollutants
Strengths and Limitations
• ED visits provide a strong and specific
  outcome measure
• Use of case-crossover design allows
  control for seasonality, secular trends,
  and time-invariant factors
• Use of a single monitor to estimate
  exposure
• Sample of ED visits may not be
  representative of all ED visits
Current Work:
Asthma Predictive
    Modeling
  Sharma, Brink
Statistical Methodology • Mixed Model longitudinal analysis using Poisson regression is used analyze daily times series of asthma, circulatory and respiratory counts from 2004-2005 • Risks are estimated and presented in the tables as rate ratio
Results to date
• Based upon asthma hospitalization
  occurring in 2004-2005, a significant
  increase in asthma hospitalizations with
  same-day increase in PM2.5 was
  noted.
Conclusions
• Recent studies conducted in Pittsburgh
  indicate an effect of both ozone and
  PM2.5 on asthma exacerbations in
  Pittsburgh, PA
You can also read