Backcalculating the Incidence of Infection with COVID-19 on the Diamond Princess - MDPI
←
→
Page content transcription
If your browser does not render page correctly, please read the page content below
Editorial

Backcalculating the Incidence of Infection with
COVID-19 on the Diamond Princess
Hiroshi Nishiura 1,2
 1 Graduate School of Medicine, Hokkaido University, Kita 15 Jo Nishi 7 Chome, Kita-ku, Sapporo-shi,
 Hokkaido 060-8638, Japan; nishiurah@med.hokudai.ac.jp; Tel.: +81-11-706-5066
 2 Core Research for Evolutional Science and Technology (CREST), Japan Science and Technology Agency,
 Honcho 4-1-8, Kawaguchi, Saitama 332-0012, Japan

 Received: 25 February 2020; Accepted: 25 February 2020; Published: 29 February 2020

 Abstract: To understand the time-dependent risk of infection on a cruise ship, the Diamond Princess,
 I estimated the incidence of infection with novel coronavirus (COVID-19). The epidemic curve of a
 total of 199 confirmed cases was drawn, classifying individuals into passengers with and without
 close contact and crew members. A backcalculation method was employed to estimate the incidence
 of infection. The peak time of infection was seen for the time period from 2 to 4 February 2020, and
 the incidence has abruptly declined afterwards. The estimated number of new infections among
 passengers without close contact was very small from 5 February on which a movement restriction
 policy was imposed. Without the intervention from 5 February, it was predicted that the cumulative
 incidence with and without close contact would have been as large as 1373 (95% CI: 570, 2176) and
 766 (95% CI: 587, 946) cases, respectively, while these were kept to be 102 and 47 cases, respectively.
 Based on an analysis of illness onset data on board, the risk of infection among passengers without
 close contact was considered to be very limited. Movement restriction greatly reduced the number
 of infections from 5 February onwards.

 Keywords: incidence; forecasting; virus; statistical estimation; emerging infectious diseases

1. Introduction
 An outbreak of novel coronavirus disease (COVID-19) has occurred on a cruise ship, the
Diamond Princess [1]. The primary case remains unknown, but the index case, defined as the first
identified case, is a passenger who started coughing from 19 January 2020 on board, disembarking
the ship in Hong Kong on 25 January. As the case was diagnosed on 1 February, the ship was
requested to remain in the ocean near Yokohama from 3 February onwards. Subsequently, the
movement of all passengers was restricted on board from 5 February, for a matter of 14 days of
quarantine. Out of a total of 3711 persons (consisting of 2666 passengers and 1045 crew members),
199 symptomatic cases have been diagnosed on board as of 24 February, and additional
asymptomatic infections and symptomatic cases after disembarkation have also been reported.
 One of the critical issues in infectious disease epidemiology is that the time of infection event is
seldom directly observable. For this reason, the time of infection needs to be statistically estimated,
employing a backcalculation method [2]. Using a sophisticated statistical model with doubly interval-
censored likelihood and right truncation with an exponential growth of cases, the mean incubation
period has been estimated to be about 5.0 days [3]. To understand the time-dependent risk of infection
throughout the course of outbreak and estimate the effectiveness of the quarantine measure from 5
to 19 February 2020, I aimed to estimate the incidence of infection with COVID-19 and also predict
the likely number of infections prevented by the quarantine measure.

J. Clin. Med. 2020, 9, 657; doi:10.3390/jcm9030657 www.mdpi.com/journal/jcm
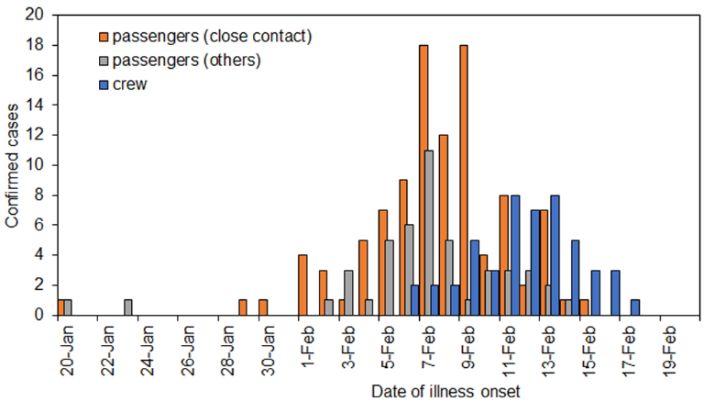
J. Clin. Med. 2020, 9, 657 2 of 4

2. Backcalculation and Forecasting
 I analyzed the epidemic curve, ct, on day t, illustrated by the number of confirmed cases by the
date of illness onset. The confirmatory diagnosis was made, using the reverse transcriptase
polymerase chain reaction (RT-PCR). The date of illness onset was defined as the first date of fever.
In addition to the date of illness onset, cases were classified by contact history inside the cabin and
also by the type of membership, i.e., crew or passenger. Close contact was defined as having at least
one cabinmate who was confirmed by RT-PCR.
 We estimate the number of cases by time of infection, it. Using the probability mass function of
the incubation period of length s, fs, the incidence of infection is known to satisfy

 ( ) = , (1)

where E(.) represents the expected value. As for fs, it is known that the mean and standard deviation
are 5.0 and 3.0 days, respectively, best fitted by lognormal distribution [3]. Employing a step function,
the incidence of infection was statistically estimated via a maximum likelihood method. The
estimation was implemented independently by the history of contact and type of membership.
 Regarding the real-time forecasting, we employed the so-called Richards model, an analogue to
the generalized logistic model [4,5]:

 ( ) = , (2)
 (1 + exp(− ( − ))
where is the cumulative incidence on day t, Z is the cumulative incidence at the end of the
outbreak, s is the parameter that governs the flexibility of the logistic curve, a is the early growth rate
of cases and ti is the inflection point of the cumulative incidence curve. Assuming that the cumulative
incidence is Gaussian distributed, four unknown parameters were estimated. The Richards model
was fitted to two different datasets, i.e., (i) the dataset of the entire course of the epidemic and (ii) the
dataset by 4 February 2020. The latter dataset corresponds to the time period without any impact of
movement restriction that was in place from 5 February onwards.

3. Estimated Incidence
 Figure 1 shows the epidemic curve by contact history and type of membership. The highest
incidence of illness onset was observed on 7 February. The epidemic curve in a latter half period was
dominated by crew members whose movement was not strictly controlled due to the need to continue
service on the ship. The second dominating group was passengers with close contact history. The last
illness onset date on board of a passenger without close contact was on 14 February.

 Figure 1. The number of confirmed cases of COVID-19 by contact history and the type of membership
 from 20 January to 20 February 2020 on the Diamond Princess (n = 199). Close contact was defined as
 passengers with a confirmed case among their cabinmates.
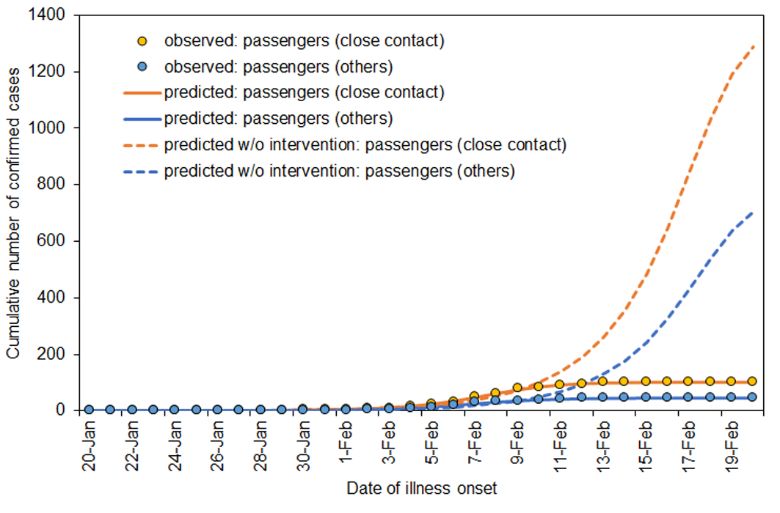
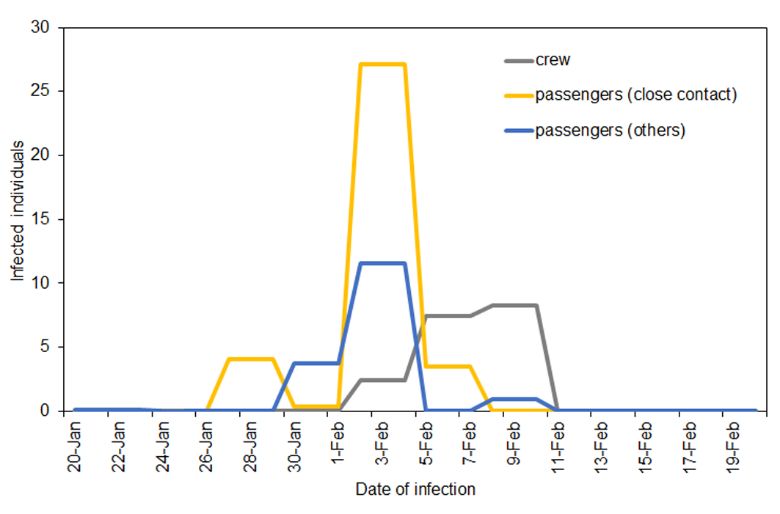
J. Clin. Med. 2020, 9, 657 3 of 4

 Estimating the incidence of infection, the peak incidence was identified for the period from 2 to
4 February among passengers both with and without close contact (Figure 2). The incidence of
infection abruptly dropped after 5 February, the date of movement restriction. Among passengers
without close contact, the incidence was estimated to be zero, except for 8–10 February 2020, during
which 0.98 persons (95% confidence intervals (CI): 0, 7.74) per day were estimated to have been
infected. The epidemic peak among crew members was seen for the period from 8 to 10 February
2020.

 Figure 2. Estimated incidence of infection COVID-19 by contact history and the type of membership
 from 20 January to 20 February 2020 on the Diamond Princess (n = 199). Close contact was defined as
 passengers with a confirmed case among their cabinmates.

 Figure 3 compares the cumulative incidence with and without movement restriction policy from
5 February. In the presence of intervention, the cumulative incidence among passengers with and
without close contact and crew members were 102, 47 and 48 cases, respectively, as of 24 February
2020. These were well realized by the Richards model. Without intervention from 5 February
onwards, it was predicted that the cumulative incidence with and without close contact would have
been 1373 (95% CI: 570, 2176) and 766 (95% CI: 587, 946) cases, respectively.

 Figure 3. Comparisons between observed and predicted cumulative incidence of cases with COVID-
 19 on the Diamond Princess. The intervention, i.e., movement restriction, was in place from 5
 February onwards. Dashed lines represent predictions without accounting for the dataset from 5
 February 2020. Close contact was defined as passengers with a confirmed case among their
 cabinmates.
J. Clin. Med. 2020, 9, 657 4 of 4

4. Discussion and Conclusions
 A large outbreak of COVID-19 occurred on a cruise ship. Estimating the incidence, the peak time
of infection was shown to have been from 2 to 4 February, and the incidence abruptly declined
afterwards. The estimated number of new infections among passengers without close contact was
very small from 5 February, on which the movement restriction policy was imposed, and at most
there was, on average, one case of infection per day from 8 to 10 February. Other than continued
exposure among crew members, the estimated incidence in this study indicates that the movement
restriction policy from 5 February 2020 was highly successful in greatly reducing the number of
secondary transmissions on board. Based on an analysis of illness onset data on board (and before
the disembarkation of a large number of passengers), the risk of infection among passengers without
close contact was considered to be very limited
 Among disembarked passengers, symptomatic cases have started to be reported on the ground
in and outside of Japan. In particular, cases arising from passengers without close contact indicate a
possible pathway of infection via mechanisms that were not covered by the abovementioned analysis
that relied on symptomatic cases. Although the transmission via direct human-to-human contact was
prevented by movement restrictions, the role of other modes of transmission, e.g., environmental and
asymptomatic transmissions, should be further explored.
Funding: H.N. received funding from the Japan Agency for Medical Research and Development (AMED) [grant
number: JP18fk0108050]; the Japan Society for the Promotion of Science (JSPS) KAKENHI [grant numbers, H.N.:
17H04701, 17H05808, 18H04895 and 19H01074], the Inamori Foundation, and the Japan Science and Technology
Agency (JST) CREST program [grant number: JPMJCR1413].

Conflicts of Interest: The author declares no conflict of interest.

References
1. National Institute of Infectious Diseases. Field Briefing: Diamond Princess COVID-19 Cases; National Institute
 of Infectious Diseases: Tokyo, Japan, 2020. Available online: https://www.niid.go.jp/niid/en/2019-ncov-
 e/9407-covid-dp-fe-01.html (accessed on 25 February 2020).
2. Nishiura, H. Estimating the incidence and diagnosed proportion of HIV infections in Japan: A statistical
 modeling study. PeerJ 2019, 7, e6275.
3. Linton, N.M.; Kobayashi, T.; Yang, Y.; Hayashi, K.; Akhmetzhanov, A.R.; Jung, S. Epidemiological
 characteristics of novel coronavirus infection: A statistical analysis of publicly available case data. J. Clin.
 Med. 2020, 9, 538.
4. Nishiura, H.; Tsuzuki, S.; Yuan, B.; Yamaguchi, T.; Asai, Y. Transmission dynamics of cholera in Yemen,
 2017: A real time forecasting. Biol. Med. Model. 2017, 14, 14.
5. Nishiura, H. Joint quantification of transmission dynamics and diagnostic accuracy applied to influenza.
 Math. Biosci. Eng. 2011, 8, 49–64.

 © 2020 by the authors. Licensee MDPI, Basel, Switzerland. This article is an open access
 article distributed under the terms and conditions of the Creative Commons
 Attribution (CC BY) license (http://creativecommons.org/licenses/by/4.0/).
You can also read