2019 Monsoon Outlook - National Weather Service
←
→
Page content transcription
If your browser does not render page correctly, please read the page content below
2019 Monsoon Outlook                                                                                     Albuquerque
For Central & Northern New Mexico                                                                             WEATHER FORECAST OFFICE

        Weak El Niño Results in a Positive Pacific-North American (PNA) Pattern

                                                                                                  NM

             Figure 1. Idealized Positive PNA Pattern During Winter               Figure 2. 2019 Positive PNA Pattern

Let’s begin this climate outlook with by first discussing why the weather has been so cool and relatively wet since the start of
2019. A weak El Niño has resulted in a positive state of the Pacific-North American Teleconnection Pattern (PNA). The
image on the left is an idealized version of a positive PNA during December, January, and February while the middle image shows
where the pattern set up in 2019. Will the positive PNA pattern continue into July and if so, how could it impact the North
American Monsoon (NAM)?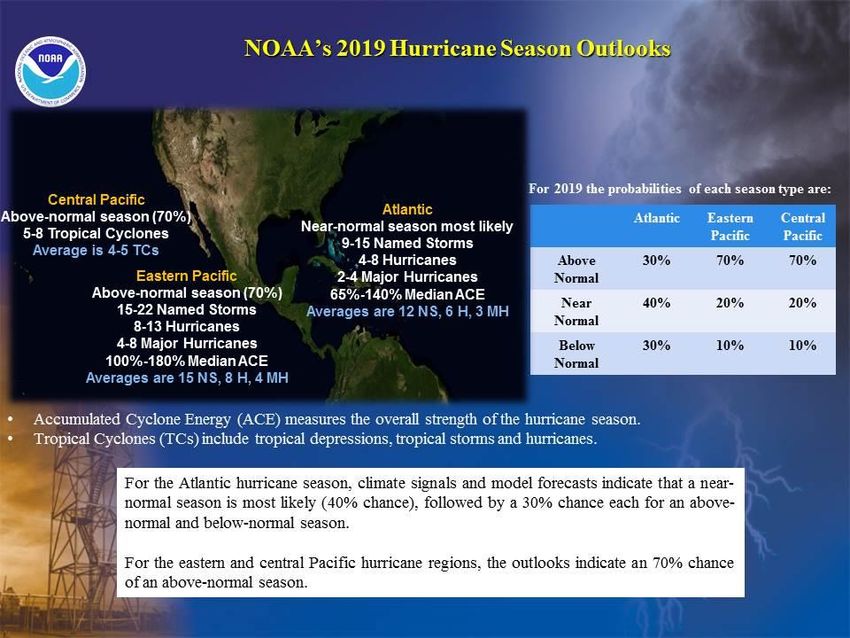
2019 Monsoon Outlook                                                                                               Albuquerque
 For Central & Northern New Mexico                                                                                     WEATHER FORECAST OFFICE

    Figure 3. An idealized Walker circulation shifted westward during El Niño

                                                                                Figure 4. Observed Weekly Sea Surface Temperature Anomalies

What controls the strength of the North American Monsoon (NAM)? Does deep snowpack in late spring and early summer in
the southern and Central Rockies make a major difference in the onset date or strength of moisture surges? The answer is multi-
faceted and not entirely understood but the common denominator seems to be the strength and location of the Walker
Circulation, a pattern in the tropical Pacific of air rising in the west and sinking in the east with westward moving air at the
surface. Anomalous ocean warming in the central and eastern Pacific (orange) help to shift the rising branch of the Walker
Circulation westward. Climate.gov drawing by Fiona Martin.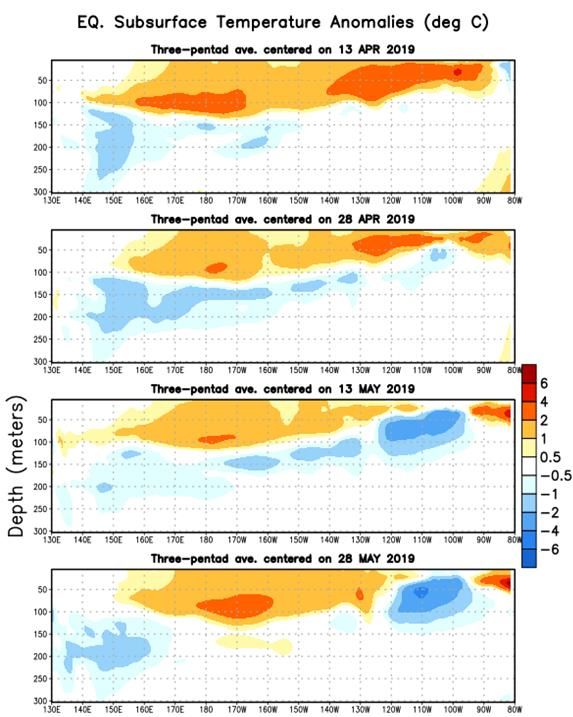
2019 Monsoon Outlook                                                                                   Albuquerque
North American Monsoon (NAM) – What is it?                                                                 WEATHER FORECAST OFFICE

                                                                               Courtesy: Todd Shoemake

The North American Monsoon (NAM), like its much stronger cousin the Asian or Indian Monsoon, is the result of the polar jet
stream and sub-tropical upper-level highs migrating northward during the warm season. The word “monsoon” comes from
the Arabic word mausim, meaning season. Essentially, it describes a seasonal wind shift over a region that is usually accompanied
by an increase in moisture and precipitation, accounting for nearly half of annual precipitation for much of New Mexico. Source
regions for the moisture include, the Gulf of Mexico, Gulf of California and the eastern Pacific Ocean. Monsoon onset dates in the
U.S. Southwest typically begin in mid to late June in northwest Mexico (Sonora, Chihuahua, Sinaloa, and Durango) and early July in
New Mexico and Arizona.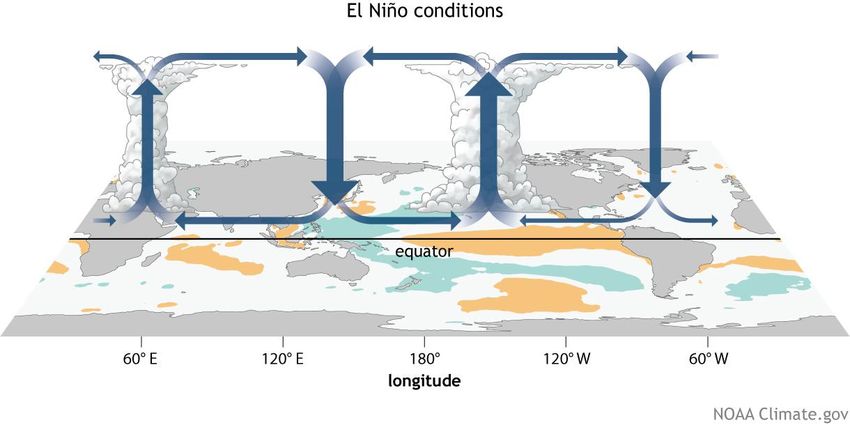
2019 Monsoon Outlook                                                                                 Albuquerque
 Current Sea Surface Temperatures (SSTs)                                                                  WEATHER FORECAST OFFICE

                                                                                        ➢ Multivariate ENSO Index
                                                                                        (MEI) for APR-MAY 2019: +0.3
*SSTs are what
drive tropical &                                                                        ➢ Pacific Decadal Oscillation
sub-tropical                                                                            (PDO) for MAY 2019: +1.03
thunderstorms.
It’s these                                                                              ➢ Atlantic Multidecadal
thunderstorms                                                                           Oscillation (AMO) for MAY
that drive global                                                                       2019: +0.087
weather & climate.
                                                                                        ➢Pacific Meridional Mode
                                                                                        (PMM) for MAY 2019: +3.01

                                                                                        ➢Oceanic Niño Index (ONI)
                                                                                        (uses Niño 3.4 region - inner
                                                                                        rectangle) for MAM 2019: +0.8

                     Figure 5. SST Anomalies in the Equatorial Pacific Ocean in early
                     June 2019 showing neutral conditions in the equatorial Pacific.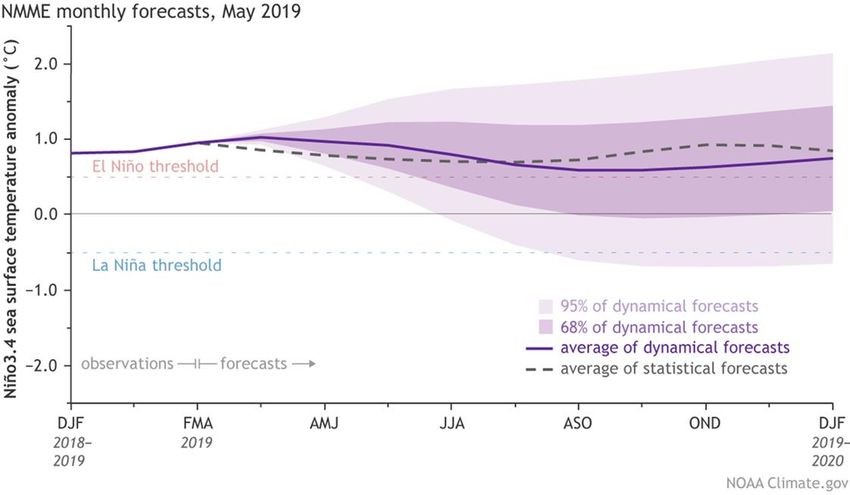
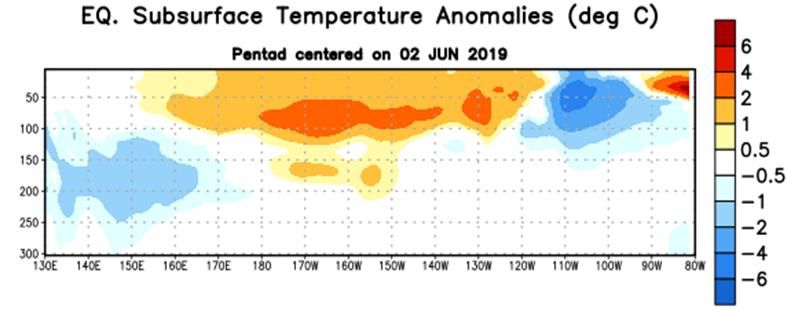
2019 Monsoon Outlook                                                                                Albuquerque
 Sub-surface Temperatures                                                                               WEATHER FORECAST OFFICE

Figures 6 & 7. Sub-surface temperature anomalies at the equator. Sub-surface temperatures often lead the surface temperatures
by several months. An increasing amount of warm water under the surface provides confidence in climate models that are
forecasting weak El Niño conditions continuing through summer and into early fall. Sub-surface temperatures remain warm across
the central Pacific Ocean.
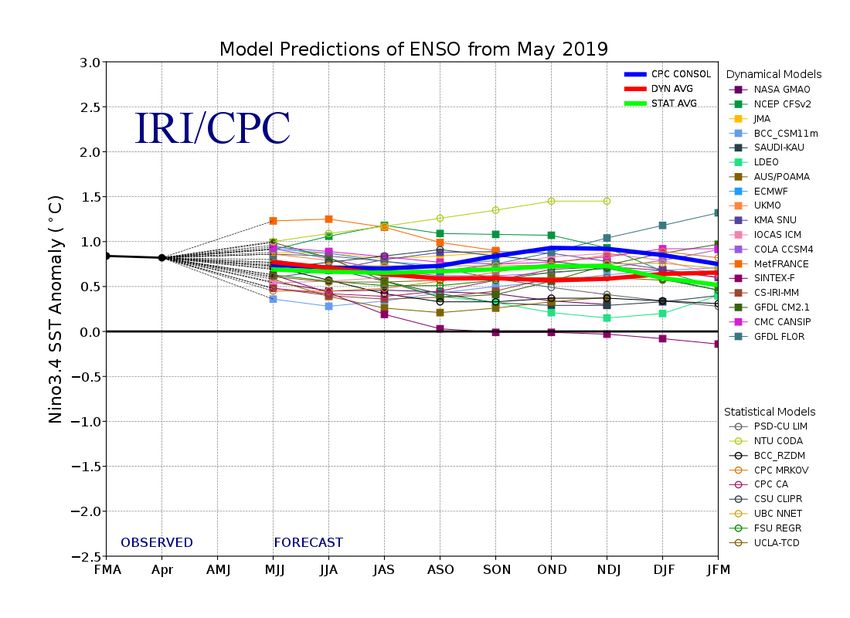
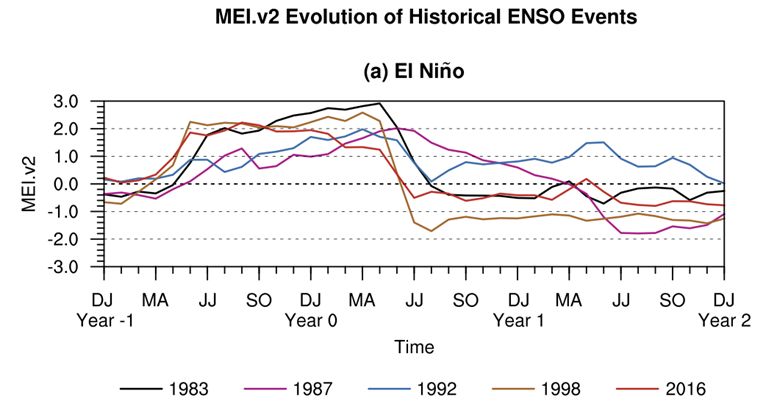
2019 Monsoon Outlook                                                                    Albuquerque
Multivariate El Niño Index (MEI) - Analog Years                                             WEATHER FORECAST OFFICE

Figures 8 & 9. Five similar El Niño events using the Multivariate El Niño Southern Oscillation Index (MEI) since
1950 (left). It would be unprecedented (since 1950) for El Niño to maintain its strength or slightly strengthen
through the summer months as forecast (right).
2019 Monsoon Outlook                                                                              Albuquerque
 Analog Years – 2014 & 2015                                                                          WEATHER FORECAST OFFICE

Figures 10-12. SST Anomalies from the two most recent analog years June 2014 and June 2015, and current conditions. Warmer-
than-average waters (orange) tend to evaporate more water and warm the air above, creating more rising motion and
clouds/thunderstorms compared to average.
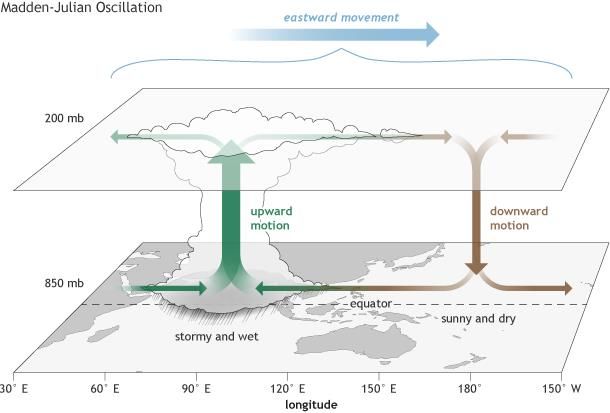
2019 Monsoon Outlook                                                                                 Albuquerque
 Madden-Julian Oscillation (MJO)                                                                         WEATHER FORECAST OFFICE

Figure 13. The MJO is an area of enhanced thunderstorms that travels around the world every 30 to 60 days from west to east
along/near the equator. Ahead and behind the active stormy area are areas of suppressed convection and drier conditions. The
MJO affects near-surface wind patterns, because the rising air in the stormy area causes surface winds to blow toward the active
area. The MJO can play a role in New Mexico’s weather at any time of year but it tends to have its greatest impacts during
September.
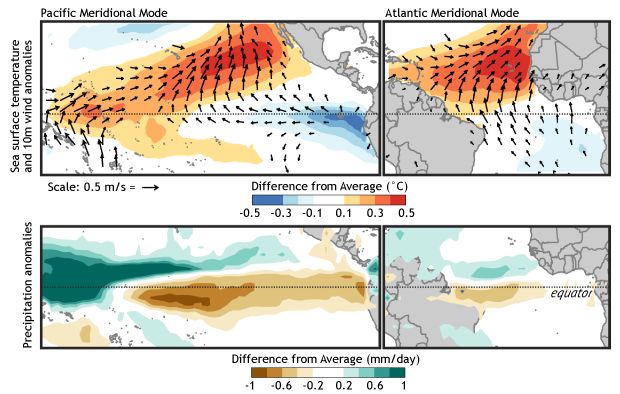
2019 Monsoon Outlook                                                                                     Albuquerque
 Pacific Meridional Mode (PMM)                                                                                WEATHER FORECAST OFFICE

Figure 14. Tropical patterns associated with the positive state of the Pacific (left) and Atlantic (right) Meridional Modes (MM). The
top panels show SST anomalies (shading) and near-surface wind anomalies (arrows), and the bottom panels show precipitation
changes vs. average. Red (green) shading indicates above-average SST (precipitation) and blue (brown) shading indicates below-
average SST (precipitation). MMs are defined by a distinctive sea-surface warming and southwesterly wind anomaly in the vicinity
of the Intertropical Convergence Zone (ITCZ) during boreal spring. In other words, a positive PMM leads to stronger low level
moisture advection northeastward toward the southwest U.S. during the North American Monsoon. Additionally, the majority of
El Niño events over the past four decades are preceded by a positive PMM (Chiang and Vimont 2004, Chang et al., 2007).
2019 Monsoon Outlook                                                                                              Albuquerque
 More on the PNA                                                                                                       WEATHER FORECAST OFFICE

Figures 15 & 16. In the positive state of the PNA, above-average pressure is found over the sub-tropical Pacific and centered over western
Canada. Below-average pressure occurs over the North Pacific Ocean and along the southeast United States. The negative state of the PNA
results in the same pattern except with opposite anomalies. One recent study showed that when the MJO-related convection (an area of rising
air that lead to clouds and rainfall) is located over the Indian Ocean and Maritime Continent, negative PNA-like patterns become more likely,
while a positive PNA is more likely when MJO-related convection is located closer to the central Pacific. Tropical and sub-tropical convection in
winter and spring 2019, thanks in large part to a weak El Niño, has been centered over the central Pacific and a positive PNA is the result. Who
cares? Once a particular phase of the PNA develops, it takes major changes (not anticipated) in the tropics to switch PNA phases for more than
a few weeks. In other words, it’s a ‘preferred’ atmospheric pattern that is expected to last through summer 2019. What could it mean for the
North American Monsoon (NAM)? Possibly stronger than average troughs along/near the west coast, forcing the sub-tropical high typically over
the Great Basin and Southwest U.S. farther east or southeast over Texas leading to greater than average deep monsoon moisture plumes.
2019 Monsoon Outlook                                                                             Albuquerque
 Precipitation Forecasts for July, August & September (JAS)                                         WEATHER FORECAST OFFICE

  Skill

  Precipitation
  rate anomaly
  forecast

Figures 17-22. Climate model precipitation rate anomaly plots from the three climate models which have the highest skill
percentages (top images), the North American Multi-Model Ensemble (NMME), Coupled Forecast System (CFSv2), and the
Canadian Meteorology Center (CMC1) model. All three model forecasts (bottom images) are forecasting near to slightly above
average precipitation for July,August, and September (JAS) precipitation in New Mexico.
2019 Monsoon Outlook                                                                               Albuquerque
Temperature                                                                                            WEATHER FORECAST OFFICE

Figures 23-28. Climate model temperature anomaly plots from the three climate models which have the highest skill
percentages (top images), the North American Multi-Model Ensemble (NMME), Canadian Meteorology Center (CMC1) and the
National Center for Atmospheric Research (NCAR) Community Climate Model Version 4. Model forecasts (bottom images)
indicate near to slightly above average temperatures in JAS. The NMME output is from a group/ensemble of model runs while the
CMC1 and CFSv2 are single runs.Typically, single model runs will show greater precipitation and temperature extremes.
2019 Monsoon Outlook                                                                              Albuquerque
 ENSO Predictions                                                                                     WEATHER FORECAST OFFICE

Figure 29. El Niño is likely to continue through the Northern Hemisphere summer 2019 (70% chance) and fall (55-60% chance).
2019 Monsoon Outlook                                                                                  Albuquerque
Climate Prediction Center                                                                                 WEATHER FORECAST OFFICE

Figures 30 & 31. CPC agrees with the climate model consensus of near to slightly above average chances for above average
precipitation. Generally speaking in summer, above average thunderstorm activity would lead to high temperatures near to slightly
below average with low temperatures near to above average given higher dew point temperatures and increased cloud cover. It’s
worth noting that below average summer temperatures in New Mexico are a rare occurrence these days. Since 2000, only four
July through September periods have experienced slightly below average temperatures with the 13 remaining years above to well
above the average statewide mean of 83.7°F.
2019 Monsoon Outlook                                                                                Albuquerque
                                                                                                        WEATHER FORECAST OFFICE

Figure 32. Hurricane Season Outlooks forecast a 70% chance for an above-average season in the Eastern Pacific Basin.
2019 Monsoon Outlook Albuquerque
WEATHER FORECAST OFFICE
Summary
➢ Forecasts from the most highly skilled climate forecast models indicate that precipitation in
central and northern New Mexico during July, August and September 2019 will most likely
range from near to slightly above 1981-2010 climatological averages.
➢ Climate model forecasts along with recent temperature trends indicate that temperatures in
central and northern New Mexico during JAS 2019 will most likely range from near to slightly
above average.2019 Monsoon Outlook Albuquerque
Outlook Information WEATHER FORECAST OFFICE
References
• Chiang, J. C. H., D. J. Vimont, 2004: Analogous Pacific and Atlantic Meridional Modes of Tropical
Atmosphere–Ocean Variability. J. Climate, 17, 4143-4158.
• Chang, P., L. Zhang, R. Saravanan, D. J. Vimont, J. C. H. Chiang, L. Ji, H. Seidel, M. K. Tippett, 2007: Pacific
meridional mode and El Niño—Southern Oscillation. Geophysical Research Letters.Vol. 34, Issue 16.
➢ Outlook provided by National Weather Service Forecast
Office Albuquerque, NM.
➢ For further information contact Andrew Church:
andrew.church@noaa.gov (505) 244-9150You can also read