NOAA's National Weather Service Advanced Hydrologic Prediction Services - How to implement the regional map inline frame
←
→
Page content transcription
If your browser does not render page correctly, please read the page content below
NOAA’s National Weather Service
         Advanced Hydrologic Prediction Services
         How to implement the regional map inline frame

©2012 Office of Hydrologic Development/Office of Climate Water and Weather Service
Introduction
NOAA’s National Weather Service (NWS) provides a wide variety of hydrologic and hydrometeorologic
forecasts and information through the web. These web-based resources originate at NWS field, national center,
and headquarters offices and are designed to meet the needs of a wide range of users from someone who needs
the five-day forecast for a river near his home to the technically advanced water manager who needs
probabilistic information to make long-term decisions on allocation of flood mitigation resources or water
supply. The NWS will continue to expand and refine all types of web products to keep pace with the demands
of all types of users.
Hydrologic resources location
The NWS Hydrologic resources can be accessed at http://water.weather.gov, or at http://weather.gov and
clicking on “Water” in the navigation above the national map.
Regional Map – River Observations and River Forecasts
The regional AHPS map inline frame (or iframe, as it will be referenced throughout the rest of this document)
consists of several components: toggles to change which gauge markers display on the map; ESRI map controls;
flood status indicators and location-based data view selectors. The starting point, which is available outside of
the iframe component, is a national map providing a brief summary to the river and stream location statuses
within the continental United States. From this national overview, you can navigate to specific regions – state,
Weather Forecast Office (WFO), River Forecast Center (RFC) and Water Resource Region (WRR) – by
2selecting an option by neighboring dropdown menus or clicking on marker images on the map.
In the case of the iframe component, the map already begins zoomed in to a specific region, which can be set to
a default location within the iframe HTML code.
In the narrow dark blue area immediately above the national map, a white pull-down menu can be used to
change the display of river/stream locations from all locations (default) to:
Hydrograph Only Locations – hydrographs for individual river/stream locations provide a graphical
overview of observed conditions at a river/stream gage. Selecting this option causes the map to show
only the locations for which hydrographs are available. Hydrograph-only locations are denoted by
square-shaped icons.
Hydrograph/Probability Forecast Locations – specialized products with information on the probability of
future river levels/flows are also available for selected river/stream locations. Selecting this option
causes the map to show only the locations for which observed and forecast data are available.
Hydrograph/probability forecast locations are denoted by circle-shaped icons.
Inundation Mapping Locations – a small but increasing number of river/stream locations which, in
addition to hydrographs, have specialized flood inundation mapping. Selecting this option causes the
map to show only locations for which these inundation maps are available. Inundation mapping
locations are denoted by square- or circle-shaped icons.
In the same dark blue bar above the map, you can toggle between River Observations and River Forecasts.
Switching between observations and forecasts will load all gauge markers relevant to the selected region,
regardless of the gauge display and location type displays selected prior to the switch.
In all browsers except for Internet Explorer, users can print the content of the iframe map as it appears on their
monitor after toggling gauge location marker displays, zooming or panning the port view of the map window, or
changing from Map view to Satellite view. In Internet Explorer, the “Print this map” link will be replaced with a
link to a set of instructions for how to print the map. This link will open the printable document or the
instructions for printing in a new window or tab, depending on how your browser is configured to open new
links.
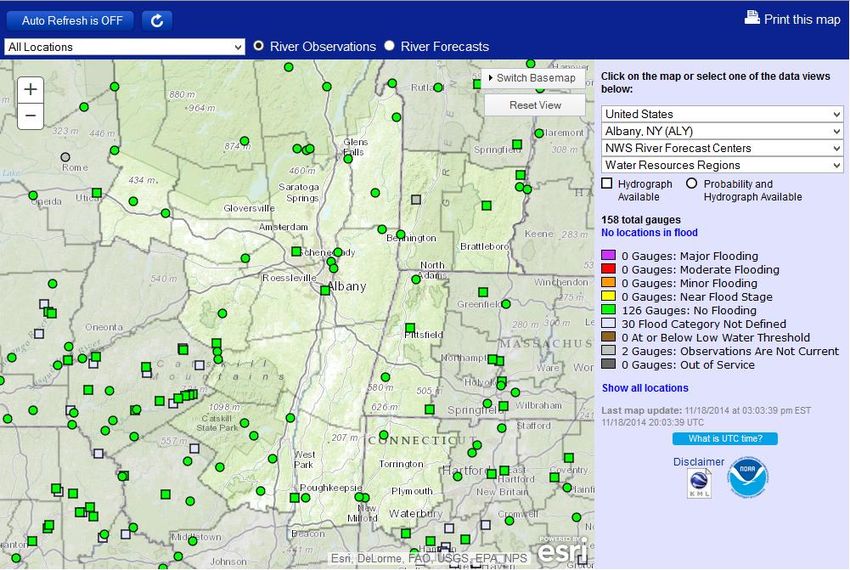
River/stream locations displayed within the iframe ESRI map are color-coded according to the flood status of
their most recent observation or highest available forecast as follows:
No Flooding (green) – river/stream below level where flooding becomes a concern.
Near Flood Stage (yellow) – flooding becomes a concern. River/stream is approaching or is forecast to
approach the gage height – flood stage – where flooding is defined to begin. Flood stage is an
established gage height for a given location at which a rise in water surface level begins to create a
hazard to lives, property, or commerce.
Minor Flooding (orange) – minimal or no property damage, but possibly some public threat.
Moderate Flooding (red) – some inundation of structures and roads near stream. Some evacuations of
people and/or transfer of property to higher elevations.
Major Flooding (violet) – extensive inundation of structures and roads. Significant evacuations of
people and/or transfer of property to higher elevations.
The last three of these levels constitute the flood categories used by the NWS.
3In addition to these five colors, there are three colors that are used to show gauge locations that are not
providing current information:
Observations older than 24 hours (light gray) – In River Forecasts, “Forecasts older than 24 hours”.
No updated observations or forecasts have been issued from the station within the past 24 hours.
Out of Service (dark gray) – The station has been reported by the managing WFO as no longer in
service. This may be due to a variety of reasons, such as technical malfunctions or natural causes like a
build-up of ice.
No forecast within selected timeframe (medium gray) – River Forecasts only. A forecast may be
available, but the “good through” date provided by the station falls expires before the selected
timeframe. By default, location markers on the River Forecast map are loaded to reference a period of
48 hours, but can be extended in the iframe settings to a period as great as 10 days (240 hours) in the
future.
Color codes for river forecasts are the same as those for river observations, according to the maximum forecast
stage during the next 48 hours. The forecast map generally shows fewer locations than the River Observations
map, because river/stream forecasts (e.g., daily) are produced for fewer locations than where observations are
available. When high water or flooding occurs or threatens to occur, “nonroutine” flood forecasts may be
issued.
The display of river/stream location markers can be isolated according to color through the legend icons on the
right side of the map. For example, if you wanted to see all locations in a state currently experiencing or
forecast to experience Major Flooding, you would click on the violet rectangle next to the gauge count (“#
Gauges:”) and category description (“Major Flooding”). This action shows only location markers that have a
status of Major Flooding. If you wanted to see all locations experiencing any level of flooding – minor,
moderate or major – you would click on the text that says “# locations in flood”, # representing an actual value.
If no locations are experiencing any flooding, this text will instead say “No locations in flood,” as demonstrated
in the illustrating image for this section. To display all icons once more, click on “Show all locations,” located
just below the major legend content.
The option to download a .KML file, which can be viewed in Google Earth, is available through a link below
the map marker color legend and “Last update” timestamp. Depending on the page you are viewing the map
from – River Observations or River Forecasts – the KML file will display all river/stream gauge location
markers for that region specific to the observation or forecast category.
Map controls are available inside of the map to refine the area displayed in the view port. Users can pan up,
down, left and right; zoom in or out (within predefined limits specific to the region); view the area as a
cartographic representation of the region or as satellite imagery; create a zoom box to control where and how far
the zoom goes; and reset the view port to its original settings.
Implementing the map
To implement the NWS AHPS Regional River Observation/Forecast map on your site, you will need to know
the region type and its abbreviation and whether you want the Observation or Forecast map to be the default
option on page load. If you are unsure of the identifier you need to use for the map, go to
http://water.weather.gov/ahps and select your region from the dropdown menus on the right side of the page.
The identifier will be in the URL after the region type (state, wfo, rfc or wrr).
You will also need access to the code structure for the page on which you wish to display the iframe map. If you
do not have access to the code, you will need to send the following sample script to your website manager.
To best display the map, you will need an area of 1000 pixels wide by 830 pixels tall in which the map iframe
4will populate. You can also set the scale variable to ‘true’ to make the iframe fit into a 960 by 830 pixel area by
narrowing the map from 700 pixels to 660. This can be used to make the iframe fit into the new weather.gov
layout without corrupting the formatting of the page. You are also encouraged to leave the frameborder attribute
at 0 and disable the scrolling attribute. If you choose to use the height without controls and do not disable
scrolling, the width will be modified by the scrollbar and will not fit the desired dimensions. See minimum
values for dimensions in the table below.
Filename Min Min Height Width Without Scale Width With Scale
Height Without Controls Option Option
With
Controls
region_iframe.php 830 pixels 700 pixels 1000 pixels 960 pixels
region_forecast_iframe.php 875 pixels 745 pixels 1000 pixels 960 pixels
The iframe code goes between the opening and closing body tags within the page’s scripts.
The following snippets are for River Observations maps.
1. For state observations, where MO represents the two-letter abbreviation for the state you want to display
(in this case, Missouri), and the scale variable makes sure that the output has width 960. :2. For Weather Forecast Office forecasts, where BOX represents the three- or four-letter WFO ID you want
to display (in this case, Boston):
3. For River Forecast Office forecasts, where ABRFC represents with the five-letter abbreviation for the
RFC you want to display (in this case, Arkansas Red-Basin River):
4. For Water Resource Region forecasts, where 17 represents the one- or two-digit WRR ID you want to
display (in this case, Pacific Northwest):
6You can also read