Multiscale modelling of Urban Weather - Humphrey Lean, Sylvia Bohnenstengel, Omduth Coceal MetOffice@Reading, Reading, UK
←
→
Page content transcription
If your browser does not render page correctly, please read the page content below
Multiscale modelling of Urban
Weather
Humphrey Lean, Sylvia Bohnenstengel, Omduth Coceal
MetOffice@Reading, Reading, UK
Maths Foresees, Leeds, Jan 2018
Motivation for urban NWP
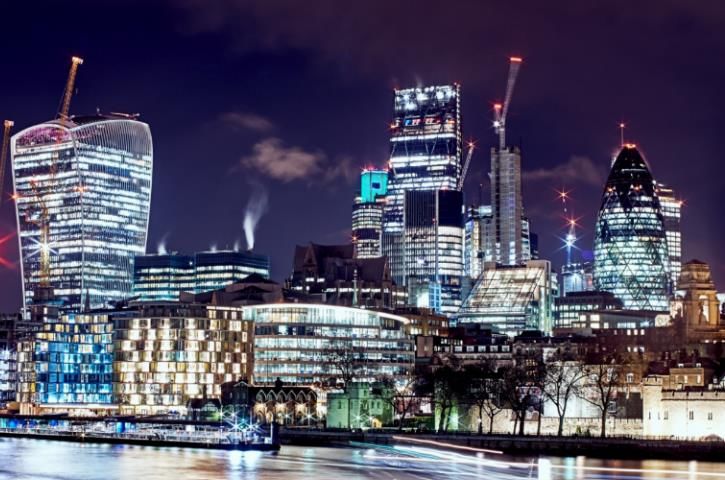
• Large proportion of the population live in
cities
• There are a number of meteorological
hazards that we would like to forecast.
Flooding, heat, poor air quality etc
• Several involve other coupled models (e.g. air
quality requires chemistry model, flooding
requires hydrology) but:
• Good representation of urban meteorology is
fundamental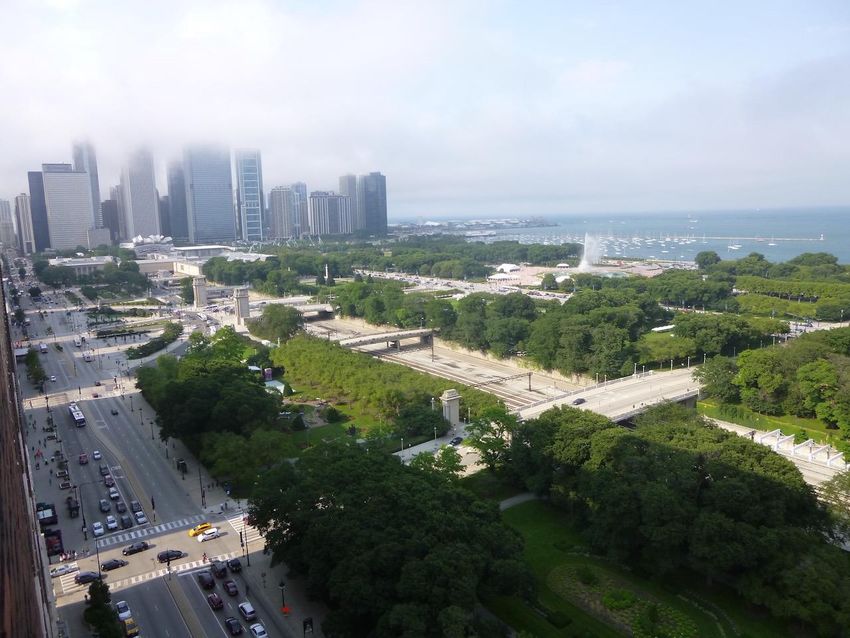
For example: Air quality crucially
dependent on urban meteorology
From Oke 1987
• Synoptically driven winds encounter change in roughness, heat flux –
strong vertical mixing
• Gradual deceleration of wind; adjustment of surface fluxes;
adjustment of mean profiles of wind and temperature
How do flow and turbulence behave at different urban scales?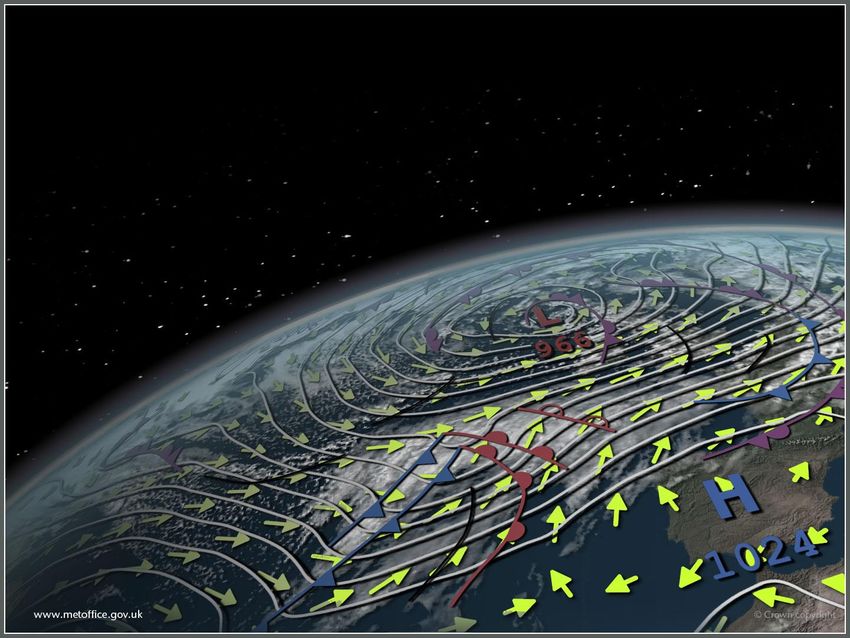
(Euro4)

UKV (1.5km) urban representation

               Reading!

•Sufficient to get
coarse urban
effects in large
cities (in this case
Urban Heat Island).
MORUSES
Met Office Reading Urban Surface Exchange Scheme
CdT/dt = Rnet - L - H - G + Qa
W Bohnenstengel et al., 2011
Steve Evans, UCL,
R virtual London
netRad
netRad
Heat
Heat
flux
flux
storage storage
Frontal area index London urban fraction
H Resistance UM 1 km
network allows
different flow
regimes
bulk z0h, CH
Ground heat flux
W
plan 1
R
SOIL
2HW
front
W R Packing density
MORUSES Met Office Reading Urban Surface Exchange Scheme
MORUSES
            Impact on screen level temperature in clear, calm conditions
            in London

                                                          Observations
                                                          courtesy of Sue
                                                          Grimmond and
                                                          Janet Barlow

•MORUSES removes delay in 1 tile scheme.

                                    Rob King and Sylvia Bohnenstengel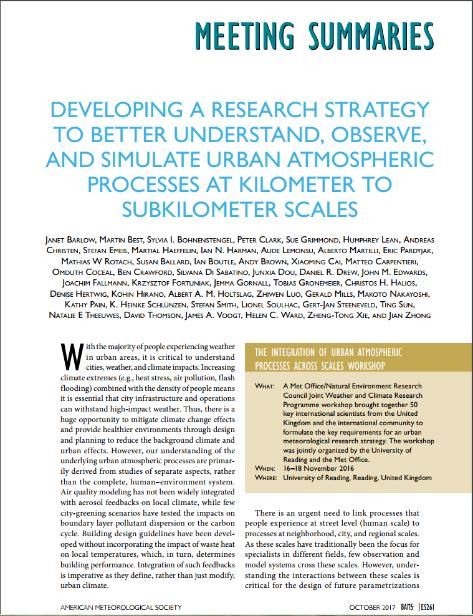
Domain size
        Global           Modelling regimes
        NWP/
1000km  Climate
                      Regional
                      NWP/
                      Climate
100km

 10km
          Range of scales
          Domain/gridlength      10         100      1000        10000
          (related to no of
 1km      gridpoints i.e.                                 Building
          computer power)
        Grey Zones:                   building            resolving
               convection                                 LES
                                       turbulence
100m
             10km             1km       100m        10m          1m
                                Gridlength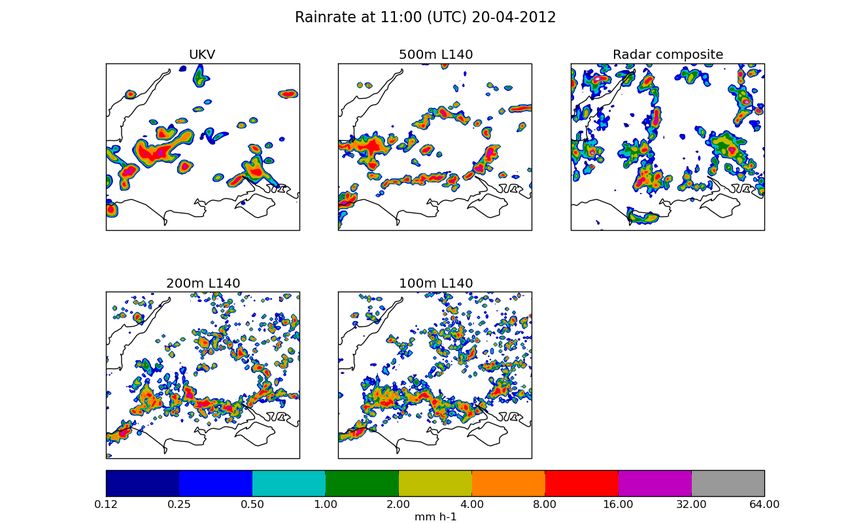
Model regimes
• Need to distinguish between models
  different averaging assumptions
  (distinction particularly important in “grey
  zones”!).

• LES assumes simple volume averaging
  over gridcell.

• Mesoscale models assume ensemble
  (Reynolds) average – decompose into
  average and fluctuations in time and space
Next Steps
• Met Office strategic aim to develop
  O(100m) models of urban
  environment to forecast hazards
  such as urban heat islands, air
  quality and urban flooding on
  weather and climate timescales. MO
  Science Strategy 2016-2021
• Would like a model, with appropriate
  parameterisations, which will make
  the best possible job of representing
  the urban boundary layer at scales
  O(100m) including the urban
  canopy.
• Currently formulating a strategy to
  take this forward.
© Crown copyright Met Office
Representation of urban surfaces

• International workshop,
Reading Nov 2016 to
discuss issues and
strategy.

• Headline conclusion was
that main issues are
heterogeneity on many
scales and anthropogenic
sources.

• Barlow et al (2017)
BAMS.
Domain size
        Global           Modelling regimes
        NWP/
1000km  Climate
                      Regional
                      NWP/
                      Climate
100km
                                       Research:
                                       Cityscale
                                       NWP/Climate
 10km
          Range of scales
          Domain/gridlength      10         100       1000        10000
          (related to no of
 1km      gridpoints i.e.                                  Building
          computer power)
        Grey Zones:                   building             resolving
               convection                                  LES
                                       turbulence
100m
             10km             1km       100m         10m          1m
                                Gridlength
O(100m) UM Research Models at
Met Office
• Cold pooling in valleys COLPEX (Clark, Vosper, Carter)
• Convection DYMECS (Lean, Halliwell, Hanley)
• Fronts (Eagle, Harvey)
•Tornadoes (Hanley)
• StCu (Boutle)
• Fog inc nesting in ensemble LANFEX (Boutle, Porson)
• London (Lean) and 333m routinely running model of
London area for fog (Finnenkoetter, Boutle)
• Also various models by UM Partners.
© Crown copyright Met OfficeIncreased resolution improves
convection
• Heavy/light ratio appears to improve with increased
resolution.
© Crown copyright Met Office
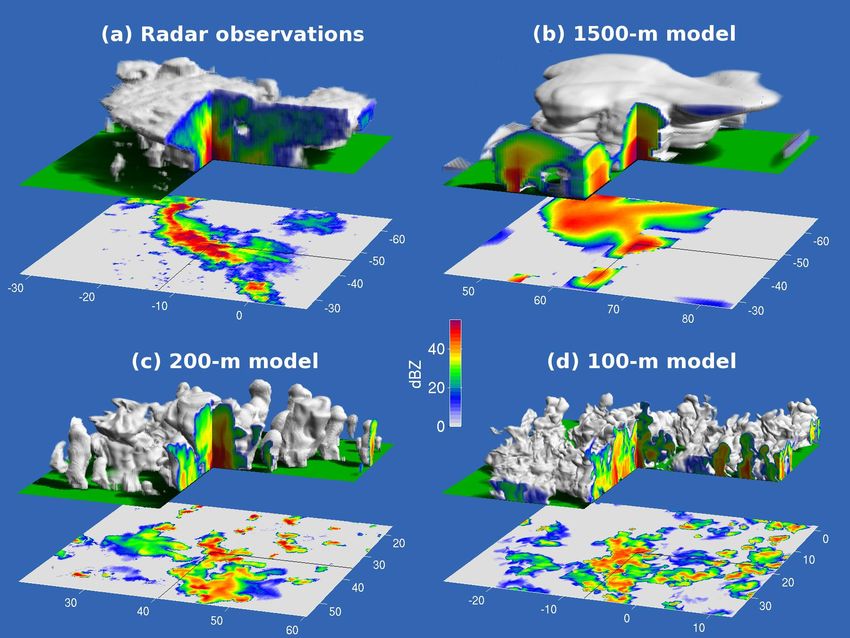
Kirsty Hanley DYMECSDYMECS – Met Office + University of Reading
Track storms in
real time using
Chilbolton radar.
Derive properties
of hundreds of
storms –
evaluate these
properties in
model.
Cutaway:
reflectivity
Surface: rainrate
Shading: extent
of cloud
Fragmentation (AKA “Blobbiness”) at high res may be due
to turbulence grey zone or microphysics issues.
Robin Hogan –DYMECS ProjectUKV problems often imported from
larger scales
03UTC UKV 09UTC UKV Radar
12-18UTC
Accumulations
Warmer temps ahead
of front in 09UTC run 23rd April 2011
due to different frontal Floods in
structure.
Sheffield
© Crown copyright Met OfficeSmall Scale Predictability
Bodmin Moor Flood 3 UTC 17th Nov 2010
Radar UKV UK4
Frontal structure better in UKV (line segments) but UK4 gave better (larger)
accumulations over Bodmin Moor – line segments in wrong place.
• Need to avoid presenting data from models or verifying on
unpredictable scales or scales affected by large scale uncertaint
→ Ensemble/probability/neighbourhood
© Crown copyright Met Office approaches.100m Research model
Luton
Chelmsford
80x80km
Nested in UKV
And 500m
Urban fraction
(from 25m data)
Guildford
Tunbridge Wells
© Crown copyright Met Office100m Research model
South-North (along wind) transect
0km 80km
Mixing height (large domain)
Mixing height (small domain)
Urban fraction
© Crown copyright Met OfficeRange of scales important for
practical applications.
• Example: Sea breeze
from coasts interacting
with city.
• Number of model
gridpoints related to
range of scales
represented (=cost of
model).
• Requirement is
ameliorated by nesting or
variable resolution.
© Crown copyright Met Office 25th July 2012 Vertical velocity at 293mFour Big Issues with city scale models. 1. Turbulence grey zone (not specific to city models). 2. Anthropogenic sources 3. Building grey zone/inhomogeneity on all scales. 4. Tall buildings Various combined problems also important e.g. Isolated tall buildings or groups of tall buildings are a combination of 3 and 4…
The terra-incognita
                                  l = turbulence integral length scale

                                 Δ = model filter scale

                                 Turbulence is resolved if Δ > l
                                 (mesoscale)

                                 Terra incognita if Δ ~ l
      Wyngaard (2004)

What turbulence schemes are appropriate in the partially-
resolved regime?
The terra-incognita
l = turbulence integral length scale
Δ = model filter scale
Turbulence is resolved if Δ > l
(mesoscale)
Terra incognita if Δ ~ l
Wyngaard (2004)
What turbulence schemes are appropriate in the partially-
resolved regime?
Also relevant to problems with deep convection in high res
models.COPE IOP2 5/07/2013 w at 325m
Kirsty Hanley
1.5km 500m
200m 100m
Break between 500m and 200m where turbulence starts to be resolved
© Crown copyright Met OfficeCOPE IOP2 5/07/2013 w comparison with observations. Kirsty Hanley Break between 500m and 200m
30th Sept 2011 vertical velocity spectra
                    dry convective BL at 190m ht.

  Εf
            BT Tower
            observations
            500m
            100m
            50m

                                          BT Tower data courtesy Janet Barlow
© Crown copyright Met Office    f Hz
Anthropogenic effects
•Anthropogenic heat and moisture fluxes.
•Complicated feedbacks (e.g. building heating/cooling) and
temporal patterns (e.g. travel to work, days of week etc).
•Requires understanding of human behaviour.
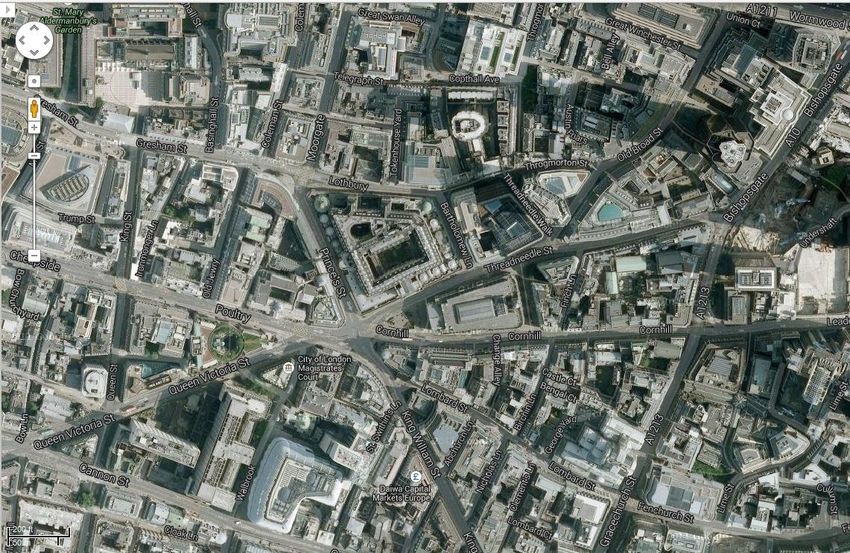
© Crown copyright Met OfficeBuilding “Grey Zone” and inhomogeneity
100m grid
superimposed
on city of
London
• building “grey zone” – neither
resolved or many per gridbox.
© Crown copyright Met OfficeBuilding “Grey Zone” and inhomogeneity
100m grid
superimposed
on city of
London
• Inhomogeneity on many scales.
© Crown copyright Met OfficeBuilding “Grey Zone” and inhomogeneity
100m grid
superimposed
on city of
London
• Inhomogeneity on many scales
© Crown copyright Met OfficeBuilding “Grey Zone” and inhomogeneity
300m
© Crown copyright Met OfficeBuilding “Grey Zone” and inhomogeneity
• Current approaches make assumption of
many buildings per gridbox and horizontal
homogeneity.
• Boundary Layer schemes ignore horizontal
derivatives.
•Lack of scale separation between building
scale and scales on which aggregated
parameters vary.
© Crown copyright Met OfficeChallenges for City Scale Models:
•Tall buildings (distributed canopy scheme)
•Currently only interacts through bottom model level.
© Crown copyright Met OfficeSpatial-averaging (canopy) framework
• Horizontal heterogeneity at the building/street scale not resolved
• Take horizontal averages over several streets: resolve vertical structure
y
h
x
Triple decomposition of velocity
field
Spatial average of Reynolds-
averaged momentum equation
Finnigan (2000), Coceal & Belcher (2004, 2005)
Produces extra terms: drag, Reynolds and dispersive fluxes
How do we parametrize them?Spatially-averaged profiles (from DNS) Uniform array of cubical buildings (Coceal et al. 2006)
Tall-building effects (from LES)

Enhanced TKE due to tall buildings   Vertical flow and transport effects
(from Xie et al. 2008)               (from Fuka et al. 2017)

   How do we represent tall-building effects in NWP models?
Summary of problems.

       • Cityscale modelling is an important problem
       that we are committed to progressing.

       • Main issues are partially resolved turbulence
       and buildings (“grey zones”), inhomogeneity on
       all scales (lack of scale separation) and
       modelling deep urban canopies (also
       anthropogenic effects).

       • Also interactions between above (e.g.
       isolated tall buildings, generation of turbulence
       by buildings).

© Crown copyright Met Office
Ways forward/questions to think about
• Need techniques to address multiscale
aspects of problem.
• Scale aware parameterisations of sub-grid
processes informed by wind tunnel and
observational work.
• Need optimal way to parameterise effects of
canopy layer/tall buildings. Our next step is
likely to be a distributed drag scheme.
• May be useful analogies with convection
problem in current global and regional models.
© Crown copyright Met OfficeQuestions?
You can also read