NATIONAL HURRICANE CENTER ANNUAL SUMMARY
←
→
Page content transcription
If your browser does not render page correctly, please read the page content below
NATIONAL HURRICANE CENTER
                                         ANNUAL SUMMARY
                                  2013 ATLANTIC HURRICANE SEASON

                                                                                    Eric S. Blake
                                                                                    19 May 2014

                     GOES-EAST VISIBLE IMAGE OF INGRID AT 1533 UTC 14 SEPTEMBER 2013.

                                          ABSTRACT
The 2013 Atlantic hurricane season was well below average overall. While the year had a slightly above-
average number of named storms (14), only 2 of these storms became hurricanes. For the first time since
1994, no hurricane reached major hurricane strength (category 3 or higher on the Saffir-Simpson Hurricane
Wind Scale). As measured by the NOAA Accumulated Cyclone Energy (ACE) index, which considers the
strength and duration of (sub)tropical storms and hurricanes, the 2013 Atlantic season was the quietest
season since 1994, with an ACE value of only 39% of the long-term median. No hurricanes and only one
tropical storm, Andrea, made landfall in the United States, causing one fatality. While most of the basin
experienced below-average activity, Mexico was hit hard by Tropical Storms Barry, Fernand and Ingrid.
These storms caused devastating flooding and over 50 deaths in that country.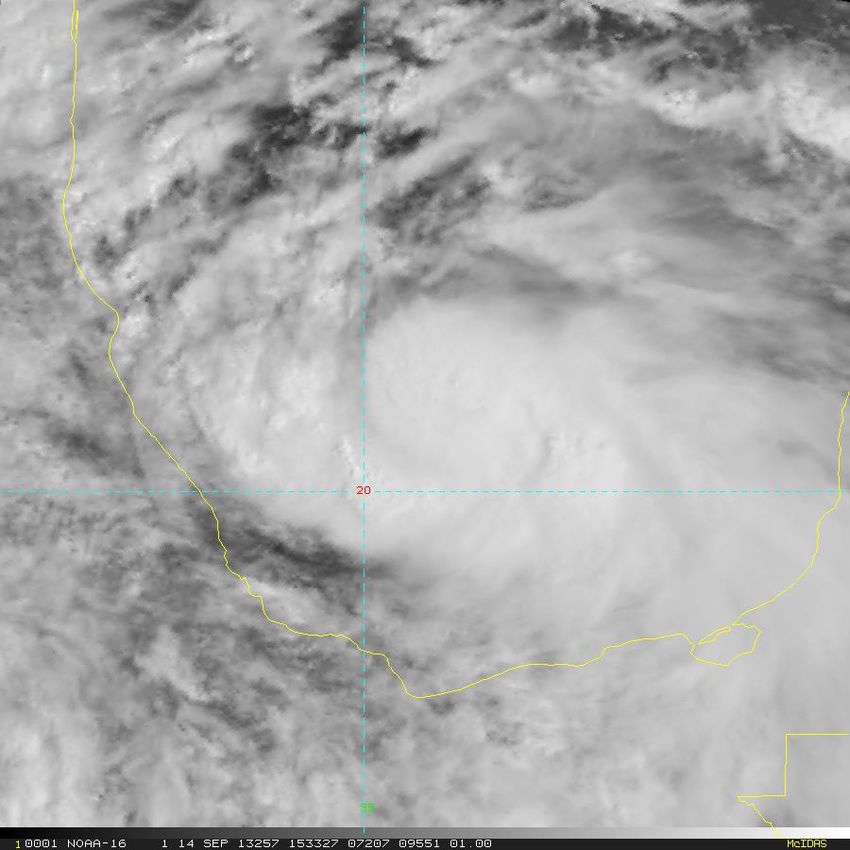
2013 Atlantic Hurricane Season 2
OVERVIEW
The 2013 Atlantic hurricane season was the quietest season in the past two decades.
While there were many cyclones, they were short-lived and struggled to intensify. A total of 14
(sub)tropical storms formed, of which only 2 became hurricanes, as compared to the long-term
(1981-2010) averages of 12 named storms and 6 hurricanes. It is notable that none of the
hurricanes reached major hurricane status (category 3 or higher on the Saffir-Simpson
Hurricane Wind Scale), far below the long-term average of about 3. The NOAA Accumulated
Cyclone Energy (ACE) index was only 39% of the long-term median and was the lowest
observed since the 1994 season.
While most of the Atlantic basin was spared from cyclone activity in 2014, Mexico was
less fortunate. Tropical Storms Barry, Fernand and Ingrid made landfall in Mexico with extreme
flooding and over 50 deaths recorded. Elsewhere, Tropical Storm Andrea made landfall in the
Big Bend region of Florida, causing one fatality and minor damage. Tropical Storm Chantal
moved rapidly across the Caribbean, with one death noted from flooding in the Dominican
Republic. The season’s strongest hurricane, Humberto, reached an intensity of only 80 kt—this
is the first time since 1968 that no hurricanes reached category 2 strength. One unnamed
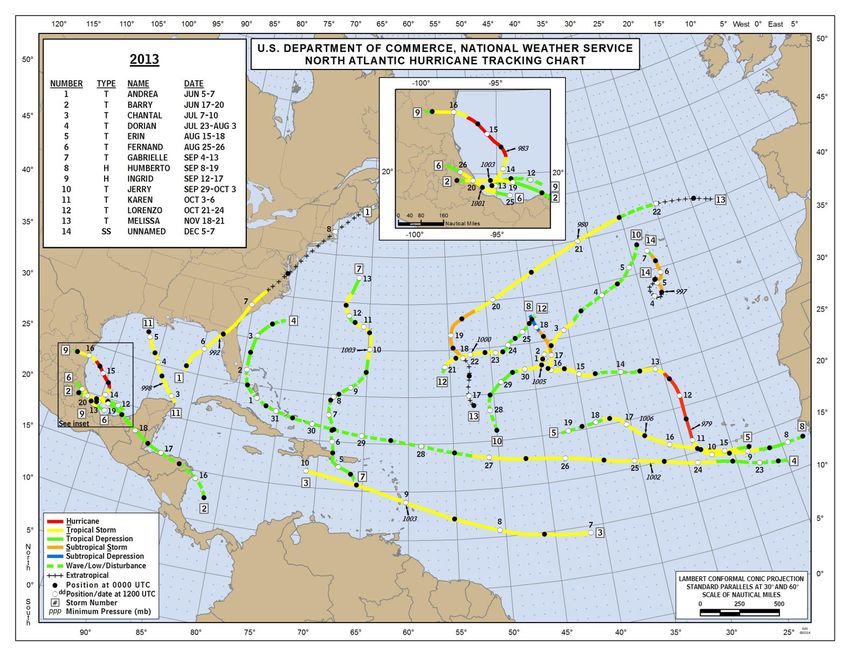
subtropical storm was added in post-analysis. The season’s cyclones are listed in Table 1, with
the tracks shown in Figure 1.
The lack of activity in 2013 is particularly notable because almost all prediction groups
anticipated an active season. An examination of the climate conditions over the Atlantic basin
during 2013 reveals some striking features. For instance, a cross-section of the tropical Atlantic
(Fig. 2) shows tremendous upper-level convergence over the area, leading to large-scale
descent and a drier-than-normal atmosphere. It is rare to see such an unfavorable environment
in a season without an El Niño and with warm tropical Atlantic waters (Fig. 3). An enhanced
Tropical Upper-Tropospheric Trough (TUTT) was also in place during much of the season (Fig.
4) over the western part of the basin, contributing to above-average shear in that area and likely
to the larger-scale sinking. However, these conditions do not fully explain why the season was
so quiet, and more research is required to understand the year’s dearth of activity.
The following section highlights the most significant cyclone of the season, Hurricane
Ingrid. More detailed information on Ingrid, as well as information on the other tropical cyclones
that formed in 2013, can be found at http://www.nhc.noaa.gov/2013atlan.shtml .
SELECTED STORM SUMMARIES
Hurricane Ingrid
Ingrid formed from a combination of a tropical wave and a large trough of low pressure
that extended from across Central America into the eastern Pacific. The wave left the coast of
2013 Atlantic Hurricane Season     3

Africa on 28 August, passing south of Tropical Storm Gabrielle about a week later. As the wave
continued to move westward, it encountered a large area of low-level cyclonic flow extending
from the western Caribbean Sea into the eastern Pacific. The combination of these systems led
to formation of a low pressure area on 11 September, just before the low moved over the
Yucatan Peninsula. After the system reformed over the Bay of Campeche on 12 September, an
increase in convection led to the formation of a tropical depression 150 n mi east-northeast of
Veracruz, Mexico.

        Ingrid made a small cyclonic loop less than 100 miles east of Veracruz on September 13
before turning generally northward in response to a mid/upper-level trough over northeastern
Mexico and ridging over the southeastern United States. Despite moderate westerly vertical
shear partially related to eastern Pacific Hurricane Manuel, the cyclone steadily intensified and
reached a peak intensity of 75 kt early on 15 September. The hurricane then turned
northwestward and west-northwestward over the next 24 hours in response to a mid-level ridge
over Texas. Increasing shear caused the cyclone to weaken below hurricane strength, and it is
estimated that the maximum sustained winds had decreased to 55 kt when the center made
landfall just south of La Pesca, Mexico around 1115 UTC 16 September. After landfall, Ingrid
moved slowly westward and dissipated over northeastern Mexico on 17 September.

       A combination of Ingrid, Manuel, and large-scale low-level southwesterly flow caused
widespread heavy rains and mudslides over large portions of Mexico, with the heaviest rains
associated with Ingrid occurring over the states of Tabasco, Veracruz, and Tamaulipas. Tuxpan
reported a rainfall total of 20.11 inches during the period September 11-20 and Presa Vicente
Guerrero reported a total of 19.77 inches. Thirty-two deaths are attributed to Ingrid, but some of
these deaths may not have been directly related to the tropical cyclone. Most of the fatalities
were due to heavy rains and mudslides. AON Benfield suggests that damage to insured
property in Mexico from Ingrid was $230 million (US).

FORECAST VERIFICATION

        The 2013 Atlantic hurricane season had only 196 official forecasts issued. The mean
NHC official track forecast errors in the Atlantic basin were similar to or slightly larger than the
previous 5-yr means from 12 to 96 h, but lower than the 5-yr mean at 120 h. A record for
accuracy was set at 120 h. The official track forecasts were highly skillful and performed close
to the best-performing models. The TVCA had the highest skill and beat the official forecast at
several time periods. FSSE, AEMI, GFSI, and EMXI were also strong performers, and HWFI
was the best model at the longer range. GHMI was in the second tier of models, while CMCI
performed less well. The Government Performance and Results Act of 1993 (GPRA) track goal
was not met.

        Mean official intensity errors for the Atlantic basin in 2013 were below the 5-yr means at
all lead times. Decay-SHIFOR errors in 2013 were also lower than their 5-yr means from 12 to
36 h, but larger than average after 36 h. The consensus models IVCN and FSSE were the best
performers, and beat the official forecast at several time periods. HWFI was a good performer
early, but its skill leveled off after 48 h. Conversely, DSHP and LGEM were the least skillful of
2013 Atlantic Hurricane Season 4 the models early but the skill of those models increased at the longer forecast times. All of the guidance and the official forecast had a high bias this season. The GPRA intensity goal was met.
2013 Atlantic Hurricane Season        5

Table 1.        2013 Atlantic hurricane season statistics.

                                                        Max.         Min.                      U.S.
    Storm
              Classa              Datesb                Winds      Pressure       Deaths      Damage
    Name
                                                         (kt)        (mb)                    ($million)

    Andrea     TS               June 5 – 7                 55          992           1          minor
     Barry     TS              June 17 – 20                40         1003           5
    Chantal    TS               July 7 – 10                55         1003           1
    Dorian     TS           July 23 – August 3             50         1002
     Erin      TS             August 15 – 18               40         1006
    Fernand    TS             August 25 – 26               50         1001          14
Gabrielle      TS           September 4 – 13               55         1003
     Eight     TD            September 6 – 7               30         1008
Humberto        H           September 8 – 19               80          979
    Ingrid      H           September 12 – 17              75          983          32
     Jerry     TS       September 29 – October 3           45         1005
    Karen      TS              October 3 – 6               55          998
    Lorenzo    TS            October 21 – 24               45         1000
    Melissa    TS           November 18 – 21               55          980
Unnamed        SS            December 5 – 7                45          997

a
 Tropical depression (TD), maximum sustained winds 33 kt or less; tropical storm (TS), winds 34-63 kt;
hurricane (H), winds 64-95 kt; major hurricane (MH), winds 96 kt or higher.
b
 Dates begin at 0000 UTC and include all tropical and subtropical cyclone stages; non-tropical stages are
excluded.
2013 Atlantic Hurricane Season 6 Figure 1: Tracks of (sub)tropical storms and hurricanes during the 2013 Atlantic Hurricane Season.
2013 Atlantic Hurricane Season   7

                                                                   .

Figure 2:   August-October 2013 height-latitude sections from the NCEP Climate Forecast System Renalysis (CFSR) dataset averaged
            between 40oW-60oW of (a) anomalous divergence (x 106 s-1), (b) anomalous vertical velocity (x 10-2 Pa s-1), and (c) percent of
            normal specific humidity. Green shading indicates anomalous divergence, anomalous rising motion, and increased moisture,
            respectively. Brown shading indicates anomalous convergence, anomalous sinking motion, and decreased moisture.
            Climatology and anomalies are with respect to the 1981-2010 period monthly means. Figure courtesy Gerry Bell (CPC).
2013 Atlantic Hurricane Season 8
Figure 3: August-October 2013 sea surface temperature (SST) anomalies (°C). Anomalies are departures from the Extended
Reconstructed Sea Surface Temperature (ERSST) dataset v3b (Smith et al. 2008), with respect to the 1981-2010 period
monthly means. The green box indicates the Main Development Region. Figure courtesy Gerry Bell (CPC).2013 Atlantic Hurricane Season 9
Figure 4: 200-850 hPa anomalous magnitude of vertical wind shear and anomalous shear vector (m s-1). The green box indicates the
Main Development Region. Anomalies are based on the 1981-2010 climatology. Figure courtesy Gerry Bell (CPC)You can also read