The Australian region space weather network
←
→
Page content transcription
If your browser does not render page correctly, please read the page content below
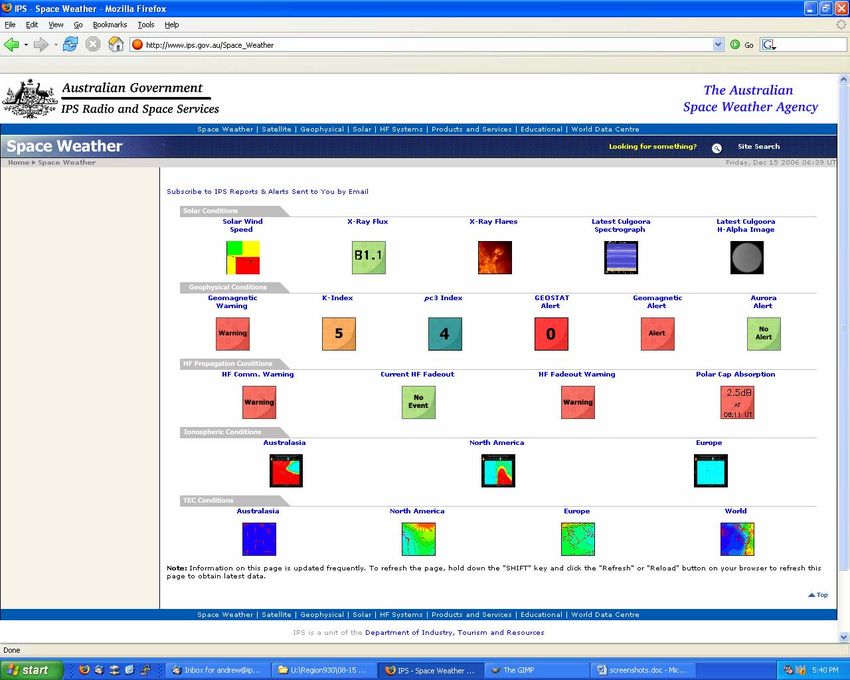
The Australian region space
           weather network

 Marshall R, D. Neudegg, P. Wilkinson, J. Kennewell1, G. Patterson,
M. Terkildsen, G. Steward, M. Hyde, E. Smith, Z. Bouya, M. Francis, J.
    Caruana, B. Paterson, N. Prestage, M. Layoun, N. Bukilic, R.
            Jenssen, M. Parkinson, C. Thomson, C. Yuile

                IPS Radio and Space Services
                   Bureau of Meteorology
                 1 Australian   Space Academy
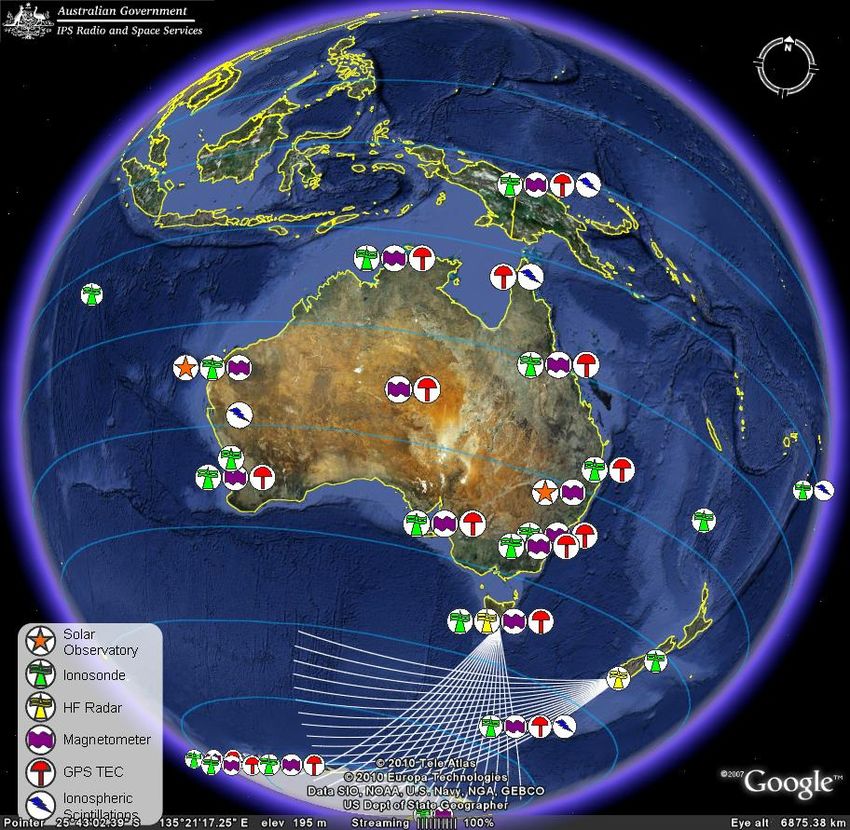
IPSNET - space weather sensor network
IPSNET covers 1/8th (12%) of Earths surface

Diagram by Dr Mike Terkildsen
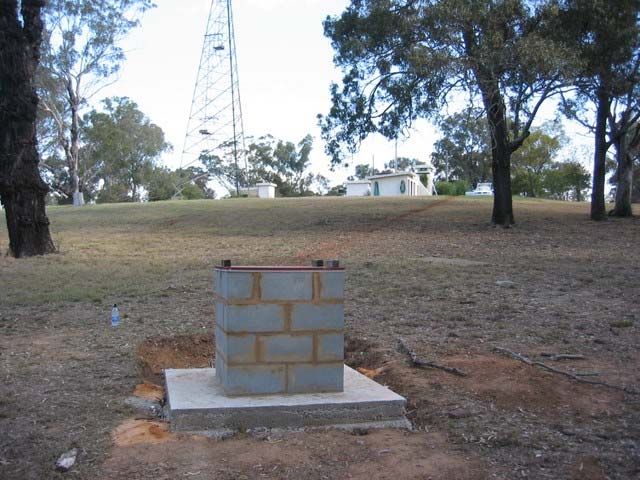
Culgoora Solar Observatory

Culgoora
Radio quiet zone Next to Australia Telescope National Facility.
No transmissions allowed. Excellent radio reception site.

Solar radio and optical
Magnetometers (IPS & MAGDAS)
Oblique HF radio Rx from NZ and TVL

Spectrograph 18-1800MHz (A to D band)
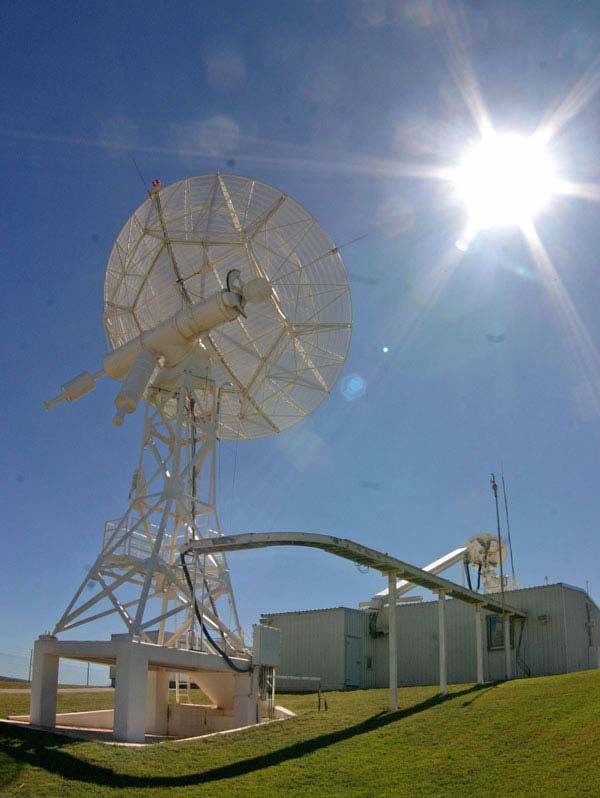
Learmonth Solar Observatory
                                      Learmonth (IPS-USAF facility)

                                      RSTN – Radio Solar Telescope Network

                 8m antenna

25 MHz to 15.4 GHz
3 parabolic antennae                                                  GONG magnetic
8 fixed frequencies (245, 410, 610,                                   Analysis of sunspots
    1415, 2695, 4995, 8800, 15400 MHz)                                -> flare probability
Solar Radio Spectrograph (designed
by IPS) sweeps from 25 to 180 MHz –
fed by semi-bicone (low band) and
tracking log periodic (high band)
antennae.

Operation from sunrise to sunset
                                         GONG heliomagnetic observations
IPSNET Observatories
IPSNET sends data to the
Regional Warning Centre (RWC)
Australian Space Forecast Centre
(ASFC)

Vanimo 5D ionosonde
Papua New Guinea
                                   Hobart 5D ionosonde

                                                                  Canberra 5D ionosonde

                                                                    Vanimo scintillation monitor
                                                                    Papua New Guinea
   Camden IPS magnetometer           Antarctic riometer for PCA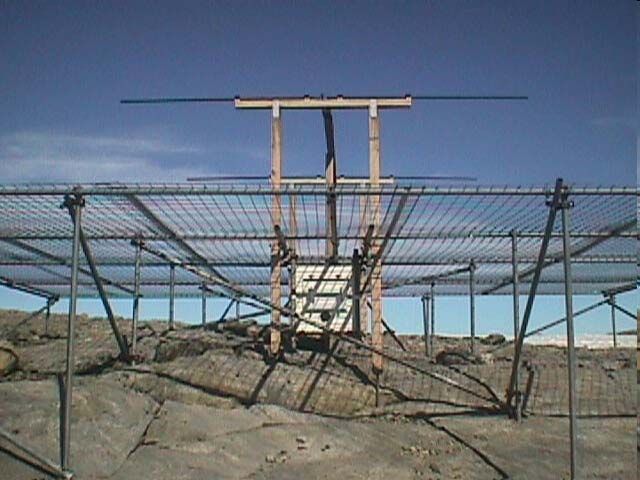
Flare Forecast
                 Theophrastus. Data and Forecast for 2230Z 4/ 8/2011.
                           Region Data                            Forecast   http://www.ips.gov.au/Solar/2/5
                            -----------                   -------------
                 Region    McIntosh Region          Delta         Largest  Probabilities        URSI
                 Number    Class        Evolution Config.         Flare    C       M     X      Keyword
                 =================================================================
                 1260      Hsx          stable                             20 0          0      QUIET
Flare Forecast   1261      Dai          decaying                  M        80 15 2              ERUPTIVE
                 1263      Eki          stable                             90 7          0      ERUPTIVE
                 1266      Bxo          stable                             2       0     0      QUIET
                 C408      Axx          stable                             2       0     0      QUIET
                                              Full Disk Prediction is      98 21 2
                 (McIntosh, P.S. 1990, Sol Phys., 125,251)

                 Magnetic gradient by Graham Steward
                 ASFC manager
                 Max Gradient
                 • 0.025 - 0.09 – possible C-flares
                 • 0.09 - 0.25 – possible C and M-flares
                 • > 0.25 – possible C, M, and X-flares

                                                             Steward et al. doi:10.1029/2011SW000703, in
                                                             press.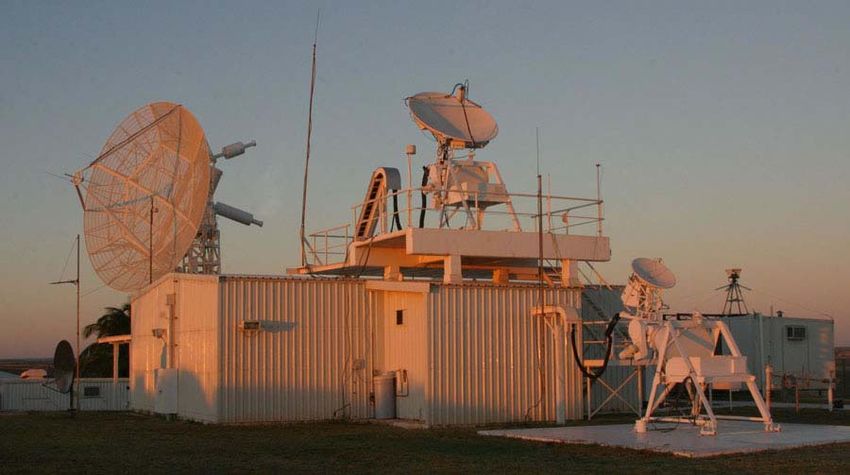
Flare Alert

Flare Alert

                                                   (G.Patterson)

              IPS XRAY AND OPTICAL FLARE CORRELATION –PART D ISSUED AT 0245 UT
              on 26 Feb 2004 BY IPS RADIO AND SPACE SERVICES FROM THE AUSTRALIAN
              SPACE FORECAST CENTRE
              Optical flares with maximum within 10 minutes of X-ray maximum are correlated.
              Approximate xray flare maximum 26 2 2004 0204 UT at Flux X1.1
              Xray flare possibly optically correlated with the following H-alpha flare auto-
              detected at IPS Culgoora Solar Observatory:

              Start date/time       Max date/time         End date/time
              26 02 2004 01:55UT    26 02 2004 01:59UT    26 02 2004 02:41UT

              Lat Long Imp. Bright.       Area SEC Region Num
              014 014 2     Bright        00485    564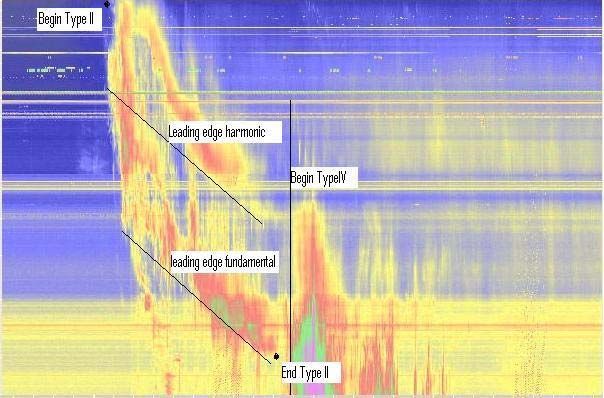
HF radio ‘Short Wave Fadeout’ (SWF) Alert

SWF Nowcast

               IPS FADEOUT ALERT - PART A FOR HF FADEOUTS AFFECTING THE
               AUSTRALIAN REGION ISSUE TIME: Thu Feb 26 13:00:24 EST 2004
               +++++++++++++++++++++++++++++++++++++++++++++++++++++++++
               A HF FADEOUT IS NOW UNDERWAY IN PART OF THE AUSTRALIAN
               REGION. MORE DETAILS OF THE TIMING AND EXTENT OF THIS
               EVENT WILL BE ISSUED JUST AFTER IT ENDS.
               ++++++++++++++++++++++++++++++++++++++++++++++++++++++++

               Follow the progress of this event on the IPS Web site
               http://www.ips.gov.au Click "Space Weather" Click "X-Ray Flux"
               ++++++++++++++++++++++++++++++++++++++++++++++++++++++++

               Australian Space Forecast Centre IPS Radio and Space Services
               (61)(2)9213 8010 (phone) (61)(2)9213 8061 (fax) asfc@ips.gov.au
               +++++++++++++++++++++++++++++++++++++++++++++++++++++++++
Coronal Mass Ejection (CME) Warning

ARBIS – Automated Type II, III
detection
(Lobzin et al., 2009, 2010)
      CME Nowcast

                                 PLAIN PRESTO CULGOORA 03/0131UT NOV 2003

                                 SOLAR RADIO EVENT 1: DRIFTING: 200 - 30 MHZ
                                 START TIME: 0124 UT
                                 END TIME: 0129 UT
                                 SPECTRAL TYPE: TYPE II BURST
                                 IMPORTANCE: STRONG

                                 FUNDAMENTAL AND HARMONIC VISIBLE
                                 ESTIMATED SHOCK SPEED 699 KM/S
                                 FLARE OBSERVED IN REGION 10488 SHORTWAVE
                                 FADEOUT OBSERVED
Geomagnetic Storm Warning
Geomagnetic
Storm Forecast
SUBJ: IPS GEOMAGNETIC DISTURBANCE WARNING 02/46
ISSUED AT 23/0107Z DECEMBER 2002 BY THE AUSTRALIAN
SPACE FORECAST CENTRE.
INCREASED GEOMAGNETIC ACTIVITY EXPECTED DUE TO
CORONAL MASS EJECTION FROM 23-24 DECEMBER 2002
_______________________________________________
GEOMAGNETIC ACTIVITY FORECAST
23 Dec: Active to minor storm periods.
24 Dec: ActiveCME Alert
CME between Sun and Earth decreases cosmic ray flux
Last updated 01 Nov 2010 07:30 UT
Forbush Decrease Observed ( 3%) at MAW 05/04/2010 DOY: 95 Hour: 17UT
Forbush Decrease Observed ( 3%) at MAW 04/08/2010 DOY: 216 Hour: 04UTPolar Cap Absorption (PCA)
Alert for HF radio
A(dB) = 10log10(Aqdc/Aday)
“quiet day curve”
Ionospheric D-region absorption
of 30MHz background radiation
Ionograms completely absorbed
10Mev Proton/PCA Event Began 31 05 2003 0505UT and is in progress
Casey 30Mhz Riometer Data at time of Issue: Casey 1.9 dBGeomagnetic Storm Sudden commencement (SSC)
and
Sudden Impulse (SI) Alert
Simultaneous (global) response on magnetograms
MODERATE SUDDEN IMPULSE DETECTED (87nT)
IN IPS MAG DATA 04 11 03 0626UT
Mean Mag Parameters Pre/Post Impulse:
Pre Post
Stn Unit Impulse Impulse Change
hbt nT 15.0 118.9 103.9
cbr nT 29.1 131.7 102.5
tvl nT 17.0 69.6 52.6
lem nT 43.2 130.4 87.2
clg nT -34.4 54.7 89.1Geomagnetic Storm Alert
Estimated Indices 05 Jun :
Geomagnetic
Storm Alert Darwin 2222 1222
Townsville 1222 2222
Learmonth 1212 2332
Culgoora 2211 2222
Canberra -311 2223
Hobart 1211 2222
Australian Region 2212 2222
SUBJ: IPS GEOMAGNETIC DISTURBANCE ALERT
ISSUED AT 1716 UT ON 11 APR 2001 BY IPS RADIO AND SPACE SERVICES
FROM THE AUSTRALIAN SPACE FORECAST CENTRE
SEVERE GEOMAGNETIC DISTURBANCE IN PROGRESS (K OF 7 REACHED)
PRELIMINARY AUSTRALIAN REGION K INDICES FOR 11 04 01: 2122 47--Aurora Alert
Aurora Alert
Photo courtesy of Dallas & Beth Stott, Blackmans Bay Tasmania
SUBJ: IPS AURORA ALERT ISSUED AT 1818 UT on 31 Mar 2001
BY IPS RADIO AND SPACE SERVICES FROM THE AUSTRALIAN
SPACE FORECAST CENTRE
SEVERE GEOMAGNETIC STORM IN PROGRESS.
AURORA MAY BE OBSERVED DURING LOCAL NIGHT TIME
HOURS IN GOOD OBSERVING CONDITIONS AT REGIONS AS
FAR EQUATORWARD AS MIDDLE LATITUDES.HF COMMS Warning
foF2 normal
Hourly area prediction of max usable depressed
Frequencies (MUF) HF frequencies
from a Tx site to broadcast area.
SUBJ: IPS HF RADIO COMMUNICATIONS WARNING 10/21 ISSUED AT 23/2354Z OCTOBER
2010 BY THE AUSTRALIAN SPACE FORECAST CENTRE. DEGRADED HF PROPAGATION
CONDITIONS EXPECTED FOR 24 OCTOBER 2010
IF COMMS DIFFICULTIES EXPERIENCED TRY A LOWER FREQUENCY BAND
_____________________________________________________________
HF COMMUNICATIONS FORECAST (AUSTRALIAN/NEW ZEALAND REGION) FREQUENCY
BANDS
T-index MUFs 2 4 6 8 12 16 22 26
_____________________________________________________________
-10 -22% 2 4 6 8 8 12 16 16Total electron content (TEC) Ionospheric Model
http://www.ips.gov.au/Satellite
Input data QC
Kalman filtering
IPP – ionospheric pierce points of GPS signals
(M.Terkildsen, Z.Bouya and M.Francis) SCHA – spherical cap harmonic analysis of TEC
Legendre polynomial basis functions
K max k
TEC (ϑ , ϕ ) = ∑ ∑P
k =0 m =0
m
nk ( m ) ( (cos(ϑ )[ g km cos(mϕ ) + hkm sin( mϕ )
Ionospheric scintillation
affects SATCOM and GPS
Plasmasphere model
Klobuchar modelGeomagnetically Induced Currents (GICs) in Pipelines
Enhanced corrosion
from GICs flowing in
pipelines.
Can help to plan where
to place current
reversal devices
Map compiled and published by Great Southern Press. All copyright remains with Great Southern Press
(www.pipeliner.com.au).GICs in Pipelines Geomagnetic Quiet Day Geomagnetic Storm
GICs in Pipelines
             Spectral Analysis: B vs PSP

                                        π
                                    f   i
          GIC- Index:     Z( f )=      e4
                                    fN
[Marshall et al., 2010]
GICs in Pipelines
GIC Index: 7th November 2004
Red – H north-south component Green – dB/dt
Yellow – D east-west component Blue – GIC-index
Orange – PSP
= pipe to soil potentialGeomagnetically Induced Currents (GICs) in Power Networks
Increased Connectivity eg.,
high voltage DC link to
Tasmania driven by
• Market Competition
• Robustness to demand
BUT longer power lines
means increased
susceptibility to Space
weather
AEMO
Australian Energy
Market OperatorGICs in Power Networks
GICy-index Occurrences > 50
300 200
Cycle 22 Cycle 23 180
250 160
Peak of geomagnetic activity
on downslope of cycle 140
Sunspot Number
GIC y Index
200 120
100
150 80
60
100 40
20
50 0
1985 1990 1995 2000 2005 2010
Time
HBT CNB GNA ASP LRM CTA KDU Sunspot
Marshall et al., doi:10.1029/2011SW000685, in pressGICs in Power Networks
• New Zealand Previously
considered safe due to mid-
latitude location
• Prior to 2001 no GIC related
faults recorded
• Fault attributed to premature
ageing
• Analogous situation between NZ
south Island and Tasmania
Marshall et al., doi:10.1029/2011SW000685, in presswww.ips.gov.au/Space_Weather
You can also read