NATIONAL FAMILY PLANNING COSTED IMPLEMENTATION PLAN 2015-2021 - RELIEFWEB
←
→
Page content transcription
If your browser does not render page correctly, please read the page content below
National Family Planning Costed
Implementation Plan 2015-2021
Introduction Goal
Women and girls - in particular those that are poor,
Nepal is aspiring to graduate from a ‘Least vulnerable and marginalized – exercise informed
Developed Country’ to a ‘Developing Country’ by choice to access and use voluntary FP (through
2022 and is committed to improving the health status increased and equitable access to quality FP
of its people through reduction in maternal, neonatal, information and services).
infant and under-five mortality. In the area of Family
Planning (FP), the Government of Nepal aims to Strategic Directions
enable women and couples to attain the desired To address the existing challenges and opportunities
family size and have healthy spacing of childbirths for scaling up rights-based FP in the country, the
by improving access to rights-based FP services and CIP focuses on the following five strategic areas.
reducing unmet need for contraceptives.
The Family Health Division (FHD)/Ministry of Enabling Environment: Strengthen enabling
Health and Population (MoHP) revised the national environment for family planning
FP program to devise strategies and interventions that Demand Generation: Increase health care
will enable the country to increase access to and use seeking behavior among population with high
of quality FP services by all—and in particular by unmet need for modern contraception.
poor, vulnerable and marginalized populations. Service Delivery: Enhance FP service delivery
including commodities to respond to the needs of
marginalized, rural residents, migrants,
Purpose adolescents and other special groups.
Under the leadership of the MoHP a national Costed Capacity Building: Strengthen capacity of service
Implementation Plan (CIP) on family planning was providers to expand FP service delivery
developed in close consultation with all stakeholders. network.
The purpose of the CIP is to articulate national Research and Innovation: Strengthen evidence
priorities for family planning and to provide guidance base for effective programme implementation
at national and district levels on evidence-based through research and innovations.
programming for family planning so as to achieve the
expected results, as well as to identify the resources Through investment in these areas the country aims
to increase demand satisfied for modern
needed for CIP implementation. In addition, the CIP
contraceptives from 56% (NDHS, 2011) to 62.9%
is intended to serve as a reference document for and Contraceptive Prevalence Rate (CPR) for
external development partners including donors and modern methods from 47% in 2014 (MICS) to 50%
implementing agencies to understand and contribute by 2020. Likewise it aims to reduce unmet need for
to the national priorities on family planning outlined FP from 25.2% in 2014 (MICS) to 22% which
in the Plan to ensure coherence and harmonization of would allow the country to achieve a replacement
efforts in advancing family planning in Nepal. level fertility of 2.1 births per women by 2021.
These targets may appear relatively modest but
were chosen to reflect the context of a country that
Vision
has witnessed impressive gains in FP but has CPR
Healthy, happy and prosperous individuals and
that has been stagnant for some time in recent years.
families through fulfillment of their reproductive and
There are also significant variations in FP service
sexual rights and needs.
use by age, geographic region, wealth quintile and                   Costs and Benefits of Scaling up FP
spousal separation. The target therefore reflects a FP               Although the investment required are calculated for
strategy that aims to give individual and couples a                  the period of 2015-2020, in line with the National
choice of contraceptive methods with a special                       Health Sector Plan III, the impact takes a longer
emphasis on reaching the poor, vulnerable and                        time to materialize. Therefore benefits and return on
marginalized groups. The strategy also includes                      investment from FP scale up are calculated for the
changes in the method mix over time, with a balance                  period up to 2030.
between permanent, long-acting reversible methods
and short-acting methods.                                            Demographic Impact
                                                                     The projected demographic impacts of FP scale up
                                                                     include a smaller increase in total population - 32m
Investment Required                                                  by 2030 compared 33.5m under the counterfactual
The total resources required for scaling up FP in                    scenario (Figure 1) and a lower (total) dependency
Nepal for the period 2015-2020 is NPR 13,673.6                       ratio that lead to achievement of 4.6% higher
million (corresponding to approximately USD 153                      income per capita by 2030 (Figure 2) catalyzed by
million) for six years The majority (57%) of this                    the demographic dividend.
total is due to the costs that are directly incurred in
delivering FP interventions (Table 1). One third                     Figure 1: Nepal’s total population projections (2011-2030)
(35%) is due to programme costs, or expenditures on
activities at the wider population level that are                                   2011              2016                 2021             2026
required for FP interventions to be effectively                           35,000,000
implemented. The remainder (8%) is indirect costs,                        33,000,000
which predominately relate to health facility                             31,000,000
overhead costs such as administrative staff and utility                   29,000,000
bills.                                                                    27,000,000
                                                                          25,000,000

                                                                                                                    2019
                                                                                        2011
                                                                                               2013
                                                                                                      2015
                                                                                                             2017

                                                                                                                            2021
                                                                                                                                   2023
                                                                                                                                           2025
                                                                                                                                                  2027
                                                                                                                                                         2029
Among the programme costs the largest planned
expenditure category over the period is Enhancing
Service Delivery (1,836.9 million NPR), followed by                              Counterfactual                     FP scale-up                    UN WPP
Demand Generation (738.4 million NPR), Capacity
Building (793.8 million NPR) and Enabling                            Couple Years of Protection
Environment (679.2 million NPR). General                             The number of couple years of protection (CYPs),
Programme Management (303.1 million) and                             which is a function of both population growth and
Research & Innovation (446.3 million NPR)                            increased contraceptive use, is estimated at 2.9
constitute the remainder of the total projected                      million by 2030 under the FP scale-up scenario,
expenditure of 4,797.7 million NPR (Table 2).                        which is 0.24 million more than under the
                                                                     counterfactual scenario.

Table 1: Estimate of total resource requirements (in million)
                                                                                                                                           Total                Total
                                    2015           2016         2017          2018             2019                  2020                  NPR                  USD
                                    1,229.6        1,258.9      1,289.3       1,336.1          1,365.8              1,363.6                7,843.3               87.9
Direct intervention costs                                                                                                                     57%
                                     1,099.3       1,094.5       860.6         780.4              456.2               506.8                4,797.7               53.8
Programme costs                                                                                                                               35%
                                       158.5         164.0       169.3         174.8              180.4               185.5                1,032.5               11.6
Indirect costs                                                                                                                                 8%
Total                                2,487.4       2,517.4      2,319.2       2,291.3          2,002.4              2,055.8               13,673.6              153.2
Year as % of total cost                 18%           18%          17%           17%              15%                  15%                   100%
Source: Multi-Year Costed Implementation Plan, OneHealth modeling and OPM calculations
Health Benefits Figure 3: Cumulative cost savings
The scale up of FP in Nepal will contribute to further
reduction in maternal mortality as well as reduction 25,000,000,000
in infant and child mortality rates. It is estimated that 20,000,000,000
there will be 230 fewer maternal deaths a year and 15,000,000,000
approximately 3,000 fewer infant deaths each year by 10,000,000,000
2030 in the FP scale-up scenario compared to the 5,000,000,000
counterfactual scenario. 0
Social and Economic Benefits
Slower rates of population growth translate into cost Primary education Child immunization
savings to the government as there are fewer people
Child pneumonia Maternal health
who need social services. A cumulative cost savings
of 46,569.9 million NPR is estimated to be achieved WASH
Table 2: Estimated costs for strategic areas and programme management (in million)
PROGRAMME COSTS 2015 2016 2017 2018 2019 2020 Total NPR Total USD
1. Demand Generation 258.4 90.6 108.1 196.8 56.9 27.7 738.4 8.27
2. Enhancing Service Delivery 303.1 424.7 292.9 272.1 272.1 272.1 1,836.9 20.59
3. Capacity Building 188.6 207.8 183.6 71.8 71.3 70.8 793.8 8.89
4. Research & Innovation 150.8 103.5 91.5 98.5 2.0 0.0 446.3 5.00
5. Enabling Environment 147.9 217.4 134.0 90.7 3.4 85.8 679.2 7.61
6. General Programme Management 50.5 50.5 50.5 50.5 50.5 50.5 303.1 3.40
Total 1,099.3 1,094.5 860.6 780.4 456.2 506.8 4,797.7 53.76
Source: TWG estimates and OPM calculations
Figure 2: Increase in income per capita
Return on Investment
1.1000
Using the most commonly reported summary metric of
1.0500
a cost-benefit analysis, the Benefit-Cost Ratio (BCR),
it is projected that over the time period 2015-2030, for
1.0000 every rupee spent on FP, Nepal will save 3.1 rupees in
the five sectors mentioned above if the FP scale-up
scenario is achieved.
FP Scale-up compared to Counterfactual
Scenario There are likely to be cost savings to other sectors
not included here – those related to health sector (like
improved pregnancy outcomes, reduced unsafe abortion
over the time period (2015-2030) under the FP scale- from unwanted pregnancies and improved protection
up scenario compared to the counterfactual scenario from HIV and other STIs) and those outside the health
in primary education, child immunization, treatment sector (like cost saving in providing social services,
of child pneumonia, maternal health services and climate change benefits and improvements in women’s
improved water sources (Figure 3). The magnitude right, empowerment and gender equality).
and timing of the cost savings in the different sectors
varies. However, by 2030, cumulative cost savings
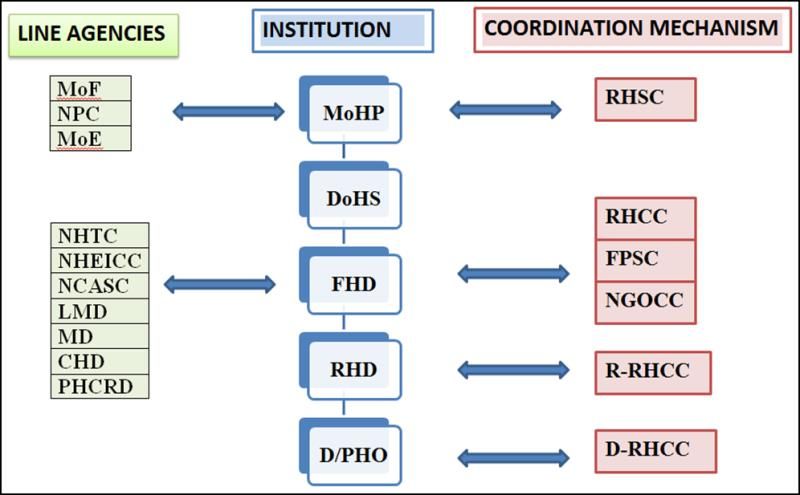
are the largest for primary education.Institutional Arrangements for Implementation Figure 4: CIP Coordination and Management Structure Based on stakeholders’ consultation, a streamlined coordination and management structure is proposed for CIP implementation (Figure 4). The purpose of the coordination mechanism is to ensure multi- sectoral approach; optimize financial and technical support to FP provided by donors/INGOs; ensure strong linkages and coordination with NHSP III; support effective implementation of the CIP and strengthen engagement of NGOs and other stakeholders, as well as to improve tracking/dissemination of results and lessons learned. The coordination and management mechanism is built on the existing coordination structure. Implementation of the CIP will be steered by MoHP (policy level) and coordinated by DoHS, while the execution of CIP will be overseen and managed under the leadership of FHD. This CIP was developed under the leadership of FHD through an extensive consultation and participatory process involving multiple stakeholders. The financial and technical support was provided by UNFPA, the United Nations Population Fund in 2014-2015. Oxford Policy Management (OPM), UK, though financial support from UNFPA, supported the development of this CIP by performing the costing exercise and assessing the impacts of scaling up FP services. USAID through H4L provided support on developing the key interventions and estimated budgets for capacity building section of the CIP. A copy of the full report will soon be available upon request by writing to UNFPA Registry Nepal (registry-np@unfpa.org).
You can also read