Global: Mirror, mirror on the wall, who has got the biggest printer of them all?
←
→
Page content transcription
If your browser does not render page correctly, please read the page content below
14 January 2021

   Global: Mirror, mirror on
   the wall, who has got the
  biggest printer of them all?
Philip Maldia Madsen | Andreas Steno Larsen

Almost every single major central bank has gone QE-nanas during 2020 and
are expected to continue through 2021. But which central bank has distorted
the market the most and which bond markets are yet to be fully manipulated?
Find the answers here.
Every major central bank (in G10 space) has gone QE-nanas in 2020 except for Norway and Switzerland.
Central Banks across the G10 have so far (December-2020 figures) “manipulated” the government bond
market – in 2020 alone – with north of USD 3.5 trillion. Most central banks are expected to keep purchases
running throughout 2021, but it may be worthwhile assessing which central banks that have distorted
the Govie market the most and which central banks that are running the closest to operational thresholds.
Markets with a bigger free float may be more receptive to vaccine and growth news during the economic
rebound that most people expect in 2021.

e-markets.nordea.com/article/62833/global-mirror-mirror-on-the-wall-who-has-got-
the-biggest-printer-of-them-all
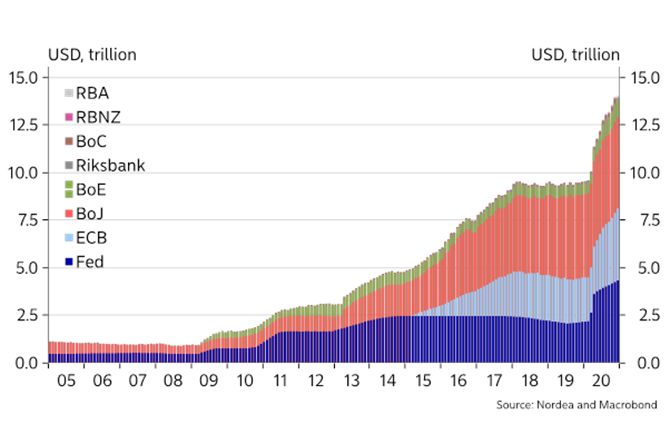
Chart 1. G10 central bank government bond holdings

Pilling up of Govie debt on central bank balance sheets may be an understatement by now. Going into 2021,
central banks have pledged to keep the taps open until financial conditions have improved enough and
economies have recovered. While an ample (global) liquidity environment will encourage/support riskier
investments – capital flows out of the US dollar and into Europe and EM assets – this article will focus on the
widespread notion, that the central bank can provide (almost) unlimited amount of QE through government
bond market. Some of the G10 central banks are already running close to self-imposed thresholds for
ownership as a % of the market size.

So, while the liquidity tanks may be indefinitely large, the government bond markets are not. A quick overview
of the ownership ratio per country shows that the substantial monetary stimulus has turned each respective
central bank into a whale from a government bond ownership perspective. The G4 central banks may be the
largest whales with respect to absolute stimulus but looking into relative holdings compared to the respective
eligible bond markets smaller central banks – who came later to the QE race – are rapidly increasing their
ownership share (eligible with respect to the banks purchasing program).

The Riksbank for example owns a large portion of the SGB market, while also Bank of England is getting
closer to the 50% threshold of eligible bonds. RBA is still only a “minor” player in the Australian government
bond market, while RBNZ and BoC are also rapidly increasing ownership portions. The Fed owns below
30% of the eligible market, which his not markedly more than back in 2013/2014 before taper tantrum and
subsequent QT operation.

Central banks running close to legal or self-imposed ownership thresholds may be tempted to move into
other asset classes to a larger extent with the Riksbank being the most recent clear example having largely
e-markets.nordea.com/article/62833/global-mirror-mirror-on-the-wall-who-has-got-the-biggest-printer-of-them-all
shifted its QE focus to covered bonds consequently. Bank of England, BoC and RBNZ could be examples of
central banks that could follow down that road due to ownership thresholds in Government bond markets.

On the other hand, AUD and USD bond markets (and swap curves) could prove to be more sensitive to
reflationary vibes in markets since the market is not as “manipulated” relatively to other bond markets and
RBA and Fed still have substantial headroom in terms of Govie QE.

Chart 2. Central bank ownership of bonds as a % of the (current) eligible bond market size

The Fed: Not limited by thresholds.

The Fed announced a “re-start” of the QE program back in March where it kicked of its program by buying
north of 1tn USD worth of bonds within the first three weeks. Since then, the Fed has moderated its pace
to USD 80bn and 40bn in US Treasuries and mortgage-backed securities, respectively. The bank itself has
pledged to continue buying at this pace until substantial further progress has been made towards their target
for maximum employment and their new average inflation target of 2% inflation. Owning merely 26% of
the outstanding bonds and notes, thus implying an outstanding free float north of USD 11tn, the Fed has
plenty of headroom and will almost surely not be limited in regards of critical ownership share levels in the
foreseeable future.

The Fed has also clearly allowed issuance to outpace purchases again in sharp contrast to Q2 last year when
the Fed purchaess outpaced issuance by miles. This is likely also a reason why the curve has steepened up in
the US, and also a reason why the curve steepening could continue through H1-2021 unless the Fed steps UP
the purchase pace again, which currently seems unlikely.

e-markets.nordea.com/article/62833/global-mirror-mirror-on-the-wall-who-has-got-the-biggest-printer-of-them-all
Chart 3. Fed purchases compared to issuance per quarter

ECB: Hawks to demand that PEPP is a “max-wallet” not a target

The ownership issue is a bit more legally blurry when it comes to the ECB since the issuer limit is set at 33%
but with the PEPP-introduction it is more debatable whether this is still the case going forward. It is certain
that the ECB is already breaching the 33% rule in some country specific cases (due to PEPP purchases), while
that is not an issue after the introduction of the PEPP, which is not limited by the 33% rule, it may still give
some tailwinds for hawks within the ECB.

The clearest repercussion is that the ECB hawks will likely keep demanding that the widened PEPP wallet
(1850 bn EUR) is only used as a back-stop and not as a target. Purchases are designed to keep financial
conditions easy and are therefore not supposed to be upped unless necessary. We rather see a slowing pace
of purchases alongside the economic recovery in 2021.

The relative losers in Euro area bonds could be bond markets with PEPP holdings with a substantially longer
WAM compared to the eligible market with Austria being a clear example, while e.g. the Irish, Belgian and
Dutch markets are “underbought” maturity wise compared to the eligible WAM, which is probably a relative
“winner-case” compared to other Euro zone markets in a slowing PEPP scenario.

e-markets.nordea.com/article/62833/global-mirror-mirror-on-the-wall-who-has-got-the-biggest-printer-of-them-all
Chart 4. WAM holdings in the PEPP compared to the WAM of the eligible bond market

Bank of England: Not too far from self-imposed limits

BoE started the year of 2020 owning 35% of the outstanding conventional gilts with maturities above 3 years
and as of week 40 its share has risen to 46% (which is the newest data available). According to our forecasts,
the ownership share of outstanding gilts are now closer to 48% by the time of writing and by end 2021 it
will be marching towards 58%. Deputy Governor Dave Ramsden has revealed that BoE has a self-imposed
limit of 70% ownership share of the free float “to avoid distorting the market”, which is likely not going to be
breached in 2021, but the headroom is relatively limited for further QE increases.

To us, the natural implication of the bloated QE program, is that it opens the door for negative rates in
2021. The bank has already flirted with the idea and reviewed the implications of sub-zero rates. The
counterargument is that it is relatively more expensive for banks to swallow a NIRP-policy in a huge QE
regime, compared to earlier in the QE-cycle. Maybe other assets could come in to play in Bank of Englands
QE program as well, with inflation-linked Gilts currently being kept out of the loop. The Fed has for example
increased it’s ownership ratio in TIPS markets markedly in 2020, despite having earlier refrained from
manipulating that exact market too much.

e-markets.nordea.com/article/62833/global-mirror-mirror-on-the-wall-who-has-got-the-biggest-printer-of-them-all
Chart 5. Bank of England ownership as % of Gilt market including forecasts Other G10 central banks: RBNZ and BoC running close to operational thresholds The recent tapering announcement from BoC during the late autumn was probably partly designed to get more bang for the buck with longer purchases as it included an operation twist, but it most certainly also reflected a growing concern of the banks rapidly increasing ownership share of the bond market. Even Ti Macklem, the Governor of the bank, acknowledged, that the ownership share is marching towards problematic levels that may start to distort market functionality (as we have seen in e.g. the Japanese government bond market). BoC is the first central bank among its G10 peers to taper explicitly and in this context the first bank to address the implicit issue of owning too much of the government bond market. The RBNZ is another central bank starring into >50% ownership of bond markets at current projections. In August 2020, New Zealand’s finance minister Grant Robertson provided an indemnity that allowed RBNZ to buy 50% of outstanding NZGBs. Unless the RBNZ is suddenly allowed to hold more than 50% of the outstanding, it could just as well also lead to a tapering process during 2021, as it will otherwise be faced with scenarios that could breach the limit during the second half of the year. The RBA initially didn’t have to buy a lot of bonds to keep the YCC-regime in place but ultimately ended up announcing a more formal QE program in November. The purchases are still small in scale compared to other G10 central banks, which could be a reason to believe that the AUD curve is one of the curves that could e-markets.nordea.com/article/62833/global-mirror-mirror-on-the-wall-who-has-got-the-biggest-printer-of-them-all
prove to be alive and kicking during a 2021 reflationary environment. Maybe AUD is a top-pick FX pick for
this simple reason, also versus other high beta peers? On the other hand, RBA still holds substantial headroom
for increasing QE as it is much further from breaching operational limits than peers.

More in depth analysis of CAD, AUD and NZD markets are available upon request.

Chart 6. Taper to 2 or 3bn a week on the cards in Canada?

e-markets.nordea.com/article/62833/global-mirror-mirror-on-the-wall-who-has-got-the-biggest-printer-of-them-all
Chart 7. QE getting too large compared to self-imposed limits in New Zealand?

e-markets.nordea.com/article/62833/global-mirror-mirror-on-the-wall-who-has-got-the-biggest-printer-of-them-all
Chart 8. Will RBA expand QE in March since it is not running close to operational
limits?

Philip Maldia Madsen               Andreas Steno Larsen
Research Analyst                   Chief Global FX/FI Strategist
Philip.Maldia.Madsen@nordea.com    andreas.steno.larsen@nordea.com
                                   +45 55 46 72 29

e-markets.nordea.com/article/62833/global-mirror-mirror-on-the-wall-who-has-got-the-biggest-printer-of-them-all
You can also read