Landmark Wealth Management - Landmark Wealth ...
←
→
Page content transcription
If your browser does not render page correctly, please read the page content below
Landmark Wealth
Management

                  1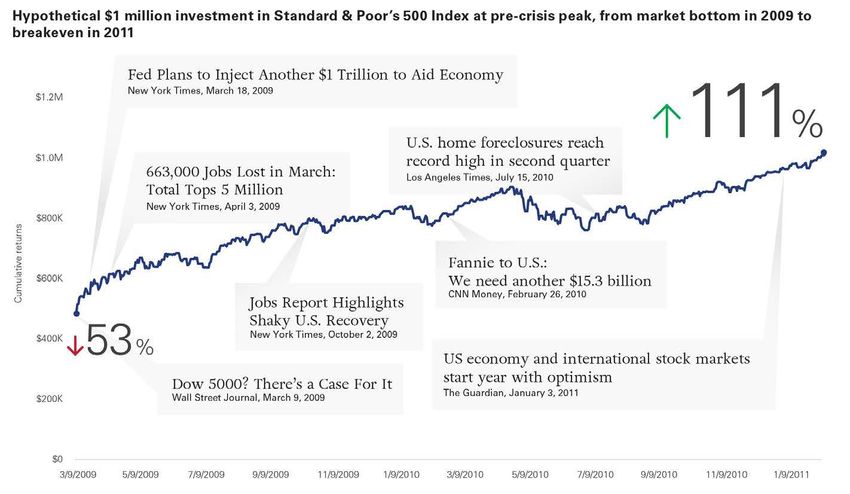
Don’t rely on headlines for an “all-clear” to invest
Hypothetical $1 million investment in Standard & Poor’s 500 index at pre-crisis peak, from market bottom in
2009 to breakeven in 2011

Sources: Vanguard. Andrews, Edmund L., 2009. Fed Plans to Inject Another $1 Trillion to Aid the Economy. The New York Times (March 18).
Accessed March 24, 2020, at https://www.nytimes.com/2009/03/19/business/economy/19fed.html. Goodman, Peter S., 2009. Jobs Report Highlights Shaky U.S. Recovery. The New York Times (October 2).
Accessed March 24, 2020, at https://www.nytimes.com/2009/10/03/business/economy/03jobs.html. Goodman, Peter S. and Jack Healy, 2009. 663,000 Jobs Lost in March; Total Tops 5 Million. The New York Times (April 3).
Accessed March 24, 2020, at https://www.nytimes.com/2009/04/04/business/economy/04jobs.html. Lazo, Alejandro, 2010. U.S. home foreclosures reach record high in second quarter. Los Angeles Times (July 15).
Accessed March 24, 2020, at https://www.latimes.com/archives/la-xpm-2010-jul-15-la-fiforeclosures- 20100715-story.html. Lobb, Annelena, 2009. Dow 5,000? There’s a Case for It. The Wall Street Journal (March 9).
Accessed March 24, 2020, at https://www.wsj.com/articles/SB123654810850564723. Luhby, Tami, 2010. Fannie to U.S.: We need another $15.3 billion. CNN Money (February 26,). Accessed March 24, 2020,
at https://money.cnn.com/2010/02/26/news/companies/Fannie_mae_results. Milmo, Dan, 2011. US economy and international stock markets start year with optimism. The Guardian (January 3).
Accessed March 24, 2020, at https://www.theguardian.com/business/2011/jan/04/us-economy-buoys-international-markets.
Past performance is not a guarantee of future returns. The performance of an index is not an exact representation of any particular investment, as you cannot directly invest in an index.
                                                                                                                                                                                                                       2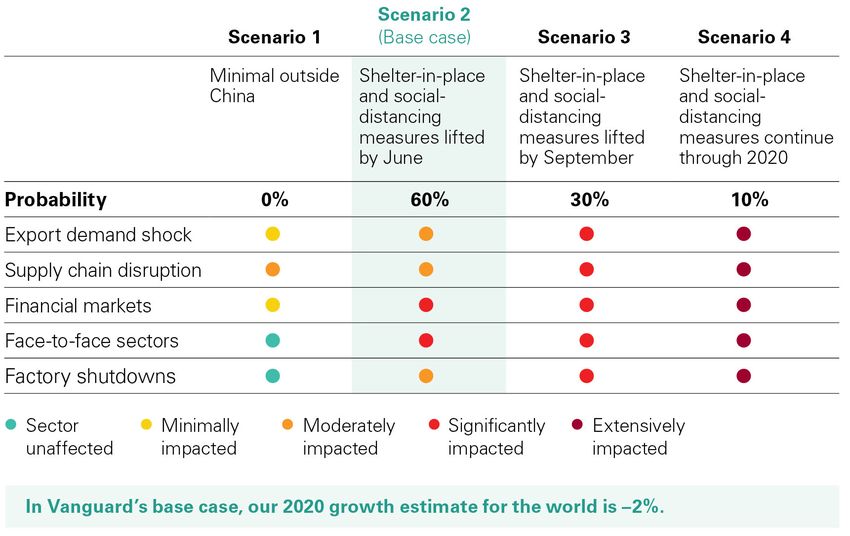
And recent history tells the same stay-the-course tale

Staying the course can pay off; abandoning course can be costly

                                                                                                                                                                        The global stock market
                                                                                                                                                                        drop in late 2018 offered a
                                                                                                                                                                        lesson in investor behavior
                                                                                                                                                                        (November 2018 through
                                                                                                                                                                        February 2019)

Sources: Vanguard calculations, based on data from FactSet, as of February 28, 2019.
Notes: U.S. stocks represented by CRSP US Total Market Index. U.S. bonds represented by Bloomberg Barclays U.S. Aggregate Float Adjusted Index. Global stocks represented by FTSE Global All Cap ex US Index. Global
bonds represented by Bloomberg Barclays Aggregate ex-USD Float Adjusted RIC Capped Index.
Past performance is not a guarantee of future returns. The performance of an index is not an exact representation of any particular investment, as you cannot directly invest in an index.

                                                                                                                                                                                                                       3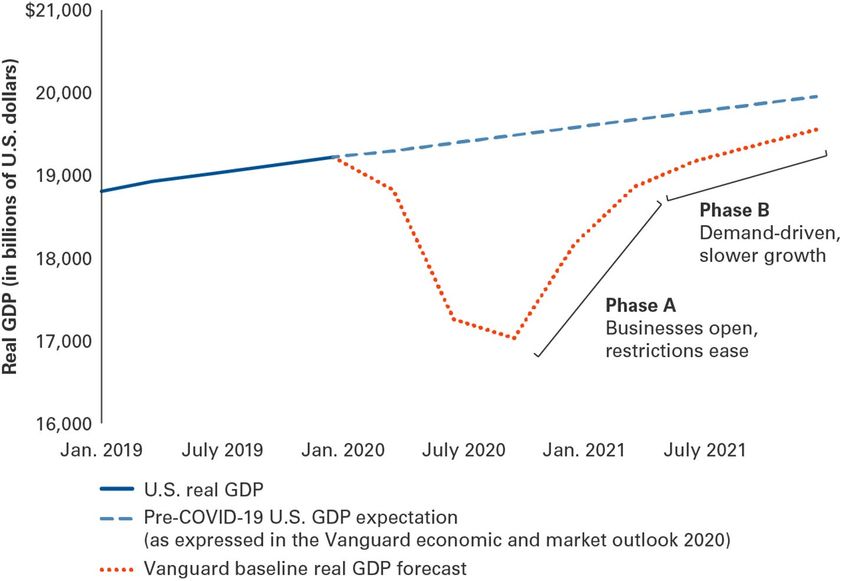
Downturns aren’t rare events: Typical investors, in all markets, will
endure many of them during their lifetime
Global stock prices

January 1, 1980, to December 31, 2019

One attention-grabbing                                                    13 corrections 8 bear markets
downturn every two years                                                  Decline of 10% or more                         Decline of 20% or more, at least two months long

Sources: Vanguard analysis based on the MSCI World Index from January 1, 1980, through December 31, 1987, and the MSCI AC World Index thereafter. Both indexes are denominated in U.S. dollars. Our count of
corrections excludes those that turn into a bearmarket. We count corrections that occur after a bear market has recovered from its trough even if stock prices haven’t yet reached their previous peak.
Past performance is not a guarantee of future returns. The performance of an index is not an exact representation of any particular investment, as you cannot directly invest in an index.

                                                                                                                                                                                                               4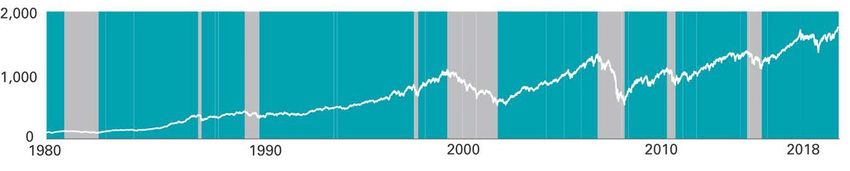
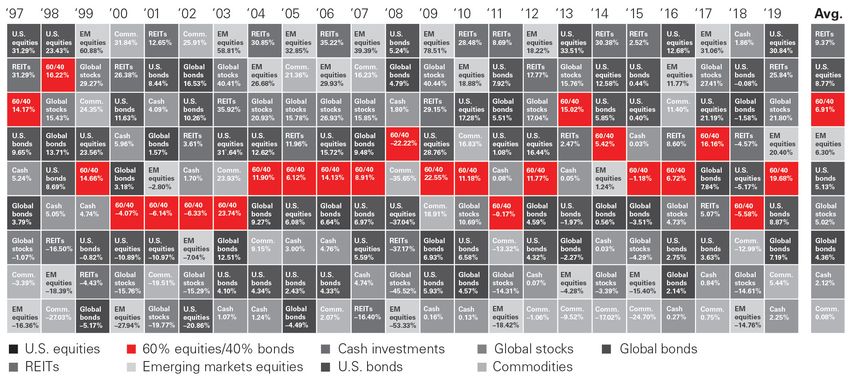
More consistency through balance

Annual returns by asset class, from the highest to the lowest, 1997-2019

Past performance is no guarantee of future returns. The performance of an index is not an exact representation of any particular investment, as you cannot invest directly in an index.
Source: Vanguard, as of December 31, 2019.
Note: Cash is represented by the FTSE 3-Month U.S. Treasury Bill Index. REITs are represented by the MSCI US REIT Index adjusted to include a 2% cash position (Lipper Money Market Average) through April 30, 2009,
and MSCI US REIT Index thereafter. U.S. equity is represented by the Dow Jones Wilshire 5000 Index through April 22, 2005; MSCI US Broad Market Index through June 2, 2013; and CRSP US Total Market Index
thereafter. Emerging markets equity is represented by Select Emerging Markets Index through August 23, 2006; MSCI Emerging Markets Index through January 9, 2013; FTSE Emerging Transition Index through June 27,
2013; FTSE Emerging Index through November 1, 2015; FTSE Emerging Markets All Cap China A Transition Index through September 18, 2016; and FTSE Emerging Markets All Cap China A Inclusion Index thereafter. U.S.
fixed income represented by Bloomberg Barclays U.S. Aggregate Bond Index through December 31, 2009, and Bloomberg Barclays U.S. Aggregate Float Adjusted Index thereafter. Global fixed income represented by
Bloomberg Barclays Global Aggregate ex-USD Float Adjusted RIC Capped Index (USD Hedged). Global equity is represented by the Total International Composite Index through August 31, 2006; MSCI EAFE + Emerging
Markets Index through December 15, 2010; MSCI ACWI ex USA IMI Index through June 2, 2013; and FTSE Global All Cap ex US Index thereafter. Commodities are represented by the Bloomberg Commodity Index.
Composite 60/40 portfolio’s equity allocation consists of 60% U.S.-domiciled stocks and 40% non-U.S. domiciled stocks; bond allocation consists of 70% U.S.-domiciled bonds and 30% non-U.S. domiciled bonds.
                                                                                                                                                                                                                   5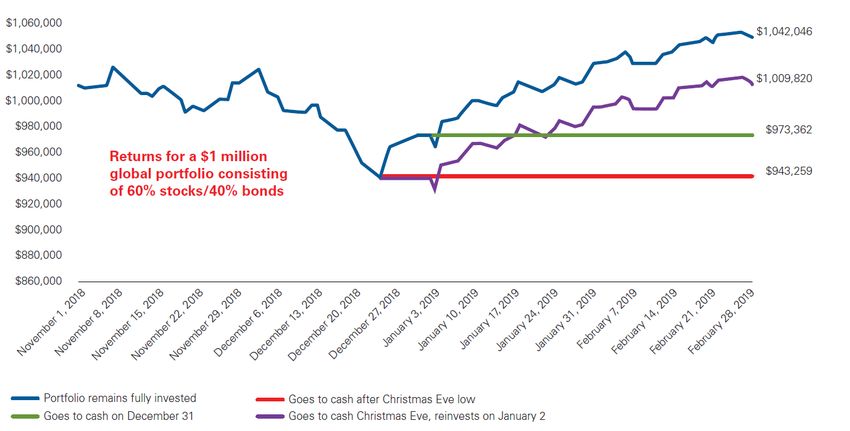
A recovery in phases

Sources: U.S. Bureau of Economic Analysis and Vanguard forecasts.
                                                                    6
Global scenario estimates
Source: Vanguard Investment Strategy Group, as of April 30, 2020.
7Important information
All investing is subject to risk, including the possible loss of the money you invest.
Diversification does not ensure a profit or protect against a loss.
Please remember that all investments involve some risk. Be aware that fluctuations in the financial markets and other factors may cause declines in the
value of your account. There is no guarantee that any particular asset allocation or mix of funds will meet your investment objectives or provide you with
a given level of income.
Investments in bonds are subject to interest rate, credit, and inflation risk.
Investments in stocks or bonds issued by non-U.S. companies are subject to risks including country/regional risk and currency risk.
Stocks or bonds of companies based in emerging markets are subject to national and regional political and economic risks and to the risk of currency
fluctuations. These risks are especially high in emerging markets.
The Dow Jones Wilshire 5000 Index is a product of S&P Dow Jones Indices LLC, a division of S&P Global, or its affiliates (“SPDJI”), and has been
licensed for use by Vanguard. Standard & Poor’s®, and S&P® are registered trademarks of Standard & Poor’s Financial Services LLC, a division of
S&P Global (“S&P”); Dow Jones® is a registered trademark of Dow Jones Trademark Holdings LLC (“Dow Jones”); and these trademarks have been
licensed for use by SPDJI and sublicensed for certain purposes by Vanguard. Vanguard products are not sponsored, endorsed, sold or promoted by
SPDJI, Dow Jones, S&P, their respective affiliates, and none of such parties make any representation regarding the advisability of investing in such
product(s) nor do they have any liability for any errors, omissions, or interruptions of the Dow Jones Wilshire 5000 Index.
Center for Research in Security Prices, LLC (CRSP®) and its third-party suppliers have exclusive proprietary rights in the CRSP® Index Data, which
has been licensed for use by Vanguard but is and shall remain valuable intellectual property owned by, and/or licensed to, CRSP®. The Vanguard
Funds are not sponsored, endorsed, sold or promoted by CRSP®, The University of Chicago, or The University of Chicago Booth School of Business
and neither CRSP®, The University of Chicago, or The University of Chicago Booth School of Business, make any representation regarding the
advisability of investing in the Vanguard Funds.
8Important information
BLOOMBERG® is a trademark and service mark of Bloomberg Finance L.P. BARCLAYS® is a trademark and service mark of Barclays Bank Plc, used under
license. Bloomberg Finance L.P. and its affiliates, including Bloomberg Index Services Limited ("BISL") (collectively, "Bloomberg"), or Bloomberg's licensors
own all proprietary rights in the Bloomberg Barclays Indices.
The products are not sponsored, endorsed, issued, sold or promoted by “Bloomberg or Barclays”. Bloomberg and Barclays make no representation or
warranty, express or implied, to the owners or purchasers of the products or any member of the public regarding the advisability of investing in securities
generally or in the products particularly or the ability of the Bloomberg Barclays Indices to track general bond market performance. Neither Bloomberg nor
Barclays has passed on the legality or suitability of the products with respect to any person or entity. Bloomberg’s only relationship to Vanguard and the
products are the licensing of the Bloomberg Barclays Indices which are determined, composed and calculated by BISL without regard to Vanguard or the
products or any owners or purchasers of the products. Bloomberg has no obligation to take the needs of the products or the owners of the products into
consideration in determining, composing or calculating the Bloomberg Barclays Indices. Neither Bloomberg nor Barclays is responsible for and has not
participated in the determination of the timing of, prices at, or quantities of the products to be issued. Neither Bloomberg nor Barclays has any obligation or
liability in connection with the administration, marketing or trading of the products.
London Stock Exchange Group companies include FTSE International Limited ("FTSE"), Frank Russell Company ("Russell"), MTS Next Limited ("MTS"), and
FTSE TMX Global Debt Capital Markets Inc. ("FTSE TMX"). All rights reserved. "FTSE®", "Russell®", "MTS®", "FTSE TMX®" and "FTSE Russell" and other
service marks and trademarks related to the FTSE or Russell indexes are trademarks of the London Stock Exchange Group companies and are used by
FTSE, MTS, FTSE TMX and Russell under license. All information is provided for information purposes only. No responsibility or liability can be accepted by
the London Stock Exchange Group companies nor its licensors for any errors or for any loss from use of this publication. Neither the London Stock Exchange
Group companies nor any of its licensors make any claim, prediction, warranty or representation whatsoever, expressly or impliedly, either as to the results to
be obtained from the use of the FTSE Indexes or the fitness or suitability of the Indexes for any particular purpose to which they might be put.
© 2020 The Vanguard Group, Inc. All rights reserved.
PID1264132(1181405, 1148927)_DOLU10/13/2021
9You can also read