MAXQDA Research Example - Helpful Features to Analyze Interviews with MAXQDA 2020, Step-by-Step
←
→
Page content transcription
If your browser does not render page correctly, please read the page content below
MAXQDA
   Research Example
Helpful Features to Analyze Interviews with
       MAXQDA 2020, Step-by-Step
Helpful Features to Analyze Interviews
with MAXQDA 2020, Step-by-Step
MAXQDA Team
Abstract: MAXQDA is the perfect software to help you transcribe, organize, analyze, visualize, and publish
your interview data.
Keywords: audio file, analyze Interviews, Code Matrix Browser, Document System, fieldwork, focus group,
interview analysis, Memo Manager, mixed methods, virtual ethnography
Table of Contents
1. Import and Organization of Your Interviews
1.1. Importing and Organizing Interview Transcripts
1.2. Importing and Organizing Handwritten Interview Notes
2. Coding Your Interviews
3. Deepen your Interview Analysis
4. Visualization
5. Create a Report of Your Interview Analysis
1. Import and Organization of Your Interviews
Take a look at your data – how did you conduct your interviews? Did you write the answers down
with a pen and paper? Or did you type while listening? Or maybe you used a voice recorder or a
camera in the field? Today, the use of remote interview techniques is more important than ever.
Are you going to be conducting your evidence-gathering over the phone or video calls for
your project? No problem! Simply record the audio or video calls – MAXQDA can help you
organize all kinds of data! The data import is easy and quick. Simply open MAXQDA, create a new
project and drag and drop your interview data into your “Document System” window.
1.1: Importing and Organizing Interview Transcripts
Aside from drag-and-drop, you can also use the Import tab in the main ribbon menu, click on the
icon for your data type, and select the files in the dialog window that opens. For texts, click on the
leftmost icon called, “Texts, PDFs, Tables” in the Import tab. Alternatively, you can now import your
transcripts from transcription services, such as AmberScript, TEMI, Trint, f4, f5transkript, Transana,
Rev.com, and more directly into the MAXQDA 2020 as well.
MAXQDA Research Blog - March 2020You can even import the transcript with timestamps so that you can go back and listen to
the original data at any time with just one click.
Tip: Are you conducting (online) focus group discussions? You can import focus group transcripts
directly into MAXQDA, whereby the speech contributions and pre-coding work are automatically
recognized. Online focus groups can be carried out, for example, with Kernwert.com, a platform
for online qualitative research. The exports from Kernwert and then be imported into MAXQDA
using the Structured Text import option.
Next, you can organize your interviews into the document groups, which you can think about like
folders on your computer. To create a new document group, click the folder with a “plus” symbol
icon in the “Document System” window’s toolbar. You can rename the folder with a right-click and
then drag and drop your interviews into the folder. Some ideas to organize your interviews could be
by location, time, topic, or category, but that is completely up to you and can always be changed
later if needed.
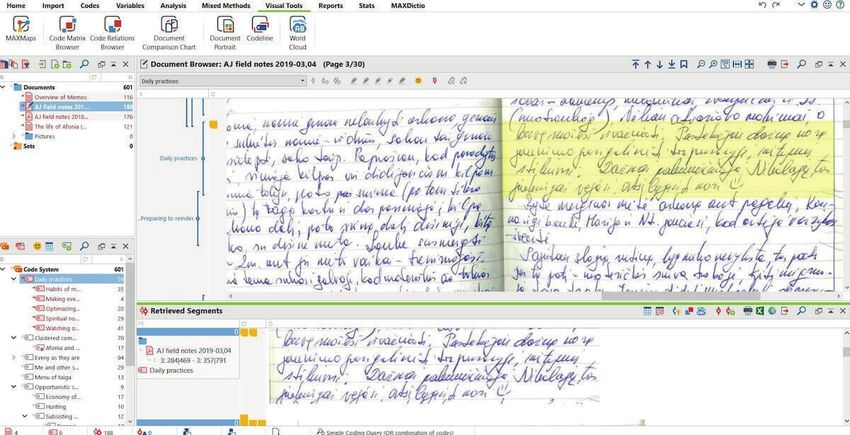
1.2: Importing and Organizing Handwritten Interview Notes
A lot of interviews take place on-the-go in the field or in situations where an audio recording device
would be impractical due to background noise, for example. If you have handwritten interview notes,
there’s no need to type up your notes if you don’t want to or don’t have time to. Simply
scan them or take photos of them with your phone and import that image or PDF directly
into MAXQDA!
Importing and Organizing Handwritten Interview Notes (an example from research by Aivaras Jefanovas)
MAXQDA Research Blog - March 2020Step 2: Coding Your Interviews
A great advantage of transcribing directly with an all-in-one analysis tool like MAXQDA is that you
can begin coding your data, adding memos, and paraphrasing while you transcribe, making
sure that you get all of your first ideas down right when they come to you. During the
transcription, you can also use the “Automatic Speaker Change” function to clearly define who is
speaking and then autocode them with the Lexical Search later. For example, you could autocode the
sentences from the moderator as “questions” and sentences from the speakers as “answers”.
Create new groups of codes to identify facts in field notes (an example from the research of Ruijie Peng)
Ok, now let’s take a look at how to code your interviews with MAXQDA. Assigning a piece of your
text, image, or audio/video file a category is what we call “coding”. You can create, organize, make
hierarchies, assign colors, and manage your codes in MAXQDA’s “Code System” window (see the
left half of the screenshot above). What codes you create and how you organize them will depend on
your research question and goals. Even how you code will depend on your own analysis technique.
For example, you can create codes ahead of time and then assign a code to a text segment via drag-
and-drop, or you can code in-vivo as you are reading your interview transcript, creating codes directly
from the individual words or phrases said in the interview. Or you can use MAXQDA’s Open Coding
Mode, which is especially helpful for methodological approaches, such as Grounded Theory.
MAXQDA Research Blog - March 2020If you have a lot of data to get through, we also recommend creating a Quick List of your most selected codes, which will save you time if you have a large Code Tree and need to process your data quickly. Simply right-click a code and select Add code to…> Code Favorites. After you have added the first code, the code favorites window will appear. You can then continue to add more codes to the list in the same fashion: right-click on the code and select Add code to code favorites. Make sure to take a look at the MAXQDA Online Manual to see all your options. Step 3: Deepen your Interview Analysis As mentioned above, while you are transcribing and coding (researchers often conduct two or more rounds of coding), it is helpful to continuously add your thoughts and remarks to your data. In MAXQDA, two great tools to help you are the Memo and Paraphrase functions. • Memos are like post-it notes that can be attached everywhere in the project: Documents, Document Groups, Document Sets, Codes, Code Sets, text, video or audio segments, etc. There are also free memos that are not attached to anything and just can be created to express your thoughts about the project. Keep track of your ideas, the reasoning behind the steps you are taking, and new insights that develop organically through the analysis process using MAXQDA’s memos functions. You can organize your memos in whichever way works best for you, but it is advisable to add a heading and explaination of which segment of data they are referring to. By taking a few extra minutes to organize your memos, you will save a lot more time during the later stages of coding and reporting. Luckily, MAXQDA automates several steps for you so that you don’t need to handwrite and layout your notes with cards or post-its any longer! • Paraphrases help you summarize particular segments of the text with your own words. They can be used for the text interpretation within the qualitative data analysis or simply to shorten or to rephrase some sections of the text. To start working with the paraphrases simply activate MAXQDA’s Paraphrase Mode by clicking the Paraphrase icon in the Analysis tab, or by pressing Ctrl+Shift+P (Windows) or cmd+Shift+P (Mac). Then, using the Paraphrases Matrix, you can compare cases or groups in a table view. This comparison is an excellent tool to help you quickly condense a large amount of data into an easy-to-read overview where only the most important information you need at that time in your analysis is displayed. MAXQDA Research Blog - March 2020
Step 4: Visualization

Next, we recommend exploring MAXQDA’s visualization options, not only for your empirical evidence
but for all parts of your project, including your literature and coding work as well. Visualizing is an
excellent way to create an overview of both of your data and of your data analysis for yourself and
for presentations. Everything you create using MAXQDA’s Visual Tools can be exported as an
image that you can add directly to your paper, poster, or PowerPoint – perfect for virtual
presentation as well!

MAXQDA has numerous features and functions, including MAXMaps, a comprehensive concept map-
maker that has just been optimized with the release of MAXQDA 2020 – perfect for theory-building
and “visual thinking”! You can find all of MAXQDA’s Visual Tools in the main ribbon menu tab of
the same name. Here are three of MAXQDA’s Visual Tools that we frequently see used by researchers
conducting interview analysis:

• Word Cloud: is used to visualize the most common words in a
  text and is very good for the text presentation. This feature is
  mostly useful for the direct analysis of the data and is especially
  helpful for semantic analysis, for example, or for getting quick
  insights into the most-frequently mentioned themes in your
  interviews.

• Document Portrait: shows all coded segments of the document
  based on the sequence and colors of the codes. This tool helps
  you identify the frequency and the order of the codes at just
  one glance. For example, if I want to reflect on the response
  lengths between participants, this is what the interview with
  the autocoded “questions” and “responses” looks like (see
  screenshot right):

• Code Matrix Browser: visualize the codes, but this time you can
  pick several documents and compare them with each other.
  Generally, this tool helps you to answer the question: which
  code occurs more frequently in which document?

Step 5: Create a Report of Your Interview Analysis

When it’s time to publish, MAXQDA is here to help you present your data. Whether you’re exporting
the codebook to share your code definitions (your thinking/reasoning behind on your codes and
categories) with your thesis supervisor, archiving your data for the European Union’s new re-use
regulations, or creating a report in your own corporate design, MAXQDA is here to help. You can
find all the options in MAXQDA’s Reports tab.

MAXQDA Research Blog - March 2020
Let’s take a look at an amazing tool called the Smart Publisher, MAXQDA’s powerful report generator.
It is extremely easy to use so that in just a few moments you will have a Word document neatly
presenting the results of your coding – including title page and table of contents.

                                     Extract from a Smart Publisher report

Just go to the Reports tab and then click on the “Smart Publisher” icon. Now choose in the dialog
menu, which codes should be included in the report. In the next dialog window, you design your
report with the help of some settings. You choose the title and the image for the first page, header
and/or footer, order of the coded segments and the source information that you want to include in
your report. Then all that is left to do is to click “ok” – and your report is done!

MAXQDA Research Blog - March 2020                                            New research examples every week:
                                                                                             maxqda.com/blog
You can also read