WEATHER RADAR PRINCIPLES - 2021 RA-IV WMO Tropical Meteorology Course - Stacy R. Stewart - Weather Radar Principles (Stacy R. Stewart)
←
→
Page content transcription
If your browser does not render page correctly, please read the page content below
2021 RA-IV WMO Tropical Meteorology Course

W EATHER R ADAR PR I NCI PLES

 Hurricane Michael, 2018

                                 Stacy R. Stewart
                            Senior Hurricane Specialist
                     NOAA/National Hurricane Center, Miami, Florida
                                    28 April 2021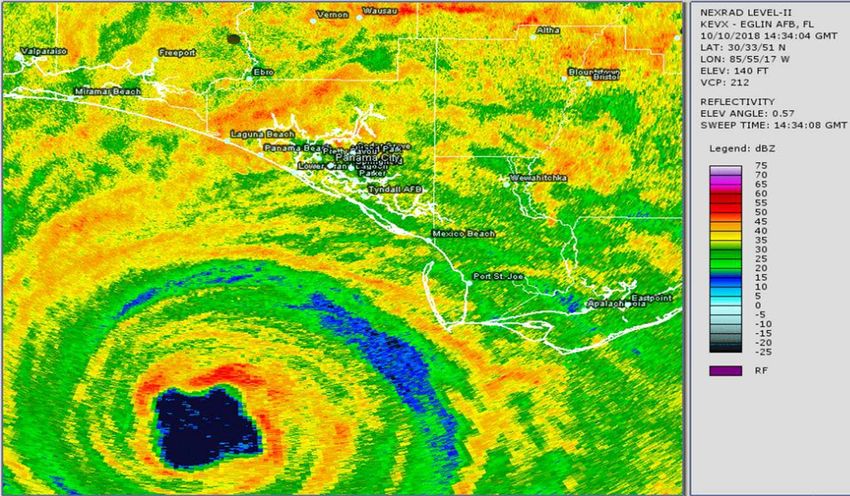
COURSE OBJECTIVES
• Overview of Basic Radar Principles
• Wavelengths suitable for weather surveillance
• Radar beam height above the surface
• Equivalent reflectivity or dBZ
• Z-R (Reflectivity-Rainfall) relationships
        – estimating rainfall rates
        – WSR-88D tropical rainfall Z-R equation
        – Practical examples
• Doppler Velocity Data
        – the ‘Doppler Dilemma’
        – VDoppler vs. Vactual
        – Reconnaissance aircraft data vs. Doppler velocity data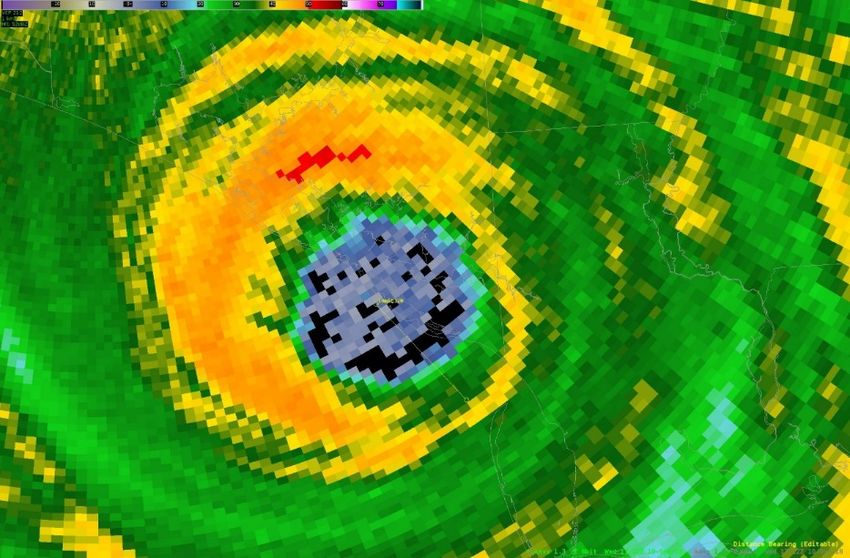
E-M Wavelengths Suitable for Weather Surveillance
Propagation of
Electromagnetic
Radiation (EM)

                       I nfrared
                       satellite
                       im agery

  Vem = f

             Passive m icrow ave   Greater Attenuation
             satellite im agery

                                   Lesser Attenuation

Vem ~ speed of light
= 186,000 smi/sec
= 299,792,458 m/s
Radar Operating Frequencies
       Frequency (MHz)      Wavelength (cm) Band
       30,000……………………..1……………………….K (scatterometer)
       10,000……………………..3……………………….X
       6,000………………………5……………………….C
       3,000……………………..10……………………...S
       1,500……………………..20……………………….L                    (air traffic control)

• The longer (shorter) the wavelength, the larger (smaller) the
  precipitation-size particle that can be detected.

• The longer (shorter) the wavelength, the less (more) likely
  that precipitation attenuation of the radar signal will occur.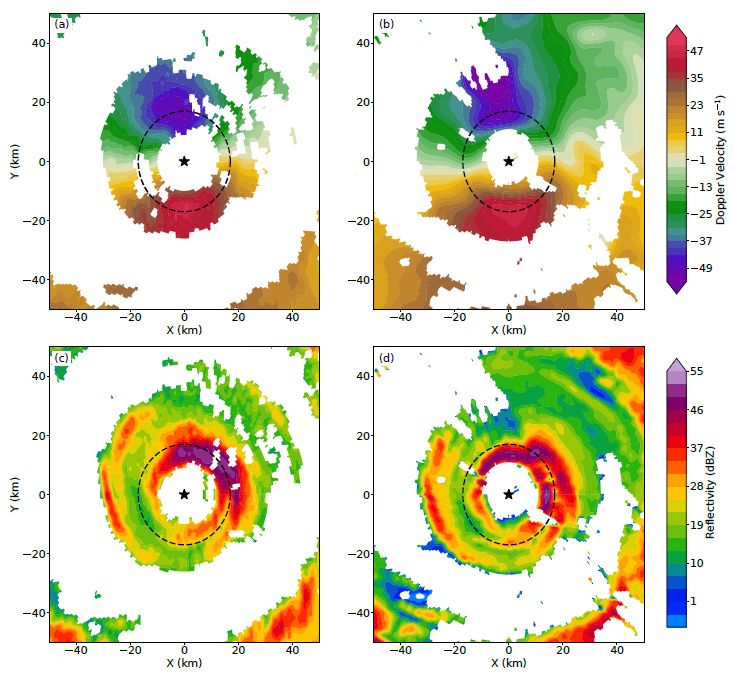
WEATHER RADAR BANDS
            10 cm            S-band
             5 cm            C-band
             1 cm            K-band

The NOAA National Weather Service WSR-88D
Doppler radar is a 10-cm wavelength (S-band)
weather detection radar that is excellent at
sampling most precipitation particles w ithout
encountering any significant signal loss due to
precipitation attenuation .
A large amount of horizontally polarized EM
  energy (~1,000,000 W) is transmitted…

 Non-isotropic (i.e., conical) radiator    Isotropic radiator

…but only a fraction of that energy (~0.000001 W) is
‘reflected’ (i.e., returned) back to the radar receiver.
Radar Beam Height Above The Surface
Radar Beam Propagation

                                                       Superadiabatic
                                                        Lapse Rate

                                                        Standard
                                                       Atmospheric
                                                       Lapse Rate

                                                       Temperature
                                                        Inversion

Differences in atmospheric density will cause the radar
beam to ‘bend’ (i.e., refract) differently causing differences
in beam centerline height from “standard”.
-- RHI diagrams assume standard refractivity index --
Radar Beamwidth Calculator
http://www.wdtb.noaa.gov/tools/misc/beamwidth/beamwidth.htmlOVERSHOOTING UNDERSAMPLING
Equivalent Reflectivity (dBZ)
Radar Equation for Non-Isotropic Radiator

Everything inside the brackets is “known” and is, therefore,
a “constant”, which means that power returned to the
radar by a target is directly related to the reflectivity
factor, Z, and indirectly related to the range, R.
Radar Equation for Non-Isotropic Radiator
RETURNED POWER
                                                  6
Returned Power:                  P r ∝ Diameter
                                              number of       drop
                                               drops of    diameter(s)
                                              diameter D

Reflectivity factor:
(for Rayleigh scattering, D
Effect of Drop Size on Reflectivity
=
One 1/4-inch diameter drop returns as much energy as
64 drops of 1/8-inch diameter.
However, one 1/4-inch diameter drop has a volume of only
0.065 in3, whereas sixty-four 1/8-inch diameter drops yield a
volume of 0.52 in3 …or 8 times as much total water mass!What would Z be for 64 drops having
a diameter of only 1 mm ?
Z = ∑ ni × D i
6
Z = ∑ 64 ×1 6
6
mm
Z = 64 3
mNow, what would Z be for only one drop
having a diameter of 3 mm ?
Z = ∑ ni × D i
6
Z = ∑ 1× 3 6
6
mm
Z = 729 3
mREFLECTIVITY DILEMMA The one 3-mm diameter rain drop returns more power and produces a larger reflectivity than the sixty-four 1-mm drops do… yet the one 3-mm diameter rain drop contains much less total water mass than the sixty-four 1-mm rain drops!
Z-R (Reflectivity-Rainfall) relationships

     – Estimating Rainfall Rates –
Z = ∑ ni × D i
6
Since we do not know the actual drop size distribution in
a radar volume sample, we use “equivalent reflectivity”
instead of actual reflectivity.
Pr × R 2
Ze = where, Pr = power returned
R = target range
const
Equivalent reflectivity
dBZ e = 10 × log(Z e )Using 10 times the logarithm of Ze
keeps the range of values of Ze small,
but still operationally useful.
dBZ e = 10 × log(Z e )
Ze Log Ze dBZe
10 1 10
100 2 20
1,000 3 30
10,000 4 40
100,000 5 50
1,000,000 6 60
10,000,000 7 70Z-R or Reflectivity-Rainfall Relationships
we now have the input we need (i.e. Ze), to find…
Rain gauge
…an empirical relationship to estimate rainfall rate using the
logarithmic function equation –
Ze = a Rb
Ze = 300 R1.4 where R is rain rate (mm/h)Rainfall Rates (in\mm hr-1) for Various Z-R Relationships
WSR-88D (default) Conventional Convective Snowfall
dBZe 300R1.4 200R1.6 486R1.37 2000R2
20 0.02\0.05 0.03\0.76 0.01\0.25 0.01\0.25
30 0.09\2.28 0.12\3.05 0.07\1.78 0.03\0.76
40 0.48\12.2 0.47\11.9 0.36\9.14 0.09\2.29
50 2.50\63.5 1.90\48.3 1.90\48.3 0.28\7.11
55 5.7\145 (55 dBZ = maximum reflectivity used for rainfall conversion by WSR-88D)
Probable
60 12.9\327 8.10\306 10.3\262 0.88\22.4
Wet Hail
Contamination
70 67.0\1702 34.1\866 55.4\1407 2.78\70.7WSR-88D Tropical Rainfall Z-R Equation
Ze = 250 R1.2Rainfall Rates (in\mm hr -1) for WSR-88D Tropical Z-R Relationship
dBZ Z 250R1.2
minimum radar reflectivity for
determining eyewall diameter 15 31.6 0.01\0.18
20 100.0 0.02\0.47
25 316.2 0.05\1.22
30 1000.0 0.12\3.17
35 3162.3 0.33\8.28
40 10000.0 0.85\21.6
45 31622.8 2.22\56.5
50 100000.0 5.80\147.4
55 316227.8 15.14\384.6
1.2
R = Ze
250Sample Rainfall Rate Calculation
What is the rainfall rate in mm/h & inches/h for 42 dBZe ?
1.2
R = Ze
250
**Step 1 -- convert 42 dBZe to Ze ---> 42/10 = 4.2 ---> antilog10 4.2 = 15848.9319
**Step 2 -- substitute 15848.9319 for Ze and divide ---> 15848.9319/250 = 63.3957276
**Step 3 -- take the 1.2-root of 63.3957276 = 31.748020998281 mm/h or ~31.7 mm/h
**Step 4 -- divide 31.7 mm/h by 25.4 mm/inch = 1.248 inch/h or ~1.25 inch/hRadar Detection of
Atmospheric Motion
-----------
Doppler VelocityIn addition to a measurement of power (reflectivity), we also have a measurement of particle motion. A Doppler weather radar measures a single component of motion, but only tow ard or aw ay from the radar.
The “Doppler Dilemma”
1. Speed of light         c
2. Wavelength             λ
3. PRF   (pulse repetition frequency)

                     c
           Rmax =
                                     Maximum
                                    Unambiguous
                                       Range
                  2 PRF
 but,
                              λ
           Vmax = PRF
                                     Maximum
                                    Unambiguous
                                      Velocity
                              4
VDoppler vs. Vactual Wind Data
Example of Actual Velocity => Va = 20 kt

                             target
        V r = Doppler
        radial m otion
                             Va = actual target motion
                         A

                   angle of incidence or Radar
                   Viewing Angle (R VA) = 45O

radar

                              Vr = Va x cos A (or RVA)
                                  = 20 kt x cos 45o
                                  = 20 x .707
                              Vr = 14.14 kt
WSR-88D and other Doppler weather radars utilize Volume
Scans to collect reflectivity and Doppler velocity data to
avoid ‘Doppler Dilemma’
http://www.wdtb.noaa.gov/courses/dloc/topic2/rda/vcp.htmlRecon Wind Data vs. WSR-88D (VDoppler) & Vactual Direction
INTRODUCTION Reconnaissance aircraft provide snapshots in time of a tropical cyclone’s (TC) wind field, generally at an approximate altitude (ASL) or constant pressure level Land-based WSR-88D Doppler radars provide a complete depiction of TC’s wind field, but at various altitudes and only that component of the wind field moving toward or away from the radar site WSR-88D Doppler radar can aid with filling in gaps between aircraft flight legs along with changes in the structure of a TC’s wind field and eyewall pattern WSR-88D Doppler velocity data indicate at least the minimum wind speed present owing to the Doppler Effect Reconnaissance aircraft sample winds along a very narrow flight path, whereas Doppler radar data are collected within a relatively large volume sample that increases in size with increasing range Reconnaissance aircraft typically collect peak 10-sec wind data along a 1-km-long flight track; WSR-88D Doppler data are collect in 250-m long radial bins along 360 azimuthal directions In this study, WSR-88D Doppler radar velocity data were averaged along four (4) contiguous 250-m radial bins and a 4-bin average actual velocity was computed using the aircraft- derived wind direction, and then compared to the reconnaissance aircraft-derived wind speed WSR-88D radar collection times were limited to within 3 minutes of the reconnaissance aircraft wind observation and within 250 m (820 ft) of the aircraft flight-level altitude
250-m radar bin
10-sec wind speed = ~ 1 km 10-sec wind
speed = ~ 1
km
Recon 30-sec average wind speed = ~ 3 km
53WRS Fixed-wing reconnaissance aircraft typically fly at a ground speed of ~100 ms-1
30-second average wind speed covers a distance of 3,000 m
10-second average wind speed covers a distance of 1,000 m; this is a peak moving-average wind
WSR-88D Doppler radar base velocity ‘bins’ have an along-radial length of 250 m
WSR-88D Doppler radar ‘bins’ have an azimuthal width that varies with range from the radar --
• 30 nmi = ~970 m
• 60 nmi = ~1,940 m
• 90 nmi = ~1,500 m
• 120 nmi = ~2,000 m
10-second average recon wind speed would cover the width of one radar bin at ~30-nmi range
10-second average recon wind speed would cover four 250-m radar radial bins at any rangeGround-Based Velocity Track Display (GBVTD) Doppler-Velocity Analysis Method
The geometry and symbols used in the formulation Doppler velocity at z = 4 km (a) observed by KAMX
of GBVTD wind fields (modified from Jou et al. WSR-88D (Miami, FL) radar at 1921 UTC, and (b)
(2008) and Cha and Bell (2020)). Red arrow resampled from dual Doppler analysis synthesized
denotes the Doppler velocity; Blue arrow from 1855-1940 UTC for Hurricane Matthew on 6
indicates actual or tangential velocity/wind speed October 2016. The black star denotes KAMX radar
(VT = Vactual). location, and the dashed circle denotes the radius
of maximum wind of 18 km (from Cha and Bell
(2020)).Single-Doppler Radar and GBVTD Dilemma
• GBVTD assumes that flow is circular at all radar
bins when calculating the tangential/Vactual wind
speed.
• This can result in large errors where the tangential
flow deviates from circularity such as when
mesovortices are superimposed onto the eyewall
background flow, resulting in a skewing of the
cosine of the Radar Viewing Angle (RVA) used to
calculate Vactual .
• However, since the actual wind direction is known
via reconnaissance flight-level data, an accurate
RVA and resultant Vactual wind speed can be
H. M ichael-K EVX radar 0.5 deg BREF 1414Z 10 OCT 2018
calculated and compared to the aircraft-derived
wind speed.
M eso M eso . ..
Superim posed
tangential &
m esovortex
flow s
M eso M eso
. .Sample Data Entry Table for H. Harvey (2017)
Vactual = VDoppler / Cosine RVAHurricanes Katrina (2005) -- Harvey (2017) -- Michael (2018)
150
Doppler Radar 4-bin Average Vactual (kt) R = 0.953
140
130
120
110
100
90
90 100 110 120 130 140 150
Reconnaissance Aircraft Flight-level Wind Speed (kt)
NOTE: Doppler radar data set includes Doppler velocities within + 2.5 minutes and + 300 meters of aircraft HDOB wind observationsOperational and Post-Storm Analysis Use Example – Hurricane Katrina, 28 August 2005
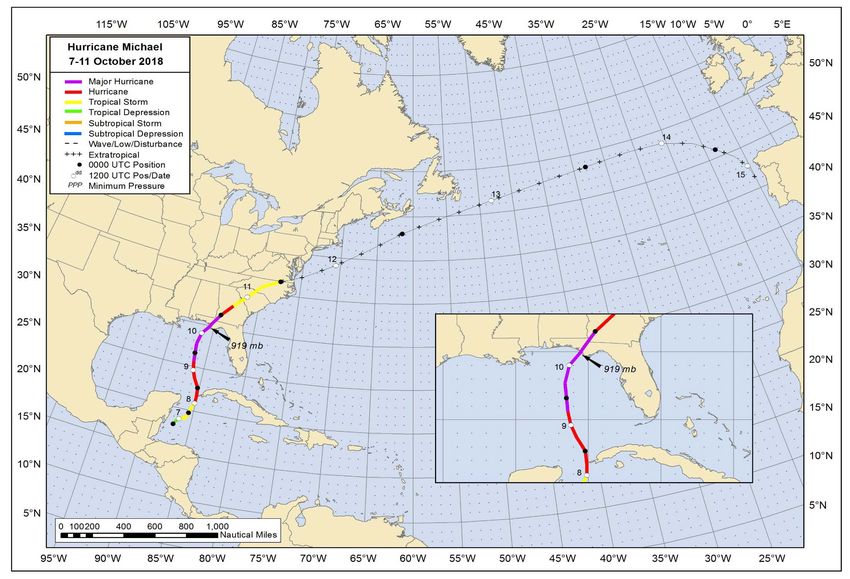
Category 5 Hurricane Michael, 7 - 11 October 2018

                        Maximum Sustained Winds:
                        140 kt/160 mph (Cat 5) 1-minute
M
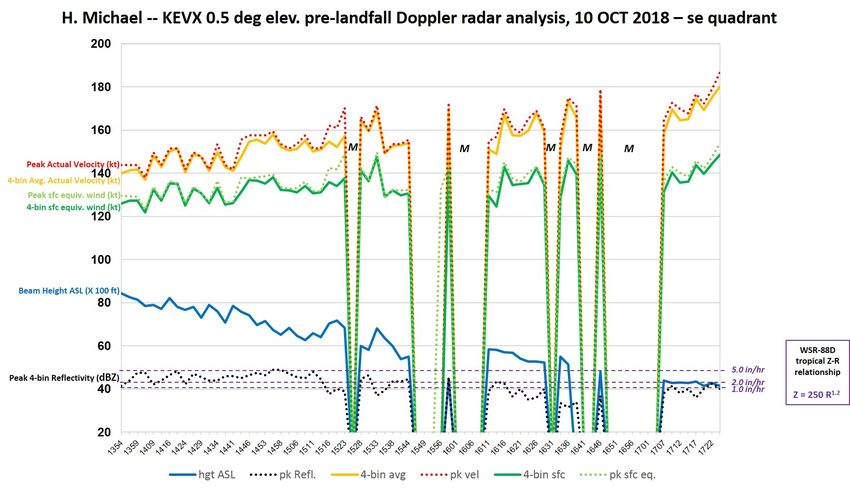
The KEVX (Eglin AFB, Florida) WSR-88D Doppler radar data analysis
and associated equivalent surface wind speed conversions of the
undisturbed tangential wind flow in the southeastern quadrant (090-
150O true) leading up to landfall indicate that Hurricane Michael was
strengthening right up until landfall occurred at approximately 1730
UTC 10 OCT 2018.

The red-shaded area indicates the time period where original VDoppler
values were not converted to Vactual values due to AWIPS-II data ingest
and display issues; this time period will eventually be converted in the
future. However, the wind speeds shown will likely be lower than the
converted Vactual values.

No VDoppler and Vactual values were obtained time periods where the
tangential wind flow was perturbed by eyewall mesovortices (labeled
“M”) and, thus, making the values there unrepresentative.

The Vactual values over the last ~1 h prior to landfall suggest that
Michael had sustained surface wind speeds of at least 140 kt .
Real-Time
       example
       of the combined
KEVX   tangential and
       four mesovortex
       flows
       (MT) associated
       with Hurricane
       Michael at
       1434:04 UTC 10
       OCT.

       Some of the MT
       flows indicated
       Vactual values of
       180-200 kt, which
       corresponds to an
       equivalent surface
       wind speed of
       153-165 kt using
       recon adjustment
       values ranging
       from 0.825 to
       0.850 for the
       corresponding
       altitudes of the
       VDoppler radar bins.
The tangential &
mesovortex
combined flows can
only be accurately
assessed at
locations M T where
Meso Meso both flows
MT MT
. . directions exactly
coincide, thus
allowing for
symmetrical/circular
Superim posed
tangential &
flow to be assumed
m esovortex flow s
at those points.
. .
MT MT This allows for an
Meso Meso accurate
assessment of the
Cosine of the Radar
Viewing Angle
(RVA) and,
therefore, Vactual to
be calculated.Eyewall mesovortex wind speed data were not included in the computation of Vactual values. However, there were at least 5 cases where the wind direction of the tangential winds and the mesovortex winds coincided, allowing for the calculation of peak combined flows and Vactual values, which ranged from ~180-200 kt, resulting in equivalent surface wind speed estimates of 153-165 kt. Some consideration and weight should be given to the equivalent surface wind speeds associated with the eyewall mesovortices (eddy flow) since the temporal and spatial scales of those features were very similar to scale of the undisturbed eyewall tangential flow between the mesovortices.
AF301 1514A MICHAEL       HDOB 27 20181010                                                                      Radar beam height       = 8337 ft ASL
171930 3000N 08534W 6970 02432 9177 +191 +097 194027 030 053 002 03                                             Aircraft altitude/height = 8599 ft ASL
172000 2959N 08532W 6960 02446 9181 +191 +100 193030 031 /// /// 03
172030 2958N 08532W 6968 02435 9173 +197 +105 208032 033 049 002 00                                             Recon actual wind direction = 225O
172100 2956N 08531W 6963 02446 9171 +205 +121 229049 065 083 001 03                                             Radar radial = 149O
172130 2955N 08530W 6981 02466 9242 +168 +135 238107 122 099 001 00                                             Radar viewing angle = 76O
172200 2954N 08528W 6967 02555 9327 +140 +139 231142 149 121 002 05                                             Cosine 76O = 0.2419
172230 2953N 08527W 6973 02621 9437 +137 +136 225150 152 123 005 03
172300 2952N 08525W 6977 02684 9527 +124 //// 218141 148 132 007 05               Vactual = 225O                Vactual = VDoppler /Cosine of angle
172330 2951N 08524W 6971 02747 //// +114 //// 219140 146 133 006 05
172400 2951N 08522W 6976 02789 9613 +128 +118 217132 136 101 002 03      -38.9
                                                                                                                VDoppler 33.0 kt =>   Vactual =   136.0 kt
172430 2950N 08521W 6971 02819 9641 +130 +106 219124 128 092 001 00
172500 2949N 08522W 6971 02829 9654 +126 +109 222122 123 092 001 00   -35.0                                     VDoppler 35.0 kt =>   Vactual =   144.7 kt
172530 2948N 08522W 6967 02844 9667 +125 +109 224119 120 091 001 00             -42.8                           VDoppler 38.9 kt =>   Vactual =   160.8 kt
172600 2947N 08522W 6970 02853 9679 +123 +114 226116 118 088 003 00                                             VDoppler 42.8 kt =>   Vactual =   176.9 kt
172630 2946N 08522W 6968 02866 9699 +119 +117 229112 115 085 006 00     -33.0
172700 2945N 08523W 6967 02875 9719 +118 +118 233108 110 085 007 00                                             4-bin Vactual average = 154.6 kt
                                                                                                                Recon Vactual =         152.0 kt

                                  171930Z                                                   171930Z

                                                                                                      172230Z

                                             172230Z

                       KEVX 1.3 deg Refl 1722Z 10 OCT 2018                                   KEVX 1.3 deg Vel    1722Z 10 OCT 2018
• WSR-88D Doppler radar velocity data can help fill in wind
speed data gaps between reconnaissance aircraft flight legs.
• WSR-88D Doppler velocity data are equivalent to
reconnaissance aircraft 10-second flight-level wind speeds.
• Data from the Slidell, LA/KLIX WSR-88D suggest that winds at
landfall over extreme southeastern Louisiana the early morning
of 29 August 2005 were 15-20 kt stronger than what was
assessed in the operational ‘best track’ when Hurricane Katrina
made landfall.
• Corpus Christi, TX/KCRP WSR-88D Doppler radar analyses (not
presented) indicate that Hurricane Harvey likely did not make
landfall as a Category 4 hurricane, similar to findings made by
Fernández-Cabán et al (2019**). However, KCRP Doppler
velocity data indicate that Harvey likely produced Category 4
winds ~3 h prior to landfall on Padre Island, TX.
**Observing Hurricane Harvey’s Eyew all at Landfall : 01 May 2019, pp. 759-775 DOI: https://doi.org/10.1175/BAMS-D-17-0237.1Conclusions • Wavelength is a key design consideration for weather radar (WSR-88D uses 10 cm) • Doppler velocity is an effective tool in determining tropical cyclone intensity, and detecting rapid intensification. • Future – dual polarization Doppler radars will provide better precipitation estimates.
You can also read