Update on COVID-19 Projections - Science Advisory and Modelling Consensus Tables September 28, 2021

Page created by Melvin Sparks
 
CONTINUE READING
Update on COVID-19 Projections - Science Advisory and Modelling Consensus Tables September 28, 2021
Update on COVID-19 Projections
  Science Advisory and Modelling Consensus Tables
                September 28, 2021
Update on COVID-19 Projections - Science Advisory and Modelling Consensus Tables September 28, 2021
Key Findings

• New cases, hospitalisations and ICU occupancy are not increasing. There is
  a wide range for case projections, reflecting the fragile situation and high
  degree of instability as colder weather approaches with more time indoors.
• Continued control over case growth requires high vaccination rates in the
  eligible population, continued public health measures, and a flattening of
  growth in mobility.
• The risk of contracting COVID-19, being hospitalized for COVID-19, and
  entering the ICU is several times higher for unvaccinated individuals.
• Vaccination coverage is increasing slowly.
• Post COVID-19 Condition – or Long COVID – will substantially impact the
  health of thousands of Ontarians

                                                                                 2
Update on COVID-19 Projections - Science Advisory and Modelling Consensus Tables September 28, 2021
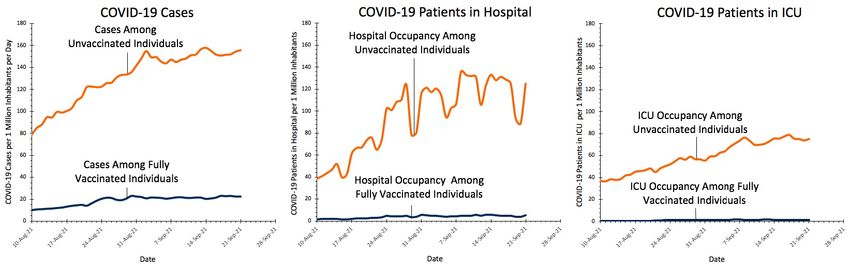
Weekly new cases per 100,000 residents

                                                                                                                  100
                                                                                                                  110

                                                                                                                   10
                                                                                                                   20
                                                                                                                   30
                                                                                                                   40
                                                                                                                   50
                                                                                                                   60
                                                                                                                   70
                                                                                                                   80
                                                                                                                   90

                                                                                                                    0

Data source: CCM
                                                                                                    Chatham-Kent
                                                                                     Wellington-Dufferin-Guelph
                                                                                                           Eastern
                                                                                                           Ottawa
                                                                                                     Southwestern
                                                                                                          Lambton
                                                                                                         Waterloo
                                                                                                            Halton
                                                                                                     Peterborough
                                                                                                Haldimand-Norfolk
                                                                                                      Huron Perth
                                                                                                          Sudbury
                                                                                                                               14-day increases

                                                                                                    Haliburton KPR
                                                                                             Leeds Grenville Lanark
                                                                                                              KFLA
                                                                                                           Algoma
                                                                                                                                                  September 7

                                                                                                        Grey Bruce
                                                                                                     Northwestern
                                                                                                          Renfrew
Data note: Data for the most recent day have been censored to account for reporting delays

                                                                                                    Windsor-Essex
                                                                                                                                                                 Average weekly cases on:

                                                                                                             Brant
                                                                                                         Hamilton
                                                                                                                                                  September 20

                                                                                                           Niagara
                                                                                                              Peel
                                                                                                              York
                                                                                                                                                                                            Cases are increasing in 19 of 34 public health units

                                                                                                           Toronto
                                                                                                Middlesex-London
                                                                                                          Durham
                                                                                                  Simcoe Muskoka
                                                                                                    Hastings & PEC
                                                                                             North Bay Parry Sound
                                                                                                                               14-day decreases

                                                                                                         Porcupine
                                                                                                      Thunder Bay
                                                                                                      Timiskaming
Update on COVID-19 Projections - Science Advisory and Modelling Consensus Tables September 28, 2021
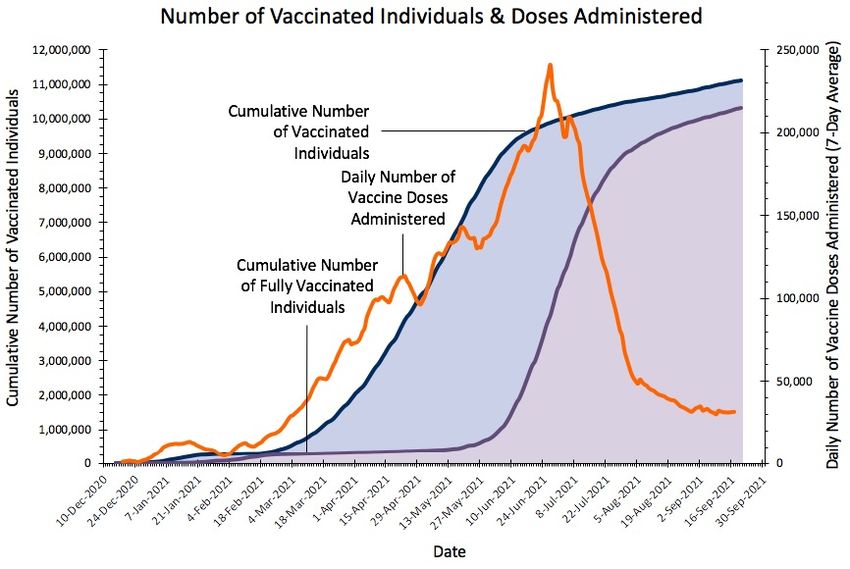
Testing episodes per 1,000
                                                                                                                                     (7-day avg.)

                                                                                 0
                                                                                                  1
                                                                                                             2
                                                                                                                                     3
                                                                                                                                             4
                                                                                                                                                    5
                                                                                                                                                        6
                                                                                                                                                            7
                                                                        Aug 1
                                                                       Aug 15
                                                                       Aug 29
                                                                       Sep 12
                                                                       Sep 26
                                                                       Oct 10
                                                                       Oct 24
                                                                        Nov 7

Data source:OLIS via SAS VA, data up to September 17
                                                                       Nov 21
                                                                        Dec 5
                                                                       Dec 19
                                                                        Jan 2
                                                                       Jan 16
                                                                       Jan 30
                                                                       Feb 13
                                                                       Feb 27
                                                                       Mar 13
                                                       Specimen Date   Mar 27
                                                                       Apr 10
                                                                       Apr 24
                                                                        May 8
                                                                       May 22
                                                                        Jun 5
                                                                       Jun 19
                                                                         Jul 3
                                                                        Jul 17
                                                                        Jul 31
                                                                       Aug 14
                                                                       Aug 28
                                                                       Sep 11
                                                                                                                                                                With the start of school, testing rates are up across Ontario

                                                                                                      Ontario, 2

                                                                                     Timiskaming, 1
                                                                                                                   Chatham-Kent, 3
Update on COVID-19 Projections - Science Advisory and Modelling Consensus Tables September 28, 2021
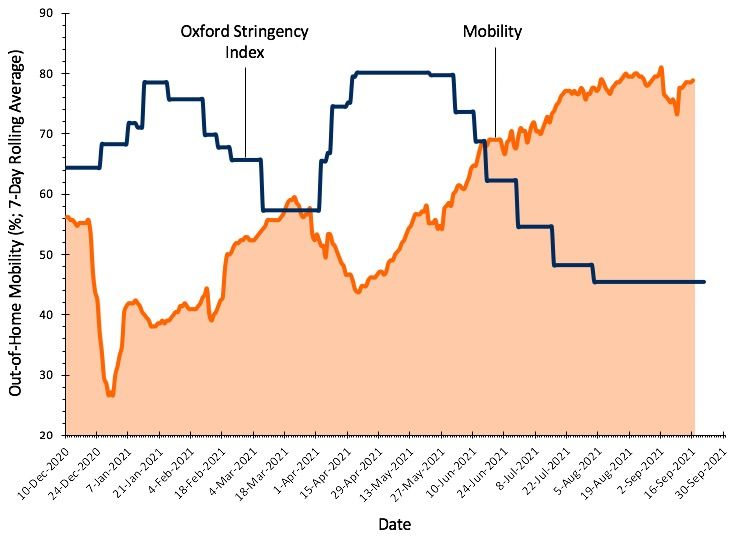
Test positivity appears to be declining
                                                        18
% positivity of daily testing episodes

                                                        16

                                                        14

                                                        12
                                         (7-day avg.)

                                                        10

                                                        8

                                                        6
                                                                                                                                                                                                                                                                                                                                    Chatham-Kent, 4.9%
                                                        4                                                                                                                                                                                                                                                                           Windsor, 4.2%
                                                                                                                                                                                                                                                                                                                                    Brant, 4.0%
                                                                                                                                                                                                                                                                                                                                    Ontario, 2.7%
                                                        2

                                                        0
                                                                     Aug 15
                                                                              Aug 29

                                                                                                                                                                                                                                                                                                         Aug 14
                                                                                                                                                                                                                                                                                                                  Aug 28
                                                                                                         Oct 10
                                                                                                                  Oct 24

                                                                                                                                                                                                                                                                      Jun 19
                                                                                                                                                                                                                                                              Jun 5
                                                                                                                                   Nov 21
                                                                                                                           Nov 7

                                                                                                                                                                                                                           Apr 10
                                                                                                                                                                                                                                    Apr 24
                                                                                                                                                                     Jan 16
                                                                                                                                                                              Jan 30

                                                                                                                                                                                                                                                                                       Jul 17
                                                                                                                                                                                                                                                                                                Jul 31
                                                             Aug 1

                                                                                                                                                                                                                                                                               Jul 3
                                                                                                                                                                                       Feb 13
                                                                                                                                                                                                Feb 27
                                                                                                                                                    Dec 19
                                                                                       Sep 12
                                                                                                Sep 26

                                                                                                                                                                                                         Mar 13
                                                                                                                                                                                                                  Mar 27

                                                                                                                                                                                                                                                                                                                           Sep 11
                                                                                                                                                                                                                                                     May 22
                                                                                                                                                             Jan 2

                                                                                                                                                                                                                                             May 8
                                                                                                                                            Dec 5

                                                                                                                                                                                 Specimen Date
       Data source:OLIS via SAS VA, data up to September 17
       The most recent 3 days have been removed to account for incomplete data.
Vaccination coverage is increasing slowly

                                 Analysis: Secretariat of the Science Advisory Table (https://covid19-sciencetable.ca/ontario-dashboard/)    6
                                                                                                            Data: https://data.ontario.ca/
Vaccination continues to be highly effective
Unvaccinated people have a 7-fold higher risk of symptomatic COVID-19 disease, a 25-fold higher risk of
being in the hospital and 60-fold higher risk of being in the ICU compared to the fully vaccinated

                                                     Analysis: Secretariat of the Science Advisory Table (https://covid19-sciencetable.ca/ontario-dashboard/)    7
                                                   Data: https://data.ontario.ca/ and CCM plus; estimates of patients in hospital and ICU are age standardized
Our 4th wave has flattened due to continued public health
measures and vaccination but cases in children are increasing

                    MOBILITY - Analysis: Secretariat of the Science Advisory Table (https://covid19-sciencetable.ca/ontario-dashboard/) Data:           8
                    https://data.ontario.ca/ & https://ourworldindata.org/explorers/coronavirus-data-explorer CASES BY AGE - Analysis: PHO, Data: CCM
There is a wide range for case projections, reflecting the fragile
    situation and high degree of instability as colder weather approaches.

Figure shows predictions

                                                                                                                                                   PREDICTED
                                                6,000

based on a consensus across
                                                5,000
models from 5 scientific teams.
                                                4,000                                                                      Range from
High uncertainty in estimates                                                                                              last briefing

                                  Daily Cases
because:                                        3,000
• Uncertainty in vaccine
   effectiveness against                        2,000

   infection
• Too early to see impact of                    1,000

   increased contacts with
   return to school and                           -
                                                  2021-04-01       2021-05-01     2021-06-01     2021-07-01   2021-08-01        2021-09-01       2021-10-01         2021-11-01
   workplaces
                                                               ON - Daily                                         ON - 7-Day Average
• Seasonality and time spent                                   High Trajectory (25%↑ in Transmission)             Status Quo (no change in behaviour or policy)
   indoors vs. outdoors                                        Low Trajectory (25%↓ in Transmission)

                                                                                                                                 Predictions informed by modeling from Fields
                                                                                                                                 Institute, McMasterU, PHO, WesternU, YorkU      9
                                                                                                                                    Data (Observed Cases): covid-19.ontario.ca
ICU Occupancy estimates vary from under 200 beds to over
300 beds by the end of October

                                                                                                                               PREDICTED
                  1,000

                   900

                   800

                   700
  ICU Occupancy

                   600

                   500                                                                               Range from
                   400
                                                                                                     last briefing

                   300

                   200

                   100

                     -
                    21 1

                    21 8

                    21 5

                    21 2

                    21 9

                    21 6

                    21 3

                    21 0

                    21 7

                    21 3

                    21 0

                    21 7

                    21 4

                    21 1

                    21 8

                    21 5

                    21 2

                    21 9

                    21 5

                    21 2

                    21 9

                    21 6

                    21 2

                    21 9

                    21 6

                    21 3

                    21 0

                    21 7

                    21 4

                    21 1
                            28
                            0

                            0

                            1

                            2

                            2

                            0

                            1

                            2

                            2

                            0

                            1

                            1

                            2

                            0

                            0

                            1

                            2

                            2

                            0

                            1

                            1

                            2

                            0

                            0

                            1

                            2

                            3

                            0

                            1

                            2
                         4-

                         4-

                         4-

                         4-

                         4-

                         5-

                         5-

                         5-

                         5-

                         6-

                         6-

                         6-

                         6-

                         7-

                         7-

                         7-

                         7-

                         7-

                         8-

                         8-

                         8-

                         8-

                         9-

                         9-

                         9-

                         9-

                         9-

                         0-

                         0-

                         0-

                         0-
                      -0

                      -0

                      -0

                      -0

                      -0

                      -0

                      -0

                      -0

                      -0

                      -0

                      -0

                      -0

                      -0

                      -0

                      -0

                      -0

                      -0

                      -0

                      -0

                      -0

                      -0

                      -0

                      -0

                      -0

                      -0

                      -0

                      -0

                      -1

                      -1

                      -1

                      -1
                    21
                  20

                  20

                  20

                  20

                  20

                  20

                  20

                  20

                  20

                  20

                  20

                  20

                  20

                  20

                  20

                  20

                  20

                  20

                  20

                  20

                  20

                  20

                  20

                  20

                  20

                  20

                  20

                  20

                  20

                  20

                  20
   ON - Daily                                      ON - 7-Day Average                                      High Trajectory (25%↑ in Transmission)

   Status Quo (no change in behaviour or policy)   Low Trajectory (25%↓ in Transmission)

                                                                                           Predictions: COVID-19 ModCollab based on case predictions in previous slide..   10
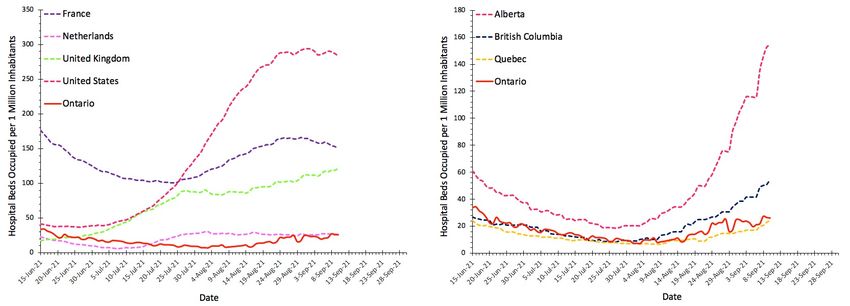
                                                                                                                                Data (Observed ICU Occupancy): CCSO
The 4th wave continues to put pressure on hospital capacity
in a number of jurisdictions
                                               COVID-19 Patients in Hospital

                                                                                                                Analysis: Secretariat of the Science Advisory Table   11
                Data: https://data.ontario.ca/, https://resources-covid19canada.hub.arcgis.com and https://ourworldindata.org/explorers/coronavirus-data-explorer
However, in Ontario hospital and ICU occupancy have been
                                               stable for several weeks
                                       2,500

                                                    Patients in ICU with COVID-related critical illness
                                       2,000        Patients in inpatient beds (incl. ICU) with active COVID19
COVID inpatient and ICU total census

                                       1,500

                                       1,000

                                        500

                                          0
                                        01-Sep-20   01-Oct-20   01-Nov-20   01-Dec-20   01-Jan-21   01-Feb-21 01-Mar-21   01-Apr-21   01-May-21   01-Jun-21   01-Jul-21   01-Aug-21   01-Sep-21   12
Long-term predictions:
 High risk of rapid increase in ICU occupancy can be reduced with a
 cautious approach and early contact reductions.
                40
                     Example: London-Middlesex, predicted ICU occupancy for a population of 500,000.
                35

                30

                25
ICU Occupancy

                20

                15

                10

                5

              0
            2021-04-01      2021-05-01      2021-06-01   2021-07-01     2021-08-01       2021-09-01       2021-10-01       2021-11-01       2021-12-01         2022-01-01

                         Actual (Local demand only)      80% of pre-pandemic contacts          70% of pre-pandemic contacts             Modelled to Sept 15

 • Scenarios shown assume that as ICU occupancy and deaths increase, contacts will decrease due to behaviour change and implementation of public health measures
 • Summer (Step 3) contacts approx. 82.5% compared to pre-pandemic contacts
 • If scaling up to Ontario population, ICU occupancy predictions for Ontario would be expected to be higher and the peak to occur earlier, especially in large urban areas.

                                                                                                                                               Predictions: WesternU
                                                                                                                                                                               13
Patients in ICU are expected to be younger compared to
earlier waves.
                               Example: London-Middlesex, predicted ICU occupancy for a population of 500,000.
                40
                       Scenario: 80% of pre-pandemic contacts + behaviour change as ICU occupancy and deaths increase +
                35                                current estimates of vaccine effectiveness.
                30

                25
ICU Occupancy

                20

                15

                10

                5

                0
                Sep-01        Oct-01   Nov-01   Dec-01   Jan-01   Feb-01    Mar-01     Apr-01     May-01     Jun-01     Jul-01    Aug-01      Sep-01    Oct-01    Nov-01     Dec-01      Jan-01

                Under 12 years
                12-17 years              50-59 years          • Summer (Step 3) contact level approx. 82.5%
                18-24 years              60-69 years          • If scaling up to Ontario population, ICU occupancy predictions for Ontario would be
                25-49 years              Over 70 years          expected to be higher and the peak to occur earlier, especially in large urban areas.            Predictions: WesternU            14
Post COVID-19 Condition – or Long COVID – will substantially
impact the health of thousands of Ontarians
• About 1 in 10 individuals with COVID-19 infection will continue to
  have symptoms lasting more than 12 weeks (estimated 57,000 to
  78,000 individuals in Ontario based on data up to August 2021)
   • Most common symptoms: fatigue, shortness of breath, pain, anxiety and
     depression, trouble thinking/concentrating (“brain fog”)
   • Can impact individuals of any age or baseline health, and can occur even if
     minimal to no symptoms during initial infection
• Vaccines are strongly protective:
   • Reduce the chance of getting infected by about 85%
   • Reduce the chance of developing Long COVID-19 in breakthrough infections
     by about 50%
Post COVID-19 Condition may substantially impact the health
system
Post COVID-19 Condition may result in significant burden on
individuals, healthcare system and society:
• Increased incidence of new chronic disease (e.g., diabetes or
  cardiovascular disease)
• Higher healthcare utilization (physician visits, hospitalization)
• Severe impairment of home-life and day to day activities for some
  individuals
• Longest follow-up study (12 months after infection):
   • 12% of all infected individuals had not returned to work
   • Among the 88% who returned, 24% had not returned to their pre-COVID-19
     level of work
Key Findings

• New cases, hospitalisations and ICU occupancy are not increasing. There is
  a wide range for case projections, reflecting the fragile situation and high
  degree of instability as colder weather approaches with more time indoors.
• Continued control over case growth requires high vaccination rates in the
  eligible population, continued public health measures, and a flattening of
  growth in mobility.
• The risk of contracting COVID-19, being hospitalized for COVID-19, and
  entering the ICU is several times higher for unvaccinated individuals.
• Vaccination coverage is increasing slowly.
• Post COVID-19 Condition – or Long COVID – will substantially impact the
  health of thousands of Ontarians

                                                                                 17
Contributors

• COVID-19 Modeling Collaborative: Kali Barrett, Stephen Mac, David Naimark,
  Aysegul Erman, Yasin Khan, Raphael Ximenes, Sharmistha Mishra, Beate Sander
• Fields Institute: Taha Jaffar, Kumar Murty
• McMasterU: Irena Papst, Michael Li, Ben Bolker, Jonathan Dushoff, David Earn
• Modeling Consensus Table: Isha Berry
• PHO: Kevin Brown, Sarah Buchan, Alyssa Parpia
• Science Advisory Table: Peter Juni, Kali Barrett, Karen Born, Nicolas Bodmer,
  Shujun Yan
• Western University/London Health Sciences Centre : Lauren Cipriano, Wael
  Haddara
• YorkU: Jianhong Wu, Yanyu Xiao, Zack McCarthy

                                                                                  18
Content and review by Modelling Consensus and Scientific
Advisory Table members and secretariat
Beate Sander,* Peter Juni, Brian Schwartz,* Kumar Murty,* Upton Allen, Vanessa Allen, Kali Barrett,
Nicolas Bodmer, Isaac Bogoch, Karen Born, Kevin Brown, Sarah Buchan, Yoojin Choi, Troy Day, Laura
Desveaux, David Earn, Gerald Evans, Jennifer Gibson, Anna Greenberg, Anne Hayes,* Michael
Hillmer, Jessica Hopkins, Jeff Kwong, Fiona Kouyoumdjian, Audrey Laporte, John Lavis, Gerald
Lebovic, Brian Lewis, Linda Mah, Kamil Malikov, Doug Manuel, Roisin McElroy, Allison McGeer, David
McKeown, John McLaughlin, Sharmistha Mishra, Andrew Morris, Samira Mubareka, Laveena
Munshi, Christopher Mushquash, Ayodele Odutayo, Shahla Oskooei, Menaka Pai, Alyssa Parpia,
Samir Patel, Anna Perkhun, Bill Praamsma, Justin Presseau, Fahad Razak, Rob Reid,* Paula Rochon,
Laura Rosella, Michael Schull, Arjumand Siddiqi, Chris Simpson, Arthur Slutsky, Janet Smylie, Robert
Steiner, Ashleigh Tuite, Jennifer Walker, Tania Watts, Ashini Weerasinghe, Scott Weese, Xiaolin Wei,
Jianhong Wu, Diana Yan, Emre Yurga

* Chairs of Scientific Advisory, Evidence Synthesis, and Modelling Consensus Tables
For table membership and profiles, please visit the About and Partners pages on the Science
Advisory Table website.

                                                                                                       19
You can also read