Canadian National Report 10th Meeting of WMO/UNEP Ozone Research Managers - Sum Chi Lee Air Quality Research Division Science and Technology ...
←
→
Page content transcription
If your browser does not render page correctly, please read the page content below
Canadian National Report
10th Meeting of WMO/UNEP
Ozone Research Managers
     Sum Chi Lee
     Air Quality Research Division
     Science and Technology Branch
     Environment and Climate Change Canada

     March 28 – 30, 2017, Geneva Switzerland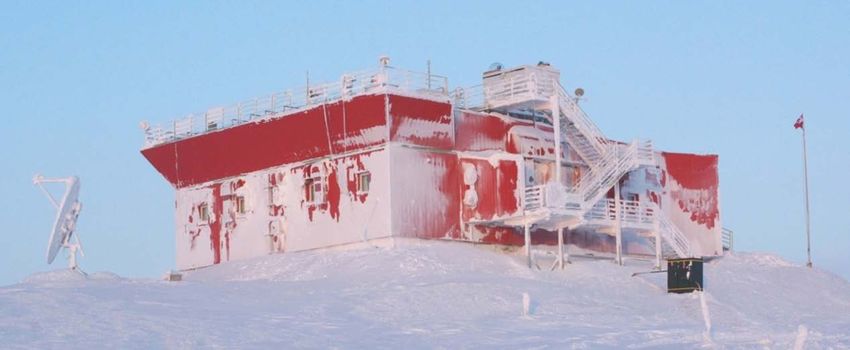
Outline

•   Current state of ozone and UV monitoring in Canada
•   Products and applications
•   WMO WOUDC
•   Research activities
•   International engagement
•   Future plans
•   Concluding remarks

                                Page 2 – March-25-17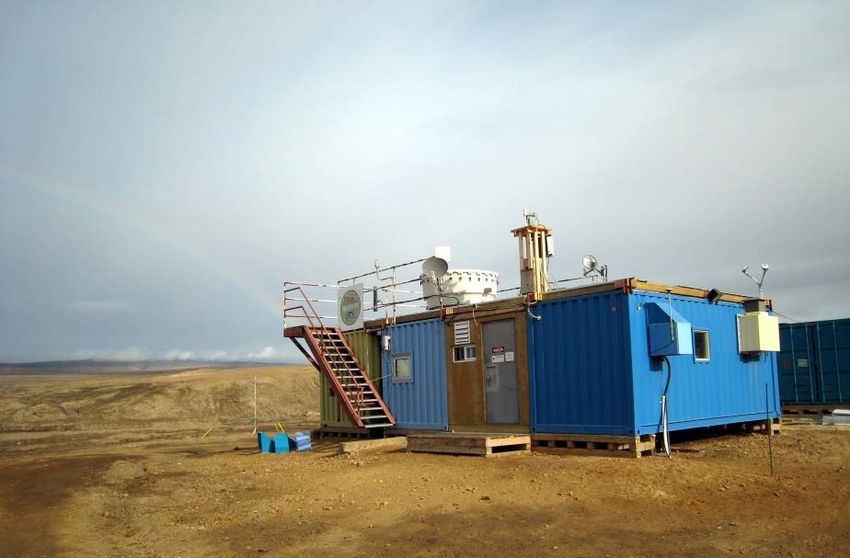
Canada’s ozone and UV monitoring program
                                                               Alert
                                                                                                                 Brewers
                                                         Eureka                                                  • Total column ozone and
                                                                                                                      spectral UV; 8 sites with 2+
                                                                                                                      instruments, and one site
                                                                                                                      each in Hawaii (Mauna Loa)
                                                      Resolute Bay                                                    and Antarctica (South Pole);
                                                                                                                      42 instruments total
                                                                                                                      including 10 double Brewers

                                                                               Iqaluit
                                                                                                                 Ozonesondes
                                   Yellowknife
                                                                                                                 • Ozone profiles; weekly
                                                                                                                      launches; 8 sites

                                     Oil Sands          Churchill                                  Goose Bay
                                                                                                                 AEROCAN – Canadian part
                                                                           Kuujjuarapik
                               Edmonton                                                                          of AERONET
                        P P
                                           Waskesiu                                                              • Total column aerosol optical
               Kelowna
   P                                                         Pickle Lake             Chapais                          depth (AOD); 19 stations
       Saturna Island         Lethbridge                                                              Halifax

Pandora        Brewer
                                                                               Egbert
                                                                                          CARTEL   Yarmouth
                                                                                                                 Pandora spectrometers
In-situ          Ozonesonde                                                P
                                                                                   Downsview                     • Total column ozone, NO2,
       AEROCAN                   P - planned
                                                                                                                      SO2; 6 instruments

                                                                                               Page 3 – March-25-17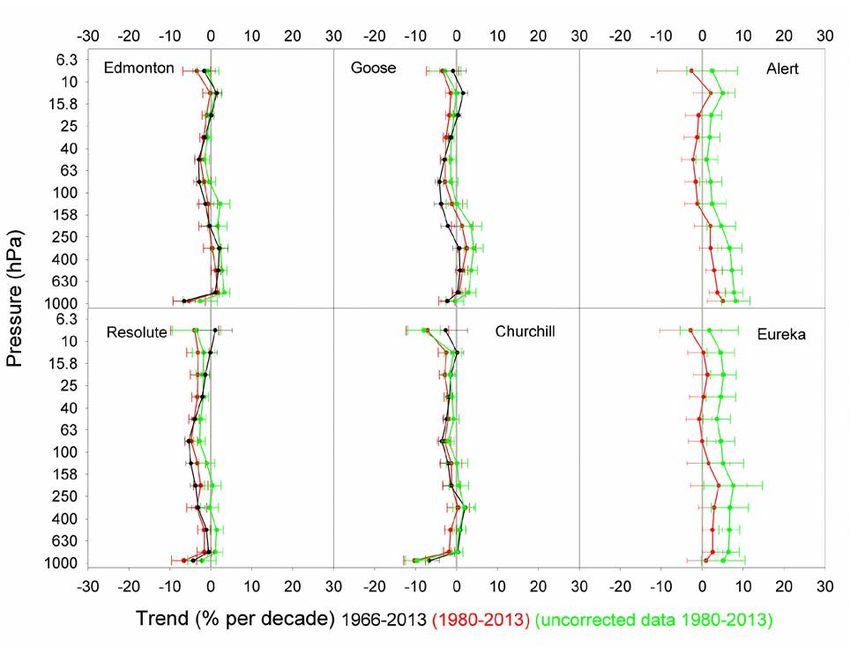
Brewer applications
• Real-time processed Brewer ozone and UV data
Produce hourly bulletins for UV Index forecasts
Used for satellite data validation
Used in WMO Antarctic Ozone Bulletins
• Brewer data used in NOAA Arctic Report Cards, BAMS
State of the Climate reports, and other publications
• Brewer UV data used for evaluation of new ECCC UV
Index forecast
Page 4 – March-25-17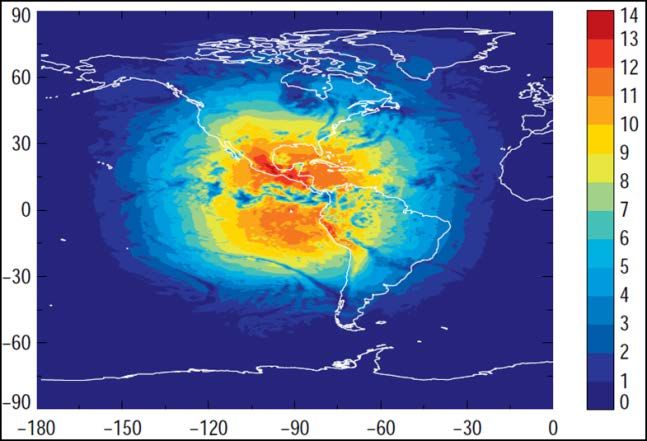
Near real-time monitoring

                          WMO Antarctic Ozone Bulletin No. 5/2015

                     Page 5 – March-25-17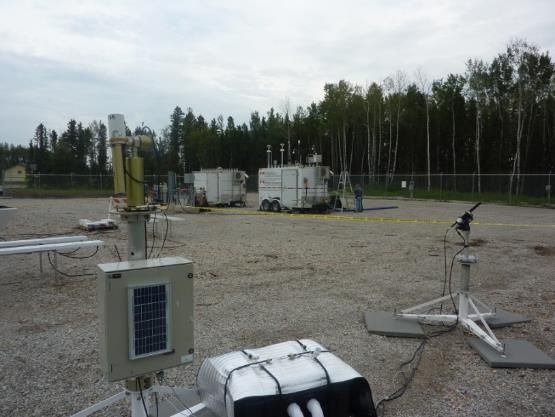
Real-time ozone maps

                       Page 6 – March-25-17
Re-evaluating the ozonesonde record

Tropospheric changes: increases of up to 5% after 1979; up to 20% before
   1980 (Brewer-Mast sondes), reducing with altitude.
Stratospheric changes: decreases of up to 4% before 1980 at 25 km, smaller
   decreases above and below. Increases of ~1% in 1980s, ~2-3% in 1990s;
   little change in 2000s.
                                         Page 7 – March-25-17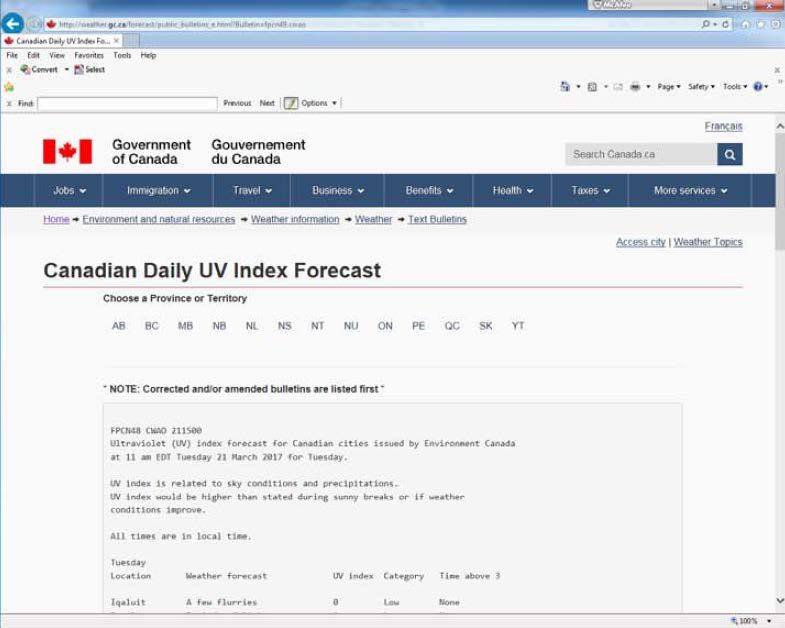
WMO WOUDC

            Page 8 – March-25-17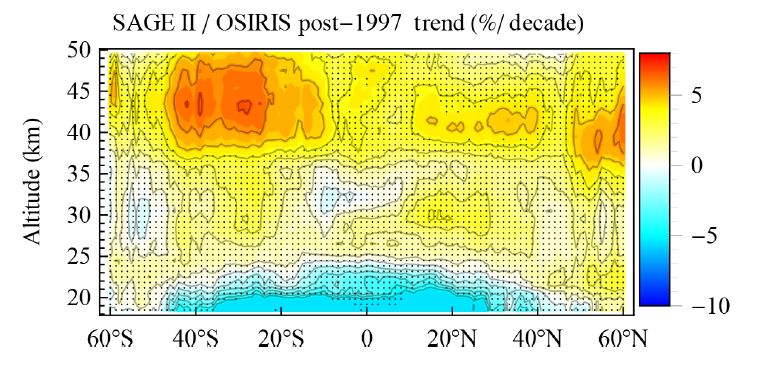
WMO WOUDC: Key enhancements

•   Near real-time data
•   Validation services (formats, QA)
•   Self-serve metrics/reporting
•   New dataset: RocketSonde
•   NetCDF data delivery
•   Integrated distributed Data Centre search (NDACC,
    EUBrewNet)
•   Level 0 data archive
•   Standards (ISO, OGC)
•   Geospatial capabilities
•   WMO alignment (WIS, WIGOS)

                                   Page 9 – March-25-17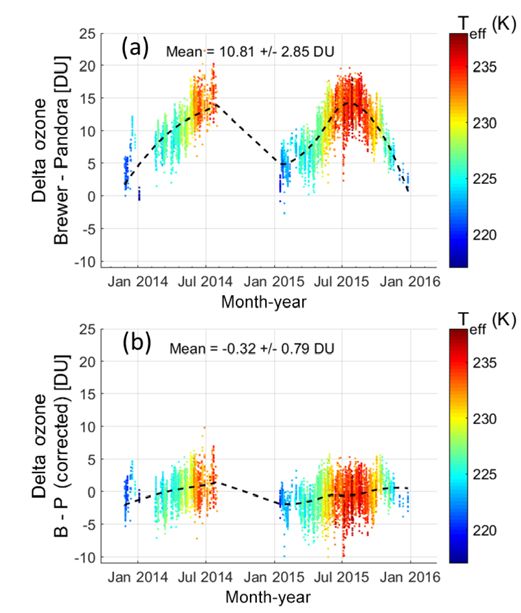
WMO WOUDC: Data updates (Mar. 2017)

                                                                     Change
                                Temporal          Number of
Dataset            Platforms                                        since May
                                 Range              Files
                                                                       2014

Total Column   303             1926-2017        ~76000             5%
(Daily)
Total Column   28              1984-2017        ~82000             16%
(Hourly)
Lidar          2               1991-1998        ~700               None
RocketSonde 12                 1965-1994        ~200               NA
OzoneSonde     146             1962-2017        ~85000             8%
Umkehr         65              1951-2017        ~11000             9%

                                           Page 10 – March-25-17
Research activities
• Pandora spectrometer and Brewer Triad
• UV index prediction project
• Canadian Middle Atmosphere Model (CMAM)
simulations
• OSIRIS and ACE
• Polar Environment Atmospheric Research Laboratory at
Eureka (CANDAC)
Page 11 – March-25-17Pandora spectrometer
MAX-DOAS Direct Sun
• Sun and sky spectrometer – measures solar spectra
• Measurement modes:
– Direct Sun
– Sky (scattered) light – MAX-DOAS
– Direct Moon
• Designed for satellite validation and pollution monitoring
• Similar to Brewer spectrophotometer (commands, schedules)
• Automated, established algorithms, data available in real time
• Specifications:
Fort McKay, Alberta
– Czerny-Turner spectrometer
– 270-530 nm at 0.5 nm resolution,
–Pandora spectrometer and Brewer Triad
Percentage difference between Pandoras (#103
and #104) and Brewer single and double triads
(BrT and BrT-D) as a function of ozone air mass
factor. On each box, the central mark is the
median, the edges of the box are the 25th and
Time series of Brewer #014 – Pandora #103 75th percentiles, and the whiskers extend to the
total ozone difference colour-coded by ozone most extreme data points not considered outliers.
effective temperature : (a) before applying the
temperature dependence correction and (b) Zhao et al., AMT, 2016
after applying the correction.
Page 13 – March-25-17UV Index forecast by Meteorological Services
of Canada in ECCC
• Environment and Climate
Change Canada (ECCC)
currently provides 1-day
forecasts consisting of the
midday UV index accounting
for average cloud conditions
from 10 am to 4 pm for over
900 locations in Canada
• UV Index forecast is available
in weather reports on
Canada.ca/weather, and
daily UV Index Forecast
bulletins
Page 14 – March-25-17New UV index forecasts
Sample UVI forecast
map for 18 UTC
• Make direct use of
ozone model forecasts (LINOZ) at NWP resolution
satellite measurements of ozone through data assimilation
solar UV fluxes at the surface provided by the GEM weather
forecast model to calculate clear-sky and all-sky UV indices
• Will make available new UV index forecast products, e.g.,
daily max
daytime variation
longer forecasts (e.g. 4 days or more)
global, continental and regional maps
• Offers a UV index forecasting package tightly integrated to the
current weather forecasting system
• Goal: operational implementation in 2018-2019
Page 15 – March-25-17Multi-sensor stratospheric ozone
assimilation
• As part of a new UV index forecasting and interactive ozone-radiation
project, a multi-sensor ozone assimilation project with total column bias
correction was undertaken
• Assimilated data sets: OMI, GOME2 of MetOp A&B, and OMPS-NM total
column ozone retrieved from the TOMS algorithm and OMPS-NP and
SBUV/2 partial column profiles.
• Selected standard: OMI with validation using Brewers
• Study to be completed in 2017
Sample figure: Mean differences between (a) GOME-2A (b) GOME-2B and
OMI-TOMS for the period of July and August 2014
Solar zenith angle Solar zenith angle
Page 16 – March-25-17UV index monitoring and forecasting during
the 2015 Pan Am and Para-Pan Am Games
• Summer Games in southern Ontario in July-August
2015 Sample
• New UV index forecasts and real-time UV index sensor
report
measurements were made available through a
decision-support portal for public health units and
Ontario UV stakeholder in the Games region
• Four UV sensors from Kipp & Zonen provided
diurnal monitoring during the Games in
addition to the available BrewersCanadian Middle Atmosphere Model (CMAM)
simulations for CCMI
• Chemistry Climate Model Initiative (CCMI) providing new CCM
simulations for the 2018 Scientific Assessment
– improved representation of tropospheric chemistry
• Increased focus on future GHG scenarios
– future evolution of total column heavily dependent on future CO2
▪ stratospheric cooling, Brewer-Dobson circulation
– large increase in methane for RCP8.5 also has large impact on
ozone in troposphere and lower stratosphere
Page 18 – March-25-17OSIRIS
• OSIRIS (Optical Spectrograph and Infrared Imager System), a Canadian
instrument on Odin satellite since 2001, measures spectra of limb scattered
sunlight from the ultraviolet to the near-infrared that are primarily used to
retrieve ozone, NO2 and aerosol extinction.
– Current PI: Prof. Doug Degenstein, University of Saskatchewan
• The instrument has 2-km vertical resolution and good accuracy and long-
term stability with respect to altitude registration.
The stratospheric ozone
trend is determined using a
linear regression model that
accounts for other major
sources of ozone variability.
Bourassa et al. 2014
Page 19 – March-25-17SCISAT / ACE
• The Atmospheric Chemistry Experiment (ACE) satellite mission consists of
an infrared Fourier Transform Spectrometer (ACE-FTS) and a UV-VIS-NIR
grating spectrometer (MAESTRO) that have been measuring continuously
since February 2004 (13 year data set) from the SCISAT platform
– MAESTRO provides O3, NO2 and H2O
– ACE-FTS measures more than 30 different species and nearly 20
isotopologues – including O3, CFCs, HFCs, HCl, ClONO2, N2O, NOy…
• Solar occultation technique used by ACE provides excellent long-term
precision and accuracy for the measurement time series
Recent validation
comparisons for ozone
time series show higher
correlation and small
bias for ACE-FTS.
Sheese et al. 2017
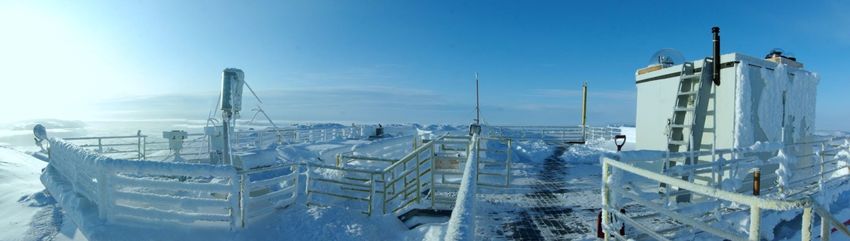
Page 20 – March-25-17Polar Environment Atmospheric
Research Laboratory (PEARL)
• Located in Eureka, Nunavut, Canada (80N, 86W)
on three sites Zero-altitude PEARL Auxiliary
• Operating since 2005 with ~25 instruments Laboratory (OPAL)
• Goal of measurements is to characterize the Arctic
atmosphere from ground level to 100 km as
thoroughly as possible.
• Supported by ECCC, NSERC and CSA
.
Surface and Atmospheric
Flux, Irradiance and Radiation
Extension (SAFIRE)
PEARL Ridge Laboratory
Photos courtesy of Pierre Fogal Photos
Page 21 –courtesy of Paul Loewen
March-25-17International engagement
• Support WMO capacity building initiative with Brewer Trust Fund –
Renewed for 2015-2020 (CAN$37,500 per year)
• Maintain WMO Brewer World Calibration Centre
• Maintain and provide the global Brewer travelling standard to WMO
• Operate WMO World Ozone and Ultraviolet Data Centre
(www.woudc.org)
• Provide experts to GAW Ozone and UV SAGs, and Expert Team on
World Data Centres
• Contribute to 2018 UNEP/WMO Scientific Assessment of Ozone
Depletion
Page 22 – March-25-17Satellite validation activities (TROPOMI,
TEMPO):
• Validation of NO2, SO2, HCHO, and perhaps other species using new
Pandora instruments that assure the quality of satellite data over
Canada
• Validation of ozone and UV index products using the Brewer network as
well as ECCC ozone data assimilation output and UV index forecasts
• Validation of ozone profiles using ozonesonde measurements from
Canadian stations to ensure satellite tropospheric ozone measurements
are suitable for ECCC Air Quality Health Index (AQHI) applications
(assimilation, validation, research, trend studies, etc.)
• Validation of AOD data products using Canadian AERONET
measurements and possibly ECCC aerosol data assimilation output
from the AQHI forecasting system
Page 23 – March-25-17The ECCC Remote Sensing Network
(present and near future)
Alert
Brewers
Eureka • Total column ozone and
spectral UV; 8 sites with 2+
instruments, and one site
each in Hawaii (Mauna Loa)
Resolute Bay and Antarctica (South Pole);
42 instruments total
including 10 double Brewers
Iqaluit
Ozonesondes
Yellowknife
• Ozone profiles; weekly
launches; 8 sites
Oil Sands Churchill Goose Bay
AEROCAN – Canadian part
Kuujjuarapik
Edmonton of AERONET
P P
Waskesiu • Total column aerosol optical
Kelowna
P Pickle Lake Chapais depth (AOD); 19 stations
Saturna Island Lethbridge Halifax
Pandora Brewer
Egbert
CARTEL Yarmouth
Pandora spectrometers
In-situ Ozonesonde P
Downsview • Total column ozone, NO2,
AEROCAN P - planned
SO2; 6 instruments
Page 24 – March-25-17Concluding remarks
• Systematic observations are ongoing, especially ground-based sites
with long records and in the Arctic region. All Dobson/Brewer and
ozonesonde sites opened in the 1950s and 1960s are operational.
• Near real-time data are available and new real-time products can be
created when the necessary data and resources are available.
• Pandora total column ozone seems promising when compared with
Brewer spectrophotometer.
• New UV Index forecast system based on ozone data assimilation is
being tested and evaluated, with its implementation in the near
future.
• Modelling studies are ongoing to improve understanding of the
relationship between ozone and climate.
• Although Odin/OSIRIS and SCISAT/ACE are beyond their design
life, they continue to operate successfully.
Page 25 – March-25-17You can also read