ESTIMATION OF SHOULDER WIDTH AND NECK GIRTH BASED ON 3D POINT CLOUD DATA
←
→
Page content transcription
If your browser does not render page correctly, please read the page content below
ESTIMATION OF SHOULDER WIDTH AND NECK GIRTH BASED ON
                 3D POINT CLOUD DATA
                                               by
                               Xin LU1, Panpan GUO2, Guolian LIU2*

  1
  School of Textile Garment and Design, Changshu Institute of Technology, Suzhou, 215500, China
    2
      College of Textile and Clothing Engineering, Soochow University, Suzhou, 215325, China
                                *Corresponding author; liuguolian@suda.edu.cn

              Three dimensional point cloud map in the anthropometry has
              attracted intensive attention due to the availability of fast and
              accurate laser scan devices. Inevitably, there is a data deviation
              between 3D measurement and manual tests. To address this problem,
              shoulder width and neck girth are accurately determined from 3D
              point cloud, the two-scale fractal is used for 3D point cloud
              simplification, and young female samples are used in our experiment
              to show the accuracy.

              Key words: 3D point cloud; Shoulder width; Neck circumference; Fitting
              method, two-scale method

1. Introduction
           As an important measurement method, the three-dimensional (3D) anthropometry is widely
used to provide a basic body morphology for the garment design. During the measuring procedure, the
point cloud is deemed as the most emblematic representation due to its comprehensive and intuitive
information. The accurate and reliable data from the point cloud not only contribute to the morphological
analysis and geometric measurement of body model, but also make up the drawback of conventional
contact anthropometry [1-4].
           With these obvious advantages of convenience, accuracy and speedy, a series of researches on
the reliability of 3D anthropometry were carried out. In Ref.[1], the consistency analysis on 17 groups
of body parts were compared among Image Twin test, Cyberware test and SYMCAD test. The
significant data deviation at the same body part was found since that these three methods had different
definitions and anchor points on the same measurement terms. Comparative dimension analysis of 14
body parts showed that most of body girth from 3D measurement were larger than those manual data
[2], which resulted from the low accuracy of the instrument algorithm and the different original
somatotype models used by instrument algorithm. Ren[3] aslo analyzed 29 morphological indicator data
from 174 groups of people (74 men and 100 women) to see if the manual method and 3D measurement
were consistent. Results showed that 14 morphological indicators were relatively consistent, with an
error of less than 3%. The difference rates of iliac width, chest width and chest thickness were more than
10%. The error rates of other 12 morphological indexes were between 3% and 10%. In our previous
report, 50 groups of young female body dimensions were measured with manual measure, 2D non-
contact test method and 3D body scanner, respectively[4]. Compared with 3D test, the data error
between 2D measure results and manual measurement data is smaller, which attributes to the
changing body postures during the measure process, the precise location of manual measure tape and
basic data setting for non-contact measuring methods.
           Based on these analyses, the data deviation poses a significant obstacle in the application of
3D body scanners, especially for important body parts that are difficult to be determined. For example,
the neck girth and shoulder width are both critical garment components and design points, which directly
affect the overall garment style. However, the obvious difference is often detected in the manual test
process. It is essential to combine 3D anthropometry with manual test to reduce data error through data
correlation analysis and regression fitting analysis.
           In this paper, the feature points of shoulder width and neck girth are extracted from 3D point
clouds of young female. With the data processing, simulation algorithms of these two parts are
established to provide accuarte dimensions.
2. Experimental design
250 groups of young female aged from 19 to 26, with a height from 150 to 178cm and a weight
from 40 to 70 kg were selected as the measurement objects. The experiment conditions were setted as
follows: T=25+2℃, RH=65+ 5%, Soochow University.
The manual measure method was carried out according to the National Standard of the
People's Republic of China GB/T 1660-1996. The main measuring tools are soft ruler, goniometer,
altimeter, rangefinder and sliding gauge.
3D body scanner (Symcad, German) were used to automatically measure body dimensions
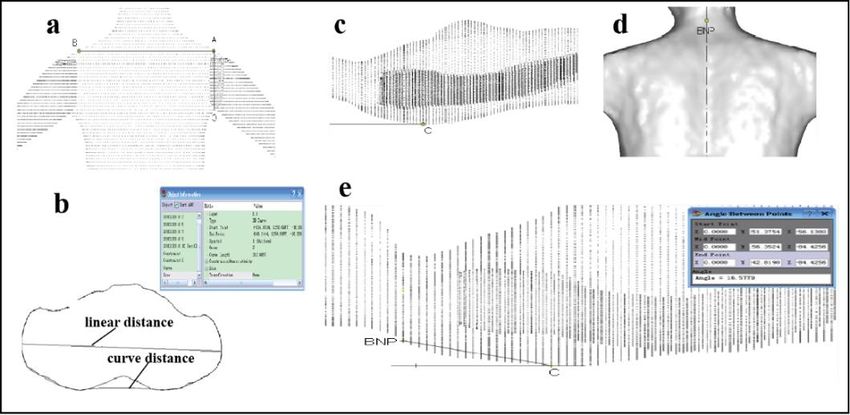
without contact and the effect of human movement. The required measurement posture was shown in
Figure 1(a). Participants were asked to wear light-colored tights and swimming cap to cover their hair.
Also accessories must be removed to assure the photo and scanning effect.
Scattered cloud data extracted from 3D scanner were converted into TXT format for treatment.
The virtual 3D coordinate system was generated in Figure 1(b-d). These 3D point cloud map can be
dragged freely from any direction to make the observation and measurement process clear and
comprehensive.
Figure 1. (a) The required measurement posture; (b) front view; (c) side view (d) top view
3. Determination of shoulder width and neck girth eigenvalues
Before measuring the shoulder width, the position of two shoulder endpoints should be
determined first. According to our previous report [4], the junction connecting right torso and the lowest
arm edge was founded as underarm point O in Figure 2(a). The location of shoulder endpoint A was
obtained by intersecting the vertical line through point O and the shoulder edge. While the location of
left shoulder endpoint B was determined by intersecting the horizontal line crossing point A and the
shoulder edge.
Straight-line distance connecting two shoulder endpoints and the curve distance along the
human body surface are typical eigenvalues of shoulder width. After the determination of two shoulder
endpoints, the linear distance and curve distance are directly measured in Figure 2(b). The linear distance
is the straight line length between right endpoint A and left endpoint B. The curve distance was fitted
with 3D B-spline tool to match the human shoulder curve.
The back enter angle is another typical eigenvalue of shoulder width, which is used as a
criterion to classify body shapes. The larger back enter angle, the more prominent back protrusion. The
determination process of back enter angle was given as follows: Two feature points involved the most
prominent point C on the back (Figure 2(c)) and the posterior cervical point BNP (Figure 2(d)) also need
to be determined before eigenvalue extraction. Located at the tip of the spinous process of the seventh
cervical vertebra of human body, BNP is the most prominent cervical vertebra point of posterior neck.
From Figure 2(e), the back enter angle was formed by intersecting vertical line through point C and the
diagonal connecting point C and point BNP.
Neck circumference is the cervical girth at the lower margin point of the thyroid cartilageprojection known as the Adam's apple. Compared with male, Adam's apple of female is not prominent.
To make the Adam's apple more obvious, participants are required to keep head up and eyes
looking straight ahead.
Determination process of left endpoint D and right endpoint E was shown in Figure 3(a) and
(b). Zoom in 3D point cloud, the prominent point at the middle of the neck is the Adam's apple point.
The lower edge point of the Adam's apple was taken as origin point, and the arrow direction along Z
axis was moved to make it basically consistent with the line on the neck surface. The neck girth section
can be obtained until the straight line in Y direction is basically perpendicular to the neck part. Then, the
left and right endpoints (D and E) were determined.
Three characteristic values involved neck width, neck thickness and neck girth were measured
in the neck section. Neck width is the straight line distance between the left and right endpoints (D and
E) in the elevation view. While the neck thickness refers to the straight line distance between the top
and bottom endpoints (F and G) in the elevation view. The straight line connecting two points D and E
is perpendicular to the straight line crossinging two points F and G. Extraction process of characteristic
values of neck girth was shown in Figure 3(c).
Figure 2. (a) Shoulder endpoints; (b) Fitting process of shoulder width eigenvalues; Back enter
angle: (c) Point C; (d) Point BNP; (e) Measure process of the back enter angle
Figure 3 (a) and (b) Characteristic points around the neck; (c) Neck girth
4. Fitting method of shoulder width and neck circumference
The back enter angle is used as classified norm to describe shoulder width. The maximum
value 29.7 and minimum value 9.4 were found out from 250 sets of back enter angles. All the data
was graded by trisection the difference between 29.7 and 9.4. From Table 1, the number of people in the
first and third grade was smaller, while that of the second gear is the largest. The number of second
grears accounted for nearly 70%, representing most shoulder features.
Table 1 Range difference of each grade and the corresponding proportion of people
Subject First gear Second gear Thrid gear Total
range difference 9.4-11.6 16.2-22.9 23-29.7 9.4-29.7The number of people 30 174 46 250
proportion /% 12 69.6 18.4 100
Based on the distribution model of shoulder shapes, correlation analysis were listed in Table
2. The correlation coefficients between linear distance and curve distance were 0.919, 0.819 and 0.797
for these three grades, respectively. Results of two-tailed test were lower than 0.01 for all these grades,
meaning significantly positive relationship between these two parameters. The curve width increased
with the increase of straight width. These associations appeared to be strongest in first gear due to the
highest correlation coefficient 0.919. The smaller back enter angles, the more obvious their positive
correlation.
The linear regression model was used to establish the optimum fitting formula between curve
shoulder width and straight shoulder width. From Table 2, the significance levels for all regression
coefficients (all p=0.000) and regression constants (first gear, p=0.002; second gear, p=0.007; third gear,
p=0.003) were lower than 0.01, indicating credible fitting results. Linear regression fitting formula
between curve distance and linear straight distance were established.
First gear : Y1=-138.310+1.653X1 (1)
Second gear : Y2=26.961+1.129X2 (2)
Third gear : Y3=65.612+0.997X3 (3)
Where, X1, X2 and X3 were the linear straight distance in these three gears, respectively, while Y1, Y2
and Y3 were the corresponding curve distance, respectively.
Table 2 Correlation and regression analysis between curve distance and linear distance
Gear Non-standardized coefficient Standardized T value Two-tailed
coefficient test
B Std. Error Beta P
First (constant) -138.310 40.962 -3.377 0.002
linear distance 1.653 0.134 0.919 12.312 0.000
Second (constant) 26.961 18.495 1.458 0.007
linear distance 1.129 0.060 0.819 18.672 0.000
(constant) 65.612 34.462 1.904 0.003
Third linear distance 0.997 0.114 0.797 8.749 0.000
Note: dependent variable:Curve distance
Manual measure method was used to test the reliability and accuracy of fitting formula of
shoulder width. 250 groups of straight shoulder width measured with 3D measurement were inputted
into the above prediction formula to obtain predicted value of curve shoulder width. The predicted curve
shoulder width was compared with those manual test values. The data deviation between these two
results was verified through independent sample T-test. From Table 3, the fitting shoulder width was
close to the manual value due to small mean difference 0.0399cm.Moreover, there was
no significant difference in shoulder width between two groups (p=0.802> 0.05), indicating the
excellent applicability and accuracy.
Table 3 Independent sample T-test of shoulder width from fitted and manual measure
Method Mean Mean Standard error T Sig.(Two-tailed test)
value difference p
Fitted value 38.081 0.0399 0.159 -0.25 0.802
Manual value 38.12
To reduce the individual difference among different neck section shapes, the ratio of neck
width and neck thickness was selected as classification standard to describe neck girth features. The
ratio of neck width and neck thickness from 250 groups of human body was calculated. All ratio data
was graded by trisection the difference between the maximum value 1.53 and the minimum value 0.92.
From Table 4, the number of people in the second gears was the largest, while the number of the thirdgear was the smallest. The people number in the first gear and second grear accounted for 93.6%,
representing most neck features.
Table 4 Range difference of each grade and the corresponding proportion of people
Subject First gear Second gear Thrid gear Total
range difference 0.92-1.11 1.12-1.32 1.33-1.53 0.92-1.53
The number of people 92 142 16 250
proportion /% 36.8 56.8 6.4 100
From Table 5, the correlation coefficients between neck width and neck girth was 0.880, 0.859
and 0.869 for these three grades, respectively ; while those between neck thickness and neck girth were
0.895, 0.878 and 0.816, respectively. Two-tailed test values were all lower than 0.01, meaning significant
positive correlation between neck width or neck thickness and neck girth. The neck girth increased as
the increase of neck width or neck thickness. Associations appeared to be strongest in the first gear due
to the highest correlation coefficient. For the neck thickness and neck girth, the smaller the ratio of neck
width and neck thickness, the more obvious their positive correlation. For the neck width and neck girth,
their positive correlation was firstly stronger then weakened as the increase of the ratio of neck width
and neck thickness.
Table 5 Correlation relationship between neck girth and neck thickness or neck width
Gear Neck width Neck thickness
correlation two-tailed correlation two-tailed
coefficient test coefficient test
First Neck girth 0.880** 0.000 0.895** 0.000
Second Neck girth 0.859** 0.000 0.878** 0.000
Third Neck girth 0.869** 0.000 0.816** 0.000
** the correlation coefficient level at 0.01 (two sides)
The linear regression model was used to establish the optimum fitting formula between neck
girth and neck width or neck girth.From Table 6, the fitting results were credible due to the high
correlation coefficient 0.956, 0.938 and 0.887 for these three grades.Linear regression fitting formula
between neck girth and neck width or neck thickness were established.
First gear : Y1=-22.171+1.578X1+1.763X2 (4)
Second gear : Y2=-7.984+1.547X1+1.651X2 (5)
Third gear : Y3=52.119+1.636X1+0.811X2 (6)
Where, X1 and X2 were the neck width and neck thickness in these three gears, respectively, while Y1,
Y2 and Y3 were the corresponding neck girth, respectively.
Table 6 Regression analysis between the neck girth and neck width or neck thickness
Non-standardized Standardized
correlation
Gear coefficient coefficient T value
coefficient
B Std. Error Beta
(constant) -22.171 11.584 -1.914
First NW 1.578 0.144 0.489 10.930 0.956
NT 1.763 0.145 0.542 12.126
(constant) -7.984 10.779 -0.741
Second NW 1.547 0.137 0.474 11.289 0.938
NT 1.651 0.129 0.538 12.809
(constant) 52.119 39.138 1.330
Third NW 1.636 0.603 0.614 2.714 0.887
NT 0.811 0.593 0.310 1.358
Manual measurement method was also used to test the reliability and accuracy of fitting
formula of neck girth. 250 dimensional groups of neck width and neck thickness measured with 3Dmeasurement were inputted into the above prediction formula to obtain the predicted neck girth. The
predicted neck girth were compared with those manual values. The difference between these two results
was verified through independent sample T-test. From Table 7, the fitting value of neck girth was close
to the mean value from manual measurement due to the small mean difference 0.11cm. Furthermore,
there was no significant difference in shoulder width level between two groups (0.479>0.05), showing
the the applicability and accuracy.
Table 7 Independent sample T-test of neck girth from fitted and manual measurement
Method Mean Mean Standard error T Sig.(Two-tailed test)
value difference
Fitted value 33.389 0.11 0.155 0.708 0.479
Manual value 33.279
5 Discussion and Conclusion
The neck girth is similar to the length of the well-known coastline, it depends upon the
measured scale, a smaller one always results a more accurate result. Shoaib et al. suggested the fractal
bubble algorithm for simplification of 3D point cloud data[6], however, it is critical to fast determine
the neck girth according to the given accuracy. The two-scale fractal[7,8,9] is an effective tool for this
purpose, that is we needed another scale to improve the accuracy, the approximate estimation discussed
above is based on a large scale, if we want to improve the accuracy, a smaller scale is needed to re-
analyze the cloud data.
In conclusion, the eigenvalue determine method of shoulder width and neck girth was
analyzed according to 3D point cloud map of young female body. The back enter angle and the ration
of neck width and neck thickness were confirmed as standard parameters to classify body shapes. All
the data from 3D measurement method can be interpreted with regression fitting formula, combining
with an outstanding consistency with those data from manual measurement method. Moreover, this
comprehensive research method is easy to be extanded into dimension extraction of other female body
part, even into the dimension extraction of male body.
Acknowledgments
The authors are grateful for the financial support of this research by “Key project of Natural
Science Foundation of Liaoning Province” (No.20170540403)
References
[1] Karla, P.S., et al., Body measurement techniques: Comparing 3D body-scanning and a thropometric
methods for apparel applications, Journal of Fashion Marketing and Management, (7) 2001, pp.
306-332.
[2] Hyunsook, H., et al., Comparative analysis of 3D body scan measurements and manual
measurements of size Korea adult females, International Journal of Industrial Ergonomics, 40(5)
2010, pp. 530-540.
[3] Ren, H., et al., Application of 3D body scan technique to the measurement and evaluation in sports
science, Journal of Beijing Sports University, 36(1) 2013, pp.51-54. (In Chinese)
[4] Guo, P.P., et al., Reliability analysis of anthropometric data based on young female body, Journal of
Beijing Institute of Clothing Technology, 35(2) 2015, pp.35-40. (In Chinese)
[5] Wu, W.G., Application of clothing standards, Beijing Publishing House, 2002, pp.106 (In Chinese)
[6] Shoaib, M., et al. Fractal bubble algorithm for simplification of 3D point cloud data, Journal of
Intelligent & Fuzzy Systems, 37(2019), 6, pp. 7815-7830
[7] Ain, Q.T., He, J.H. On two-scale dimension and its application, Thermal Science, 23(2019), 3B, pp.
1707-1712
[8] He, J.H., Ji, F.Y. Two-scale mathematics and fractional calculus for thermodynamics, Therm. Sci.,
23(2019), 4, pp. 2131-2133
[9] He, J.H., Ain, Q.T. New promises and future challenges of fractal calculus: from two-scale
Thermodynamics to fractal variational principle, Thermal Science, 24(2020), 2A, pp. 659-681Received : March 11, 2020 Revised: June 13, 2020 Accepted: June 13, 2020
You can also read