Social Structure of Bilawal Village in Badhra Block of Haryana: A Geographical Analysis - IJEDR
←
→
Page content transcription
If your browser does not render page correctly, please read the page content below
© 2018 IJEDR | Volume 6, Issue 1 | ISSN: 2321-9939
Social Structure of Bilawal Village in Badhra Block
of Haryana: A Geographical Analysis
¹Priyanka, ²Megha
¹M.Phil. Geography student, School of Earth Sciences, Banasthali Vidyapith.
²M.Phil. Economics,Department of Economics ,Banasthali Vidyapith.
________________________________________________________________________________________________________
Abstract- There is a considerable lack of micro level studies in today's world. More than half of India's population lives in
villages, which are mainly dependent on agriculture. There are many problems faced by the people living in rural areas, in
which problem of availability of water, electricity, unemployment and health are major problems. Government
periodically applies several policies to increase the level of employment in rural areas and to advance India towards the
path of progress. The type of study presents a detailed account of the problems of living in rural areas, such studies in
India are needed a lot so that proper planning can be encouraged in small areas too. The present paper includes the study
of Bilawal village, Badhra Block, Haryana, to examine the impact of natural environment on social status of the people in
the area. The study conducted includes the use of questionnaire and interview for the collection of data. The study uses the
Arc GIS 10.2 software for the Preparation of map and further statistical tools for data presentation. The analysis reflects
that people in Bilawal are moving towards the secondary activities for employment and scenario is improving with the
time.
Keywords: Agriculture, Social Status, Employment, Development, Planning
________________________________________________________________________________________________________
INTRODUCTION
Socio-economic survey is one of the most important aspects of the detailed study of any area/region. It is also important in order
to get more authentic and reliable information in relation to socio economic condition, because they vary from region to region. It
helps to understand the problem of the village such as agricultural landscape, cropping pattern, educational development,
population structure, occupational status, health care etc. To analyze all these aspects of village, field work is most important as
the data published by different sources may not be adequate for various geographical studies. So, we have analysed the social
aspects of the village ‘Bilawal’ which falls in Block ‘Badhra’ of Charkhi Dadri district. We have carried out the survey for
various aspects such as, agricultural landscape, cropping pattern, transport facilities, basic amenities, population structure,
educational development and economic and occupational status.
OBJECTIVES
Keeping all these aspects in mind, an attempt has been made to examine the social conditions of the Bilawal village, Charkhi
Dadri, Haryana. The main objectives of the study are:-
1. To assess the living conditions - housing, water supply, sanitation condition etc.
2. To examine the social conditions - Age structure, religion, educational structure etc.
3. To examine the area by Geological and Geographical point of view.
STUDY AREA
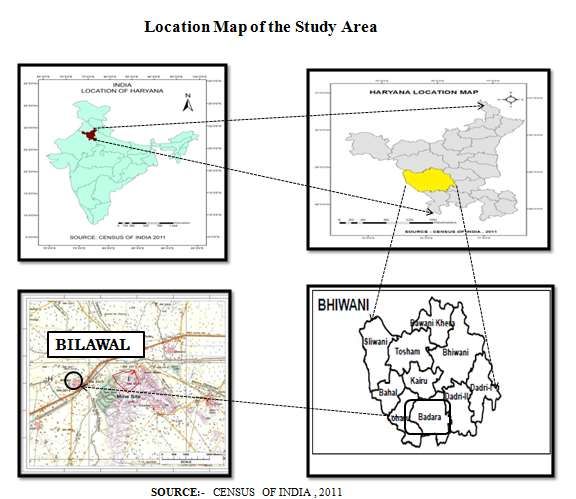
Bilawal, a small village of Haryana lies between 28˚34 ̍28.92 ̎ to 28˚34 ̍37.01 ̎ N latitude to 76 ˚ 4 ̍ 27.86 ̎ E to 76˚ 4 ̍ 40.4 E ̎
longitudes covering an area of 896 hectares. It is located in Badhra block of Bhiwani which has 10 km distance from Bilawal. As
per 2011 census, the total population of the village is 2578, in which the female is 1211 and the male is 1367. The village derives
its name from the invitation (Bulana) extended to the people by a ruler to settle at the present site. In this village, there are many
Gotras: Beniwal Mahla, Janghu, Nagil, Rangi, Sangwan, Suhag, Singal, Bhatti,Khatak, Tanwar. Atela Khurd ( 3 KM ) , Atela
Naya ( 3 KM ) , Dohka Hariya ( 4 KM ) , Barsana ( 5 KM ) , Pichopa Kalan ( 5 KM ) are the nearby Villages to Bilawal. Bilawal
is surrounded by Badhra Tehsil towards west, Kairu Tehsil towards west, Dadri-I Tehsil towards East , Bhiwani Tehsil towards
North . Charkhi Dadri , Bhiwani , Mahendragarh , Pilani are the nearby Cities to Bilawal.
Figure1. Location Map of Bilawal
IJEDR1801132 International Journal of Engineering Development and Research (www.ijedr.org) 763
© 2018 IJEDR | Volume 6, Issue 1 | ISSN: 2321-9939

CLIMATIC CONDITIONS AND RAINFALL
There are four seasons in a year. The hot weather season starts from mid March to last week of the June followed by the south-
west monsoon which lasts upto September. The transition period from September to October forms the post-monsoon season. The
winter season starts late in November and remains upto first week of March. The average temperature in Bilawal Village is 24.2
°C. Precipitation here averages 468 mm.
                                        Table1. Population Structure of Bilawal Village

                                             Census Parameter                               Census Data
                                               Total Population                                 2578
                                            Total Male Population                               1367
                                           Total Female Population                              1211
                                             Total No. of Houses                                535
                                        Total Female Population in %                           47.0%
                                             Total Literacy Rate                              74.08%
                                            Female Literacy Rate                              61.28%
                                          Schedule Caste Population                             630
                                            Working Population %                               36.6%
                                            Child (0-6) Population                              286
                                          Girl Child (0-6) Population                           134
                                                Total Workers                                   943
                                                Male Worker                                     672
                                               Female Worker                                    271

 IJEDR1801132           International Journal of Engineering Development and Research (www.ijedr.org)                764
© 2018 IJEDR | Volume 6, Issue 1 | ISSN: 2321-9939
Main Worker 756
Marginal Worker 187
(Source: Census of India, 2011)
Table2. Connectivity of Bilawal Village
Type Status
Public Bus Service Available Within Village
Private Bus Service Available Within Village
Railway Station Available Within 10+ KM Distance
DATA BASE
The data is collected from primary as well as secondary sources.The primary sources of the study includes the survey of the study
area i.e. Bilawal village (Survey of households). Interview with the respondents on the basis of questionnaire has been held.
Sufficient care has been taken to prepare the questionnaire communicable to respondents. The data collected from secondary
sources includes various sources such as, various bulletins of offices, Gram Panchayat, Bilawal, Textbooks, Newspapers, Internet,
Census of India, 2011.
METHODOLOGY
The following methods have been used in the study:-
1. Questionnaire Method: - Questionnaire prepared consists of questions relating to the problems of the study like living
standard, housing condition, sanitation facilities, health problems, water availability etc.
2. Sampling: - Sampling is a process of selecting a sample from whole population .A Sample is true representation of the whole
population.
a) Selection of area- Bilawal village was selected based on its physiographic variability in form of presence of
morphological features like water fall in the nearby village, various rock types, relatively different socio-economic
condition etc.
b) Random sampling- A process of selecting sample in which every individuals has equal probability of being selected in
the sample. Selection of households is done through random sampling; 100 households (18.69% of total household) out
of 535 households were selected.
c) Personal Interview- A research method in which there is face to face interaction between the researcher and an
individuals.
Simple percentage has been calculated for easy understanding of the data. Either a male or female member from each household
was taken as respondents.
RESULTS AND DISCUSSION
The analysis of the area reflects different results for the living conditions and social conditions of people in Bilawal. The living
conditions and social conditions are observed using various indicators. The results for the analysis are-
1. Living Conditions
1.1 Types of houses
We observed the different kinds of houses at the study area i.e. Bilawal village and here we have observed a panoramic view of
three types of houses namely, Pucca house, Semi pucca house, Kutcha house. The housing condition of the sampled households is
presented in table with figures. The data reflects that major portion of the population resides in pucca houses and only a few
household are living in kutcha houses i.e. 13 percent only, whereas 29 percent people lives in semi pucca house.
Table3. Types of houses in Bilawal
Types Actual data Value in %
Kutcha House 13 13
Semi Pucca House 29 29
Pucca House 58 58
Total 100 100
IJEDR1801132 International Journal of Engineering Development and Research (www.ijedr.org) 765© 2018 IJEDR | Volume 6, Issue 1 | ISSN: 2321-9939
Figure2. Types of Houses in Bilawal
Types of Houses Present at Bilawal Village
13%
29% Kutcha
Pucca
58% Semi-Pucca
1.2 Drinking Water Supply
Table4 and Figure3 shows the water supply conditions in the sampled households. About 56 percent houses used Wells, 26
percent houses depend on other municipal tap water supply, and 18 percent houses depend upon the other sources of water. It
reflects that there is still significant number of population that does not use wells as one the water supply sources.
Table4. Sources of drinking water in Bilawal
Sources of Water In Number In Percentage
Wells 56 56%
Municipal tap water 26 26%
Others 18 18%
Total 100 100%
Figure3. Sources of drinking water in Bilawal
Sources of Drinking water
Wells
Municipal Tap Water
Others
1.3 Sanitation conditions
The sanitation conditions are not so satisfactory in Bilawal village. In Perspective of toilet facility out of 100 houses, 68 houses
have the facility of toilet, and 32 houses don’t have toilet facilities. There still exists a huge number of mass that still have the
open defecation.
Water logging is main problem, out of 100 houses 83 houses reported about water logging and 17 houses don’t have water
logging problem. It means that level of water logging is very high the area which is leading to the hindrances in activities of the
people, mainly the transportation activities are affecting very deeply.
Table5. Toilet/Bathroom and water logging facility in Bilawal
Toilet/ Bathroom facility Water logging
Yes 68 Yes 83
No 32 No 17
Total 100 Total 100
IJEDR1801132 International Journal of Engineering Development and Research (www.ijedr.org) 766© 2018 IJEDR | Volume 6, Issue 1 | ISSN: 2321-9939
Figure4. Toilet/Bathroom and water logging facility in Bilawal
Toilet/Bathroom Facilities Water Logging
17%
yes
32%
no
83%
68%
yes no
2. Social Condition
2.1 Age Structure
The Table6 and Figure7 shows the age structure in the sampled household .In this village out of the total population, 33.36
percent comes under 0-15 age group, 28.89 percent under 15-30 age group, 21.29 percent under 30-45 age group, 11.03 percent
under 45-60 age group and 5.43 percent under above 60. The dominating age-group in terms of female population is 0-15 where
30.53 percent of female population resides. Similarly in case of Male population, the dominating age group is 0-15 where 31.06
percent of male population resides.
Table6. Age Structure in Bilawal
Age group Males (in %tage) Females (in %tage) Total (in %tage)
0-15 31.06 30.53 33.36
15-30 26.69 29.73 28.89
30-45 25.32 22.06 21.29
45-60 10.97 10.72 11.03
Above 60 5.96 6.96 5.43
Total 100 100 100
Maximum population is covered by 0-15 age group.
Figure5. Age Structure in Bilawal
35
30
25
Figures in %
20
Male
15 Female
Total
10
5
0
0-15 15-30 30-45 45-60 60+
Age Group
2.2 Educational Structure
The Table7 and Figure8 present the educational structure in the sampled households. According to sampled population, only
52.58 percent of males and 43.94 percent of females are educated and rest 47.41 percent males and 56.05 percent females are
uneducated. However, out of the total population, 49.21% of population is educated and 50.78 percent of population is
uneducated. It shows that still majority of females are uneducated in this area; same as for the male population.
Table7. Educational Structure of Bilawal
IJEDR1801132 International Journal of Engineering Development and Research (www.ijedr.org) 767© 2018 IJEDR | Volume 6, Issue 1 | ISSN: 2321-9939
Education Male Female Total
Absolute Data Relative Absolute Data Relative Absolute Data Relative
Data (in Data Data
%tage) (in %tage) (in %tage)
Educated 183 52.58 98 43.94 281 49.21
Uneducated 165 47.41 125 56.05 290 50.78
Total 348 100 223 100 571 100
Figure6. Educational Structure of Bilawal
Educational structure
60
50
Relative Data ( in %tage)
40
Male
30
Female
Total
20
10
0
Educated Eneducated
The Table8 and Figure 7 show the level of education in the studied village. 54.92 percent of population is indulged in primary
education, 27.27 percent of population in secondary education, 9.09 percent of population in senior secondary education, 7.95
percent of population in U.G education, 0.75 percent of population in P.G education. The level of education at primary level
shows a good picture of area but declining rate with the increasing level of education is worrisome. The majority of people are
educated only upto secondary level of education only.
Table8. Education level in Bilawal
Persons Male Female Total
Absolute Relative Absolute Relative Absolute Relative
data data data data data data
Level of education
Primary 97 56.06 48 52.44 145 54.92
Secondary 37 21.38 35 38.46 72 27.27
Senior Secondary 19 10.98 5 5.49 24 9.09
IJEDR1801132 International Journal of Engineering Development and Research (www.ijedr.org) 768© 2018 IJEDR | Volume 6, Issue 1 | ISSN: 2321-9939
U.G 18 10.40 3 3.29 21 7.95
P.G 2 1.15 0.00 0.00 2 0.75
Other 0.00 0.00 0.00 0.00 0.00 0.00
Total 173 100 91 100 264 100
Figure7. Education level in Bilawal
Level of Education
PG
1%
SR SECONDARY
9% UG
8%
SECONDARY PRIMARY
27% 55%
2.3 Market Facility
Table8 and Figure7 show the market facility in the sampled household. More than 50 percent of people are unsatisfied with
market facilities available to people. The market in the area is not developed due to lack of transportation facilities, only few
products of daily use are available in the local market.
Table8. Satisfaction regarding Market Facility in Bilawal
Category of Satisfaction Degree of Satisfaction
Satisfied 40%
Unsatisfied 60%
Total 100%
Figure7. Satisfaction regarding Market Facility in Bilawal
Market Facility
40% Yes
No
60%
2.4. Transportation Facility
Table9 and Figure8 show the transportation facility in the sampled household. As we can see in the data that the transportation
facilities are developed like only 20.63% of people have cars and almost 51% of people have Motorcycle. A very few people are
using the environment friendly vehicle i.e. bicycle, resulting the quality of environment in the area.
Table9. Transportation Facility in Bilawal
Vehicles Actual Number Percentage
IJEDR1801132 International Journal of Engineering Development and Research (www.ijedr.org) 769© 2018 IJEDR | Volume 6, Issue 1 | ISSN: 2321-9939
Motorcycle 32 50.80
Bicycle 8 12.69
Car 13 20.63
Others 10 15.88
Total 63 100
Figure8. Transportation Facility in Bilawal
Transportation Facility
40
32
30
20
13
8 10
10
0
Motorcycle Car Bicycle Others
CONCLUSION
The main business of people in Bilawal village is to cultivate, but some people are also engaged in private and government jobs.
Now, with the changing era, people have also got engaged in secondary activities rather than primary activities, in which the
mining industry is playing an important role in development of the village where huge number of population of the village are
employed as labor. Moreover, it can gradually increase the employment level of the village. The facilities in the village are
electricity, road, and pipelines for drinking water and wells and Canals for irrigation.
PROBLEMS
The analysis done in the current paper reflects existence of lot of problems in the village. There is lack of health facilities and
hospitals. The area is facing many problems such as problems regarding education, proper drainage, lack of market facilities, lack
of modes of communication, transportation, electricity availability, lack of water supply, unmetalled and damaged road problems,
unemployment, lack of entertainment sources, problems related to sanitation etc.
SUGGESTIONS
There can be much Economic Development of the village if there should be a proper blockage-free metalled drainage system.
Services of PHC (Public Health Centre) must be facilitated for proper health care of the local peoples on regular basis. Market
system should be improved and new shops of fresh items (like-vegetables and other food stuff in packet forms) can be started,
Facility of electricity should be given for 24 hours. There should be a proper transport system too. Education is a very important
need for human development and to make the rural people aware about the benefits of education, government and other NGO’s
should run many awareness programs (such as-street play etc.). Water facilities are not so developed in that village and impure
water is also a big problem, so responsible authorities have to take suitable steps against these problems. Awareness of the people
about the benefits of bathroom and toilet facilities could improve the hygiene conditions of the area.
REFERENCES
[1] Bansal,S. (2010). Rural Settlement Geography, Meenakshi Prakashan, Merut, 9-50.
[2] http://village.org.in/Bilawal
[3] http://www.censusindia.co.in/villages/bilawal-population-bhiwani-hariyana-61524
[4] http://www.haryana21.com/distt-villages/village.php?villageid=413
[5] https://en.wikipedia.org/wiki/Bilawal,_Bhiwani
[6] https://indikosh.com/vill/64800/bilawal86
[7] https://soki.in/bilawal-badhra-bhiwani
[8] https://villageinfo.in/haryana/bhiwani/badhra/bilawal.html
[9] https://www.accuweather.com/en/in/bilawal/3044828/weather-forecast/3044828
[10] https://www.accuweather.com/en/in/hr/haryana-weather
[11] https://www.mapsofindia.com/villages/haryana/bhiwani/dadri/bilawal.html
[12] https://www.slideshare.net/charujaiswal/socio-economic-survey-on-siswan-by-charu-jaiswal
[13] https://www.wikivillage.in/village/haryana/bhiwani/badhra/bilawal
[14] Singh,R.L. and Rana P.B. Singh.1978, Transformation of Rural Habitat in Indian Perspective, A Geographical
Dimension,NGSI,Varansi.
[15] Tiwari,R.C. (1984). Adhiwas bhoogol, Prayag Pustak Bhavan, Allahabad, 2806.
IJEDR1801132 International Journal of Engineering Development and Research (www.ijedr.org) 770You can also read