Exploring Satellite Image Integration for the Chesapeake Bay SAV Monitoring Program - A STAC Workshop Virginia Institute of Marine Science October ...
←
→
Page content transcription
If your browser does not render page correctly, please read the page content below
Exploring Satellite Image Integration for the
 Chesapeake Bay SAV Monitoring Program
                          A STAC Workshop
                  Virginia Institute of Marine Science
                    October 2019 – February 2020
       Co-chairs Brooke Landry (MD DNR) and Peter Tango (USGS)
The Chesapeake Bay SAV Monitoring Program
is the most successful large-scale, consistent,
long-term SAV monitoring program in the world.
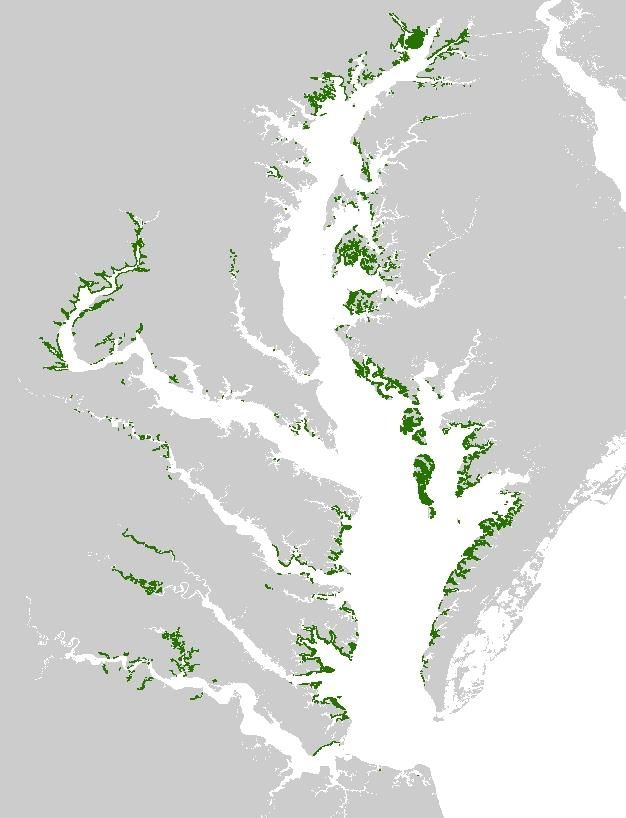
The Chesapeake Bay SAV Monitoring Program
is the most successful large-scale, consistent,
long-term SAV monitoring program in the world.
So why mess with it?

1. Increasing in price while partner funding is decreasing (and new
flight contractor will raise acquisition costs more)

2. Logistically cumbersome to coordinate with flight contractors
(clouds, wind, tides all need to be perfect)

3. The weather itself is becoming more difficult to deal with (more
clouds, more rainy days)

4. Increasing airspace restrictions (DoD doesn’t like us taking pictures
over installations)

5. JJ is retiring
But we really need it….

1. State Water Quality criteria assessments and
tracking progress toward SAV goal attainment

2. Aquaculture Lease Site Evaluations and permitting
decisions

3. Monitor Propeller Scarring (VA) and other Bay-wide
SAV violations

4. Supports Peer Reviewed Science Requiring Annual
data

5. A recent amendment to the WRDA amended Section
117 of the Clean Water Act and states that “The
Administrator [of the EPA] shall carry out an annual
survey of seagrasses in the Chesapeake Bay” ....
Workshop Objectives

                              Overarching objective:
to conduct a thorough review of the science and technology associated with the
     use of satellite imagery for Chesapeake Bay SAV acreage assessment.
       Identify if there are scientific, logistical, and/or financial benefits.
Workshop Objectives
Overarching objective:
to conduct a thorough review of the science and technology associated with the
use of satellite imagery for Chesapeake Bay SAV acreage assessment.
Identify if there are scientific, logistical, and/or financial benefits.
Specifically, details are needed to
• establish the relationships and protocols necessary for new satellite image acquisition, access,
storage and management
• demonstrate and document the comparability of the methods between historical data outputs
and satellite image-based results, defining precision and accuracy and any geographic
limitations on satellite image assessment,
• establish community agreement on algorithms implemented for image interpretation and
outputs of results since the indicator of acreage is also a regulatory based endpoint to water
quality standards attainment in the tidal bay jurisdictions.Workshop Objectives
Overarching objective:
to conduct a thorough review of the science and technology associated with the
use of satellite imagery for Chesapeake Bay SAV acreage assessment.
Identify if there are scientific, logistical, and/or financial benefits.
Specifically, details are needed to
• establish the relationships and protocols necessary for new satellite image acquisition, access,
storage and management
• demonstrate and document the comparability of the methods between historical data outputs
and satellite image-based results, defining precision and accuracy and any geographic
limitations on satellite image assessment,
• establish community agreement on algorithms implemented for image interpretation and
outputs of results since the indicator of acreage is also a regulatory based endpoint to water
quality standards attainment in the tidal bay jurisdictions.Workshop format • Four session that would follow a 2 half-day format; limited session participants; all at VIMS • October 2019 to April 2020 • COVID laughed at us, last session cancelled.
25 questions
•A federal agency is required to task and solicit data from Maxar. Assuming the EPA will serve as the NGA intermediary and tasking authority, can we task Maxar to capture specific areas at specific times
under specific conditions?
•If so, how much advance notice is required for a task order?
•What is the exact process for submitting a task order, including contact information?
•How many tasks can we submit each year? Would Maxar be willing to get the entire Bay? Tributaries? Coastal Bays?
•How many images would it take to cover the entire Bay and its tributaries during peak biomass for each salinity regime?
•What is the turnaround time? i.e., If you tasked Worldview to take an image of the upper Bay on August 8th, when would that data be delivered?
•How is the data delivered? In what format?
•Is imagery/data delivered in usable state, or does it require additional processing prior to use, such as atmospheric correction and orthorectification?
•Once data is delivered, would it require special storage? Would VIMS or the CBP need improved/enhanced storage capacity and security?
•Can we publish jpgs of satellite imagery on the VIMS server? What is the process for getting permission to do so?
•What are possible options if we can’t publish the imagery?
•What are the repercussions associated with not being able to publish the imagery (and only publish the mapped SAV bed)? What agencies and missions would be affected[TPJ1] [BL2] ?
•How much more work is needed before AI is ready for CB SAV mapping? How much additional time will any additional efforts require?
•What is the advantage to using AI/machine learning over hand-mapping?
•What are the logistical/scientific advantages of hand-mapping?
•Can we train the program to map using hand-mapping techniques to ensure continuity of data (ie. so that the numbers don’t drop dramatically when each individual patch is mapped rather than the
larger bed as a whole)?
•What sort of comparison study would be necessary for CBP to move forward transitioning to satellite, or at least incorporating it?
•Do you anticipate needing additional funding for the comparison study? If so, how much?
•With regard to the fixed-wing aircraft image acquisition, how much will the new contractors charge once their current contract is up in two years? This will be important in justifying either incorporating
(or not incorporating) satellite imagery into our CB SAV Monitoring Program.
•Does the steering committee, as a whole, recommend incorporation of satellite imagery into the CB SAV Monitoring Program?
•What financial benefit will transitioning to satellite imagery provide, if any (ie. assuming CBP can get the imagery for free based on the arrangement between the federal government and Maxar, will the
cost of the CB SAV Monitoring Program decrease)?
•What logistical benefit will transitioning to satellite imagery provide, if any (ie. will it reduce the time spent coordinating flights, or will tasking be just as cumbersome?)?
•Is there a role for drone imagery in the CB SAV Monitoring Program? Should it be an official part of the program, or used to spot check and ground truth as periodically available?
•Is there potential to coordinate with the DoD more efficiently so as not to produce and pay for redundant data in areas where the DoD and VIMS map the same space?
•What support from the Chesapeake Bay Program will be necessary to transition to partial or complete use of satellite imagery?
Workshop Big Picture: 10 Take Home Points

1. Not all satellite data is created equal: Resolution, orbital paths, tasking capacity,
   tilting capacity all vary. For the purposes of the CB SAV Monitoring Program,
   WorldView 3 owned by Maxar is the best.

2. The good data is going to be harder to get: there’s an expansive archive of CSI to
   browse but many of the images are obscured by cloud cover, turbid conditions, etc.
   Tasking will be necessary and is more difficult, but do-able.

3. Use of commercial satellite data is an option for use if accessible: If we can get
   the data, we can use it. VIMS analysists verified that given a good satellite image,
   they can map the SAV just as they do from aerial imagery.

4. Hand mapping would follow same protocol and yield same results: this, as well
  as the above point, was demonstrated in 2018 when VIMS couldn’t fly the entire Bay
  for a variety of reasons and used satellite imagery as backup.
Workshop Big Picture: 10 Take Home Points

5. Algorithms/AI/machine learning will
eventually automate mapping, but there’s
significantly more work to do before
algorithms are ready for CB: With funding,
algorithms could be ready in 3-5 years.

6. Using AI may yield more precise
results but skew long-term trends:
Current method of hand delineation clumps
SAV patches, whereas AI would split them,
excluding the sparsely populated space in
between patches. May be able to fix this by
then clumping the patches together to more
closely replicate VIMS methodology.
Workshop Big Picture: 10 Take Home Points
7. A hybrid approach (planes+satellites) may still be necessary if we can’t get
satellite data for whole Bay: Test-tasking suggests that we won’t be able to get the
whole Bay with satellite, so will still rely to an extent on small plane over-flights.

8. There will be multiple complications regarding imagery publication and
retention.
    • We may not be able to publish the imagery itself, just the derived product.
    • EPA primarily needs maps and acreage values, but state agencies need the
      imagery for aquaculture leases and tracking SAV violations
    • When the contract ends, the source imagery must be deleted.

10. There will always be problems associated with cloud cover, turbidity, etc. but
illumination issues at least may be solved with satellite.
Instructions for tasking WorldView 3
This is a multistep, convoluted process that Dave Wilcox, VIMS, is currently
working with the USGS to accurately report. Instructions will be included in the
workshop report.
-Neigh et al. 2013. High-Resolution Satellite Data Open for Government Research. Eos (94/13) 121-123.Next Steps and Recommendations
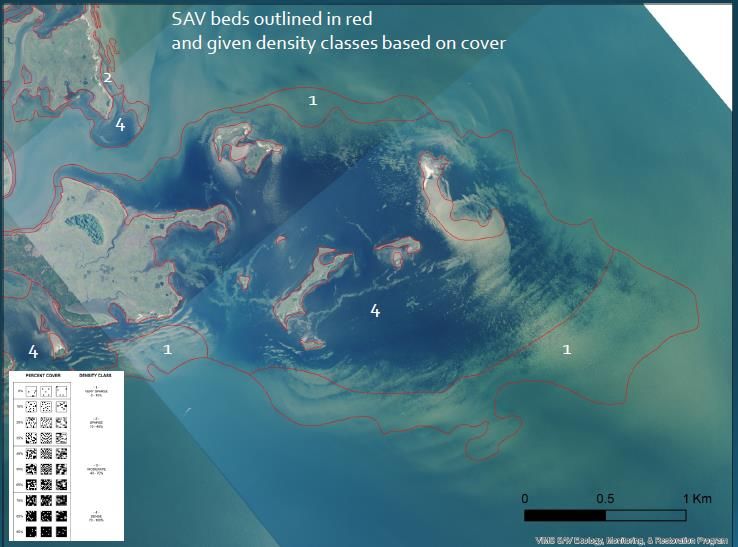
2018: VIMS used satellite data to fill gaps in aerial imagery. Used hand delineation. There were issues using
satellite imagery that wasn’t specifically tasked for SAV mapping = glint, cloud cover, lack of peak biomass
data, turbidity. Overall where imagery was good, it completely comparable product.
2019-2020: STAC SAV Satellite Workshop; write report
2020: Continue aerial data acquisition with satellite backup to determine flexibility
1. Write Federal Agency scope of work/requirements
2. Run an early test tasking exercise to figure out the steps
3. Conduct a match-up exercise to determine if imagery produces similar results in multiple areas
4. Task Worldview 3 for restricted areas (Honga, APG, St. Mary’s)
2021: Continue aerial data acquisition with satellite backup. Task for FULL BAY as back-up and mimic.
2021 will be the check-in point based on 2020-2021 success or failure.
2022-2032: Whole Bay project
1. Potentially transition to full Bay SAV mapping with satellite.
2. Keep fixed-wing on retainer for back-up.
3. As it becomes available, incorporate AI to automate mapping. Develop AI methods to mimic
historical hand-delineation methods.The final product
The workshop product is/will be a report-and-guidelines document laying out the
information and steps necessary to integrate the use of satellite data and imagery
into the Chesapeake Bay SAV monitoring program.The final product
The workshop product is/will be a report-and-guidelines document laying out the
information and steps necessary to integrate the use of satellite data and imagery
into the Chesapeake Bay SAV monitoring program.
Specifically, the workshop report will include
• a summary of each workshop session and the information produced
• a summary of current Chesapeake Bay SAV monitoring methodology
• an assessment of the feasibility of satellite data integration (related to the science)
• documentation of costs, benefits, and any potential disadvantages of the integration (logistical,
financial, scientific)
• instructions for commercial satellite data acquisition
• instructions for data management – expectations and requirements
• Due in December, more likely ready early 2021Steering committee and key participants Workshop Steering Committee and Key Participants: Brooke Landry: Chair, Chesapeake Bay Program SAV Workgroup; Biologist, Maryland Department of Natural Resources (Workshop Co-Chair) Peter Tango: Chesapeake Bay Monitoring Coordinator, United States Geological Survey (Workshop Co-Chair) Bill Dennison: Vice President for Science Application, University of Maryland Center for Environmental Science (STAC Member) Robert (JJ) Orth: Professor of Marine Science and Director of the Chesapeake Bay SAV Monitoring Program, Virginia Institute of Marine Science David Wilcox: Manager of the Chesapeake Bay SAV Monitoring Program, Virginia Institute of Marine Science Richard Zimmerman: Professor of Ocean, Earth, and Atmospheric Science, Remote Sensing expert, Old Dominion University Blake Schaeffer: Remote Sensing expert, EPA Region 4 headquarters in Raleigh, NC Carin Bisland: Partnerships and Accountability Branch, EPA Chesapeake Bay Program Office
Questions?

             brooke.landry@maryland.gov
You can also read