OPTIMIZING 3D SURFACE CHARACTERISTICS DATA COLLECTION BY RE-USING THE DATA FOR PROJECT LEVEL ROAD DESIGN - Pavemetrics
←
→
Page content transcription
If your browser does not render page correctly, please read the page content below
8th Symposium on Pavement Surface Characteristics: SURF 2018 – Vehicle to Road Connectivity
                                       Brisbane, Queensland, 2018

OPTIMIZING 3D SURFACE CHARACTERISTICS DATA
COLLECTION BY RE-USING THE DATA FOR PROJECT
LEVEL ROAD DESIGN
Benoit Petitclerc, P.E.
John Laurent, M. Sc
Richard Habel, M. Sc.,
Pavemetrics Systems Inc., Canada

ABSTRACT
Road Transportation Ministries and asset managers around the world usually require annual
inspections of their roads and infrastructures in order to plan maintenance operations. Road
surface defects (texture, cracks, rutting, IRI – smoothness) are important data that need to be
measured and serve as input data to PMS (Pavement Management Systems) software. These
defects are likely measured using 3D laser sensors that acquire the shape of the road surface in
order to evaluate its condition. Once it is determined that the road condition has degraded to the
point that it needs to be rehabilitated and resurfaced then a high precision survey of its surface
is usually required. This survey is typically used by the engineers as an input to 3D CAD road
design software that can then be output to control 3D pavers and millers using laser tracking
total stations.
What we propose is a way to reuse the 3D road surface condition data to create the road
surface model so as to avoid having to do expensive manual road surface surveys that require
road closures.
This article proposes a totally new approach that provides a way to tag collected high resolution
high accuracy transverse road profile data acquired by a LCMS system (Laser Crack Measuring
System - Pavemetrics) combined with a highly accurate GNSS-INS system (Applanix POS-LV -
Trimble) to measure both road surface condition and to generate a survey grade accuracy
terrain map of any road surface.

This article will describe how the information provided by the 3D LCMS system, DMI, Applanix
POS-LV, GPS with local RTK corrections and post processing (POSPac-Trimble) software are
used to generate the road surface models. The accuracy of the models created are evaluated
comparing them to surveyed control points and determining the repeatability measurements of
multiple runs.

Results will show that using this method it is possible to generate much higher resolution survey
grade road surface models that can be used for resurfacing applications using 3D paving and
milling equipment from the original 3D data that was used to evaluate the actual condition of the
road surface itself. This process results in significant productivity improvements, optimization of
the quantity of material that needs to be carried in and out, lower survey costs, decreased traffic
interruptions and improved safety of surveyors while improving the quality and resolution of the
road surface models.

© ARRB Group Ltd and Authors 2017                                                                      1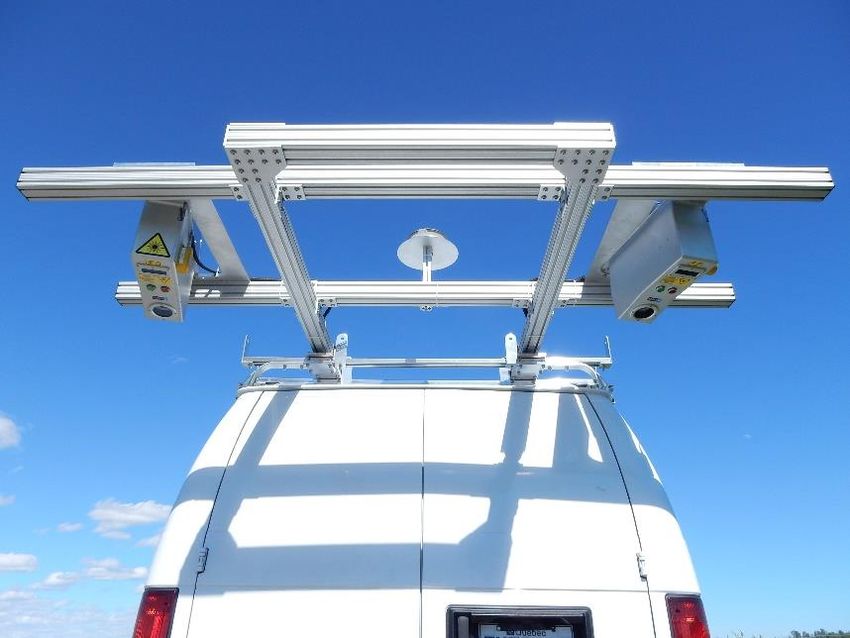
8th Symposium on Pavement Surface Characteristics: SURF 2018 – Vehicle to Road Connectivity
Brisbane, Queensland, 2018
INTRODUCTION
Road Transportation Ministries and asset managers around the world usually require annual
inspections of their roads and infrastructures in order to plan maintenance operations. Road
surface defects (texture, cracks, rutting, IRI – smoothness) are important data that need to be
measured and serve as input data to PMS (Pavement Management Systems) software. These
defects are likely measured using 3D laser sensors that acquire the shape of the road surface in
order to evaluate its condition [1] [2] [3] [4] [5] [6]. Once it is determined that the road condition
has degraded to the point that it needs to be rehabilitated and resurfaced then a high precision
survey of its surface is usually required. This survey is typically used by the engineers as an
input to 3D CAD road design software that can then be output to control 3D pavers and millers
using laser tracking total stations.
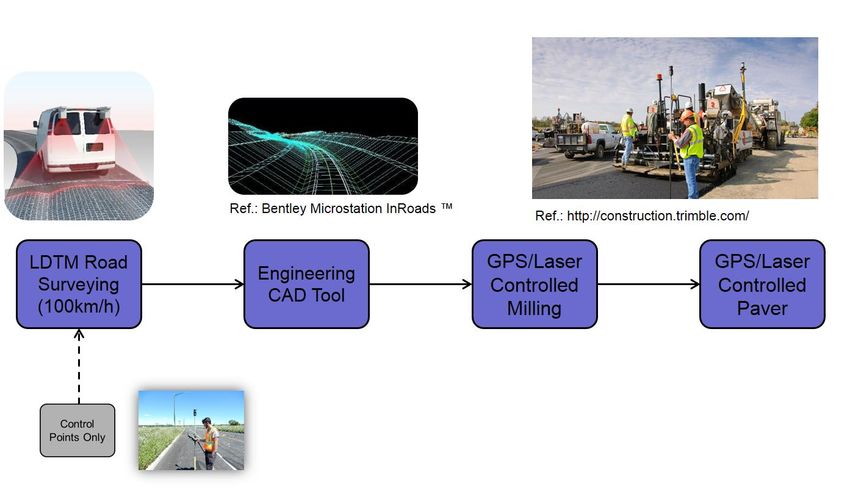
Until now, the only way to capture a highly accurate representation of the road surface was to
mandate surveyors with laser total stations to sample each lane over the entire length of the
project. This action requires a lot of human resources and necessitates the closure of lanes to
traffic.
The approach that we propose is to combine data from different sensors (3D laser profilers,
inertial system, GNSS and DMI) to produce a real 3D representation of the road surface that is
as accurate as the one produced by a surveyor but with a higher density of data.
SYSTEM CONFIGURATION
The 3D mapping solution proposed is based on data provided by 2 laser profilers that acquire
4000 point 3D transverse profiles of a road lane up to 4m wide. These sensors can operate at
profile rates as high as 28,000Hz allowing the acquisition of a transverse profile at 1mm
intervals at speeds up to 100km/h. These 3D point clouds are usually processed to extract road
surface distresses such as cracks, ruts, pot holes and even evaluate aggregate loss and
surface texture.
To acquire real 3D surface maps of the road the 3D data from the laser profilers must be
corrected to compensate for vehicle and suspension motion, driver wander and vibrations. To
achieve this a Distance Measuring Instrument (DMI) and sensors capable to provide inertial
information about the attitude of the vehicle/sensors installation and its location must be added
to the system. To achieve this a Global Navigation Satellite System (GNSS) and an Inertial
Measurement Unit (IMU) or an Inertial Navigation System (INS) that integrates both functions
must be added to the system.
Photo of the 3D laser profilers (LCMS) and INS system on the survey vehicle.
© ARRB Group Ltd and Authors 2017 2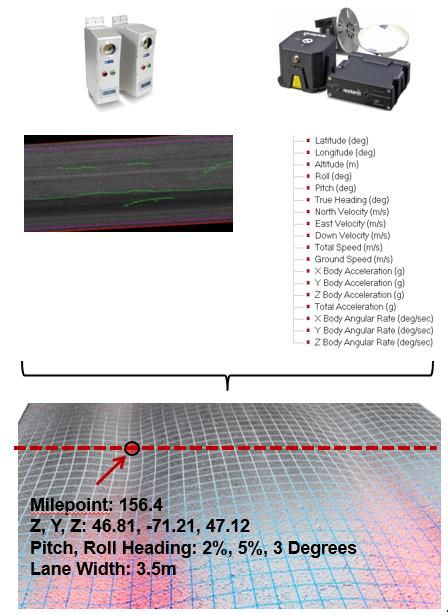
8th Symposium on Pavement Surface Characteristics: SURF 2018 – Vehicle to Road Connectivity
                                       Brisbane, Queensland, 2018

SYSTEM CALIBRATION
System calibration is required to map the different physical locations and coordinate systems of
the systems components (GPS, IMU, Laser Sensor, DMI) on the survey vehicle into a single
final reference system (GPS). The purpose of the calibration is to establish the digital model of
the position of 3D sensors on the vehicle versus the position of the other elements (GPS, IMU,
DMI).

The calibration process consists in four steps.

    1. Physical measures of the different level arms between each system sensors.

    2. Scan of a reference surface

© ARRB Group Ltd and Authors 2017                                                                      3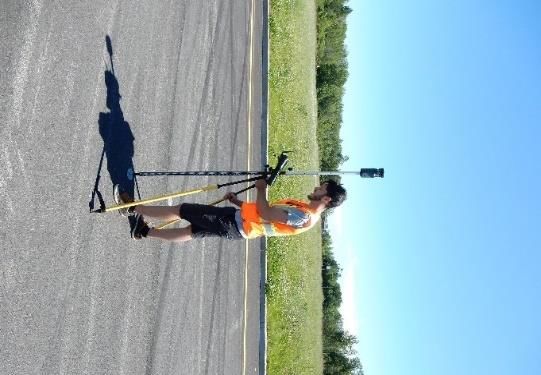
8th Symposium on Pavement Surface Characteristics: SURF 2018 – Vehicle to Road Connectivity
                                     Brisbane, Queensland, 2018

       That step of the calibration process establishes the necessary parameters to solve the
       ambiguity between the left and right LCMS sensors. The overlap zone between the
       sensors over the reference object will be used as a reference surface and the
       adjustments done on the different metrics (orientation, angles, height, etc.) of the LCMS
       sensors to produce a perfect surface will be used in the final calibration solution.

   3. The “Stop And Go” part of the calibration will measure the acceleration in the 3 axes (X,
      Y and Z) of the IMU when the vehicle is stationary and when it is accelerating. This
      information is used to determine the orientation of the sensors related to the
      gravitational force.

   4. 3 specific survey type calibration runs are required passing over the reference object
      and are done to fine tune the calibration parameters (gyro and accelerometer bias) to
      ensure a perfect match between sensors and runs (Stitching). This step will determine
      the necessary parameter adjustments required to compensate for the drift over time of
      the IMUs.

               Run 1: Loop

               Run 2: Back Thru

© ARRB Group Ltd and Authors 2017                                                                    4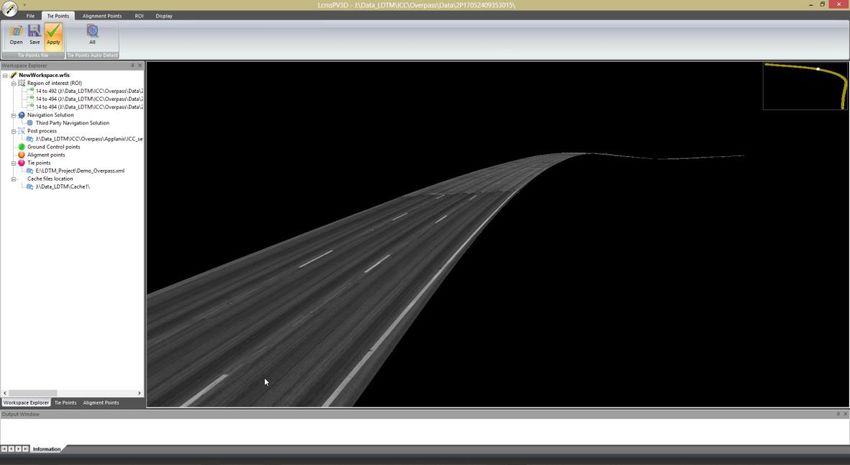
8th Symposium on Pavement Surface Characteristics: SURF 2018 – Vehicle to Road Connectivity
                                      Brisbane, Queensland, 2018

                Run 3: Right angle

PROCESSING
    •   GNSS/INS systems

To obtain the best accuracy possible, it is highly recommended to post-process the GNSS/INS
data using a local base station with RTK corrections.

The GNSS/INS data processing is usually done by the software provided by the INS/GNSS
manufacturer. The output of the GNSS/INS post-processing will be fed into the Terrain Mapping
software and will replace the real-time navigation solution recorded during the survey.

Even if there is no post-process data available, it is always possible to produce a 3D surface
using the real-time data recorded in the files during the data acquisition however accuracy and
repeatability will be affected.

    •   Terrain Mapping

The terrain mapping processing consist on the assignation of an accurate location (Lat/Long,
UTM) to each pixels of every profile contained in the LCMS survey.

Three steps are necessary:

    1. Navigation solution (Post-processed or not)

The navigation solution provides all the information on the attitude and movements of the
vehicle. This information can be applied through the calibration parameters to the LCMS data.

© ARRB Group Ltd and Authors 2017                                                                     5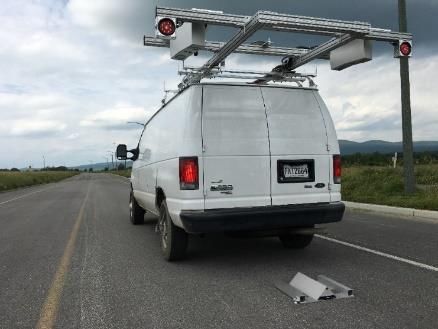
8th Symposium on Pavement Surface Characteristics: SURF 2018 – Vehicle to Road Connectivity
                                       Brisbane, Queensland, 2018

At this step, the resulting surface is as precise as the navigation solution. The accuracy of the
surface can be improved by the usage of alignment and control points as described in the
following steps.

Uncorrected 3D mesh data of three different lane scans (the overlapping areas do not match up
well).

    2. Tie points

To perfectly stitch together many lanes coming from many runs or surveys, tie points need to be
created in the overlap zone between these lanes.

Tie points are common features that are present in 2 different runs. These points are used to
stitch runs all together and to produce a unique surface or point cloud.

© ARRB Group Ltd and Authors 2017                                                                      6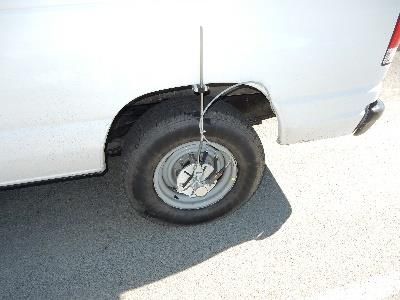
8th Symposium on Pavement Surface Characteristics: SURF 2018 – Vehicle to Road Connectivity
                                       Brisbane, Queensland, 2018

These points can be found automatically by the detection software using 3D correlation of the
overlap zone.

Corrected 3D mesh data of three different lane scans (the overlapping areas match up well).

    3. Applying surveyed reference Alignment points

The alignment points are used to attach the surface to a highly accurate
reference point. These points are normally surveyed using a robotic total
station and are separated from each other of about 300 to 1000 meters on
road surface or shoulder.

These points are then imported in the processing software to be added to
the positioning solution.

After that step, the entire point cloud is as accurate as a
survey grade survey which means 3 to 5 mm.

© ARRB Group Ltd and Authors 2017                                                                      7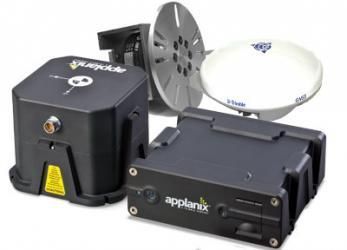
8th Symposium on Pavement Surface Characteristics: SURF 2018 – Vehicle to Road Connectivity
                                       Brisbane, Queensland, 2018

Final result of each of the steps merging three different lanes of a road and bridge deck.

RESULTS / VALIDATION
In order to establish the accuracy of the system, a reference site was build and more than 500
reference points.

                                                                                Markers group

These 500 points were surveyed 3 times using a robotic total station and a laser level. The
accuracy of the ground truth which was established to be between 2 and 5 mm.

The Laser Digital Terrain Mapping (LDTM) system (LCMS + POS LV) was then evaluated on the
basis of the ground truth and 12 runs were done to evaluate the repeatability and the accuracy
of the system.

Two alignment points distances were tested and evaluated, 300 and 850 meters.

© ARRB Group Ltd and Authors 2017                                                                      8
8th Symposium on Pavement Surface Characteristics: SURF 2018 – Vehicle to Road Connectivity
                                                                                 Brisbane, Queensland, 2018

                                                        Multiple runs - Average error compare to GT
                      8
                      7                                                 (300 meters)
 Average RMS Error (mm)

                      6
                      5
                      4
                      3
                      2
                      1
                      0
                                                    1         2       3       4       5           6           7       8        9       10   11   12
                                                                                                      Run

                                                                                              X       Y   Z

 Accuracy compare to GT (Avg. in mm):                                                                                         X: 5.0        Y: 4.0        Z: 2.5
 Repeatability compare to first scan (mm)*:                                                                                   X: 3.0        Y: 5.0        Z: 2.0
The results show that with a distance of 300 meters between the alignment points (control) that
the accuracy and the repeatability of the LDTM system were averaging between 2 and 5mm.
For the 825 meters scenario, the results showed an overall accuracy of 5 to 9 mm and for the
repeatability 4 to 6 mm.

                                                          Multiple runs - Average error compare to GT
                                                   14
                                                                          (825 meters)
                          Average RMS Error (mm)

                                                   12

                                                   10

                                                    8

                                                    6

                                                    4

                                                    2

                                                    0
                                                          1       2       3       4       5           6           7       8        9   10   11   12
                                                                                                      Run

                                                                                              X       Y   Z

 Accuracy compare to GT (Avg. in mm):                                                                                         X: 9.0        Y: 7.0        Z: 5.0
 Repeatability compare to first scan (mm)*:                                                                                   X: 6.0        Y: 6.0        Z: 4.0

© ARRB Group Ltd and Authors 2017                                                                                                                     9
8th Symposium on Pavement Surface Characteristics: SURF 2018 – Vehicle to Road Connectivity
Brisbane, Queensland, 2018
APPLICATION
The Terrain Mapping (LDTM) system can export the surface model data in LAS format that can
be read by any 3D CAD software. Before exporting the software will scale the resolution of the
data to lower and more manageable point densities. Very nice detailed maps can be generated
at resolutions of 100 x 100mm. Points are decimated to fixed resolutions (x,y) and the vertical
(z) position is filtered to avoid reporting rocks and cracks on the road surface.
These high-resolution 3D surface models can be used by engineers to design better roads [7]
[8] [9] compared to the traditional survey method that only generates 3 points across the road
every 20m or lidar based mobile mapping solutions that are only accurate to a few centimeters.
This increased resolution allows to better optimize the quantity of material that needs to be
carried in and out of the construction site. The use of LDTM models and automated laser
controlled milling machines that adjust the height of the cutting heads can be used to correct the
roads longitudinal profile (compared to fixed milling depth and 3D controlled Pavers can then be
used to create variable thickness new asphalt layers also resulting in a smoother road profiles
that will last longer considering the reduced axial dynamic loads resulting from the heavy
vehicles.
CONCLUSION
A method was described that combines data from different sensors (3D laser profilers, inertial
system, GNSS and DMI) to produce at traffic speed a real 3D representation of the scanned
surface. Multiple lanes of a road surface were scanned one at a time and merged automatically
together using 3D features detected in common overlapping areas between the scans of
adjacent lanes. The resultant road surface map was adjusted to ground control points and the
accuracy and repeatability of the overall surface model was evaluated to be as good as those
that can be produced by a surveyor with a laser total station.
Using this methodology, it was shown that it is possible to generate much higher resolution
survey grade road surface models that can be used for resurfacing applications using 3D paving
and milling equipment from the original 3D data that was used to evaluate the actual condition
of the road surface itself. This process results in significant productivity improvements from
© ARRB Group Ltd and Authors 2017 108th Symposium on Pavement Surface Characteristics: SURF 2018 – Vehicle to Road Connectivity
Brisbane, Queensland, 2018
lower survey costs, decreased traffic interruptions and improved safety of surveyors while
improving the quality and resolution of the road surface models.
REFERENCES
[1] Laurent, J., Lefebvre, D., Samson E. (2008). Development of a New 3D Transverse Profiling
System for the Automatic Measurement of Road Cracks. Proceedings of the 6th Symposium on
Pavement Surface Caracteristics, Portoroz, Slovenia.
[3] Wang, K. C. P. Automated Survey of Pavement Distress Based on 2D and 3D Laser Images.
Mack–Blackwell Transportation Center, University of Arkansas, Fayetteville, 2011.
[4] Li, Q., Y. Ming, Y. Xun, and B. Xu. A Real-Time 3D Scanning System for Pavement Distortion
Inspection. Measurement Science and Technology, Vol. 21, No. 1, 2010, p. 015702.
[5] Wix, R & Leschinski, August 2013, ‘3D TECHNOLOGY FOR MANAGING PAVEMENTS’,
Institute of Public Works Engineering Australia conference , Darwin, Australia
[6] J. Laurent, J-F. Hébert, M. Talbot, 2017, ‘Using full lane 1mm resolution 3d road survey data
for the automated detection of surface characteristics and geometry.’, Baltic Road Conference,
Tallinn, Estonia.
[7] Pekka KilPelainen, Mika Jaakkola, Pauli Alanaatu, ‘Development of a control system for a
multipurpose road repairing machine’, Automation in Construction, Volume 20, Issue 6, October
2011, Pages 662-668.
[8] Gunnar Gräfe, Kinematic 3D Laser Scanning for Road or Railway Construction Surveys, 1st
International Conference on Machine Control & Guidance 2008
[9] Gunnar Gräfe, G., 2005. Kinematic Determination of digital Road Surface Models.
Conference on Optical 3D Measurement Techniques VII, Proceedings published by Grün and
Kahmen,Vienna, Austria, pp. 21-30.
© ARRB Group Ltd and Authors 2017 11You can also read