Front-end data visualization tools to look out for in 2021 - A Mindtree Point of View | October, 2020
←
→
Page content transcription
If your browser does not render page correctly, please read the page content below

Front-end data
visualization
tools to look
out for in 2021

                  A Mindtree Point of View | October, 2020
Data visualization leverages the incredible capabilities and bandwidth of the visual systems to move a
huge amount of information into our brains quickly - it helps us comprehend information quickly. For
instance, charts, maps, graphs, etc. are used to show trends, patterns, irregularities and relationships. Data
visualization techniques are continuously evolving and significantly impact today’s business due to the
crazy amount of data we are rapidly producing. This is where data visualization tools come into play to
create different charts from simple to advanced to bring data to life. In this article, we will discuss the top 5
data visualization tools for front-end developers to look out for in 2021. Although data visualization tools
help us to visualize the data, we need to ensure that the visualizations that appear on front-end
application must be simple, powerful and give meaning despite the screen size. In addition, nowadays,
industries are inspired to follow design patterns such as atomic design that involve breaking down web
applications into simple and small components to be easily reused somewhere in the application. This
improves the development time, maintainability and readability (especially if you return to the code later
in the future for reference or to make changes). With this atomic design pattern in mind, the data
visualization tool we choose needs to be aligned with the concept of this pattern.

Furthermore, we will try to understand which tools are widely used among the developers by looking at
their weekly Node Package Manager (NPM) downloads, Stack overflow data, GitHub activities and topic
searches on Google. We will go through the below points to see the capability of each tool – this helps us
to know the likelihood of the tool appearing or dominating in 2021:

•   How large is the dataset?
•   What kind of charts do you want to use?
•   Where is this tool used? e.g., Web, tablet, mobile?
•   Browser support
•   Do you need to use any framework/library or plain JavaScript will be sufficient?

2   www.mindtree.com                                                                              ©Mindtree 2020
1. D3.js
D3 is one of the most popular JavaScript libraries available for creating dynamic and interactive data
visualization. D3.js uses Scalable Vector Graphics (SVG) to create objects on browser. D3 functions enable
us to bind large datasets with SVG objects in order to generate graphic charts and diagrams.

There are three important concepts every developer needs to understand before using D3. The first
concept is to know how to use and manipulate SVG in order to create an object on the browser, such as
shapes. The second concept is data binding - D3 has its own way of joining or binding data into SVGs. This
may be confusing for the developer who has just started learning D3. The last concept is to pick up the
scale functions D3 provides. This function is used to transform data values into visual variables such as
position, length, colour, etc.

D3 might be useful for vanilla (plain) JS developer as integration with plain JS is easy. However, as D3.js has
access to the Document Object Model (DOM), there may be a conflict in handling the DOM if JS
library/framework such as React is used. For instance, React creates its own virtual DOM or node tree rather
than using the real DOM to update state. React only updates the elements where changes are detected.
Whereas, D3 accesses the real DOM directly for updates or manipulation. As we have noticed React and D3
use two different approaches to handle updates or manipulation. Therefore, there will be a conflict if we
decide to integrate D3 with React. To avoid this conflict, the developer needs to ensure that React and D3
work in their own spaces. This is an indicator that shows that D3 has a steep learning curve that is time
consuming. D3 is also useful to create charts from scratch.

3   www.mindtree.com                                                                             ©Mindtree 2020
Community:
    NPM Data suggests that many users depend on the library as it has 1,286,805 weekly downloads. D3 is
    maintained regularly since its last published date was 21 days ago. Its 93.8K star on Github shows that a
    substantial number of people are interested in this project.
    D3 remains dominant over the years on Stack overflow and the result is the same on Google search as
    shown in the below graphs:

                             Pros                                                Cons

     D3 is open source, which gives you the                   Although D3 provides you the absolute control
     flexibility to work directly with the source              you need to create your own visualization, the
     code and also add your own feature/s                     learning curve is steep and time consuming

     You don’t need additional plug-ins or
                                                              D3, does not allow you to build things right
     technology to make D3 work –
                                                              out-of-the-box
     only a browser is required

     It can be integrated with JavaScript,
     React, Angular-JS, React Native and Bootstrap

     You have complete control: you can customise
     or even create your own visualization as suitable
     for your needs

     D3 is lightweight, fast, works directly with large
     datasets and web standards

     Large community

     Offers high levels of interactivity

4    www.mindtree.com                                                                            ©Mindtree 2020
2. Highcharts
Highcharts is another modern SVG based,
cross-platform charting library. Highcharts is written
in pure JavaScript and contains predefined and
standard charts that enable you to add an
interactive visualization. It provides full API
functionality that allows you to tailor the system
based on the business requirement. It is compatible
with modern browsers including mobile, tablets
and old IEs back to IE6, and it has been in active
development since 2009.

Community:
It is widely used by the community. As of now, 9.7K Github users star the project and NPM Data indicates
that its weekly downloads are around 480,160. It is regularly maintained as it was last published about a
month ago and has zero issues on Github.

                           Pros                                              Cons

                                                          It is not free for commercial use unless you use
    The learning curve is easy and smooth.                it for personal projects, school websites and
                                                          non-profit organizations

    JavaScript libraries (React, Vue and Angular)
    developers can easily integrate Highchart’s
    wrapper to use the charts

    It has detailed documentation and has
    good support

    Wide range of browser support

    Provides good examples

5   www.mindtree.com                                                                         ©Mindtree 2020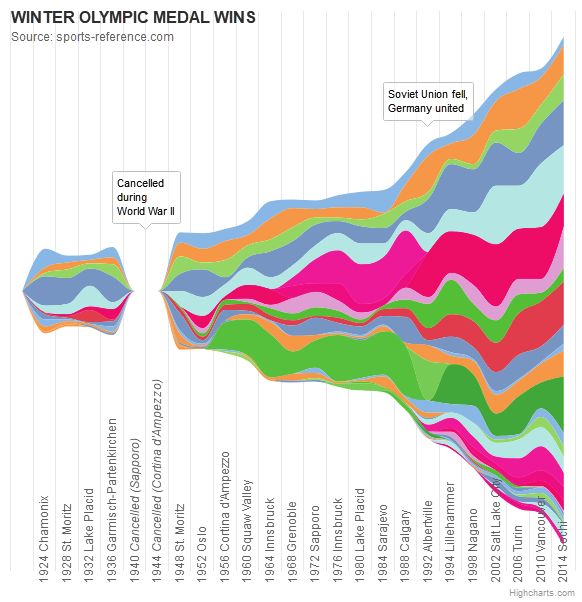
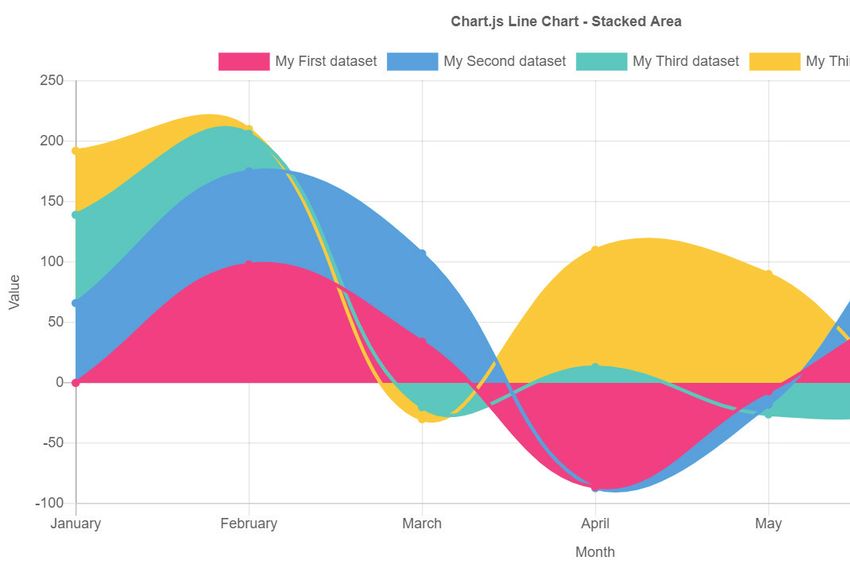
3. ChartJs
ChartJS is a library of open source HTML5 charts for
responsive web applications that use canvas
element. Its 8 chart types enable you to visualize
your data in different ways that are animated and
customisable. However, some charts such as bullet,
funnel, Gantt, Network are not covered by ChartJs.
There are available wrappers for React and Vue
applications if you prefer not to integrate ChartJs
directly.

Community:
It is popular with 50.3K Star in Github and NPM Data of 1,144,858 NPM weekly downloads:

                           Pros                                               Cons

    Lightweight and fast                                   Limited charts – it offers only 8 types of charts

    Continues contribution from its large                  Lack of features such as SVG – its canvas
    community as it is open source                         approach may be not suitable for small data

    Responsive charts – redraws based on the window

    Its canvas-based approach is suitable for large
    dataset with interactivity particularly where
    SVG is not suitable

    Has wrapper for React & Vue

4. Recharts
This library was created specifically for React users. D3
is used under the hood in order to create charts for
React users. It is light and renders on SVG elements to
create simple, customisable and interactive charts. Its
performance is great for static charts. In addition, SVG
based libraries perform better when we have small to
medium size of datasets. Recharts may be slower when
dealing with large datasets or multiple animated charts
on the same page.

6   www.mindtree.com                                                                           ©Mindtree 2020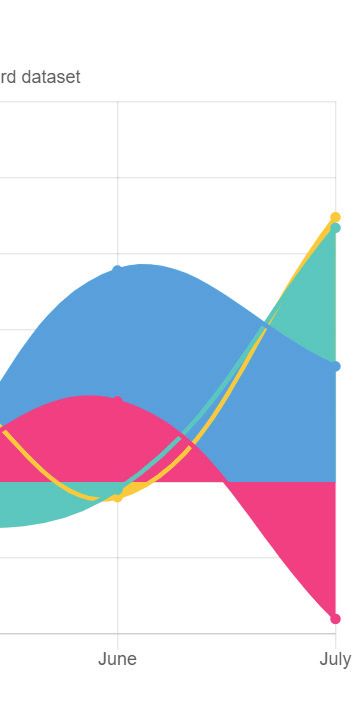
Community:
NPM Data shows that 446,260 users download this library on a weekly basis. The same data also suggest
that the last publish date was 14 days ago. Although 14.8K people have given stars to the library, it has
181 unsolved issues on Github. This indicates that there may be slow response for any issues that may
occur in the future.

                            Pros                                                Cons

    Suitable for React applications as it’s built on
                                                            Lack of multi-platform as it relies on React
    React components

    Renders quickly and smoothly for small data
    and static charts

5. ApexCharts
ApexChart is a new open source library that contains several chart types and is fully responsive (works on
desktops, tablets and mobiles). ApexCharts helps developers create beautiful and interactive visualizations
for web pages that are easy to configure and create charts as it provides great documentation. The library
can be simply integrated with the JavaScript libraries/frameworks such as React, Vue and Angular.
ApexChart provides source code for the examples it shows on its website – you can search for examples
with the preferred JavaScript library/framework such as React or Vue. This enables you to pick up the tool
quickly and adjust it based on your needs.

Community:
127,875 users download the library on a weekly basis according to NPM Data. It is maintained regularly as
the last published date was just two days ago. Although the library is new, it is starred by 9.3K users in
Github. Also, there are 505 unsolved issues which need to be considered before proceeding with this tool.

                            Pros                                                Cons

    Open source                                             Smaller community

    Highly customisable and easy to set up.
    It integrates and supports multiple platforms

    Beautiful design

7   www.mindtree.com                                                                             ©Mindtree 2020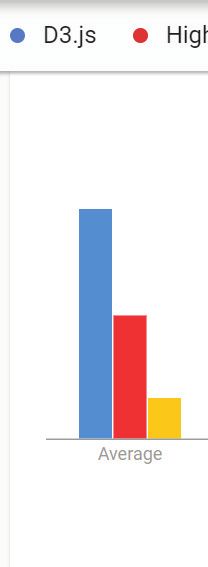
Conclusion:
  We have discussed different types of data visualization tools that can be used for front-end application
  and seen their offerings and community. We have also tried to steer clear of diving into pros and cons for
  each tool. Lastly, the below table shows the kinds of chart types, features, interactivity and rendering
  technologies supported by each mentioned tool:

                                                       Supported Chart Types

 Library
                Free           Line   TimeLine Scatter Area     Pie      Donut    Bullet   Radar    Funnel   Gantt   Network Grouped
  Name

D3.js            Yes           Yes      Yes    Yes    Yes       Yes       Yes      Yes     Yes      Yes      Yes      Yes      Yes

              Free only for
Highchart     personal and     Yes      Yes    Yes    Yes       Yes       Yes      Yes     Yes      Yes      Yes      Yes      Yes
             non-commercial

Chartjs          Yes           Yes      Yes    Yes    Yes       Yes       Yes      No      Yes      No       No       No       Yes

ApexCharts       Yes           Yes      Yes    Yes    Yes       Yes       Yes      No      Yes      No       No       No       Yes

                                                               Other
                       Supported Chart Types                              Interactivity     Rendering technologies      Databinding
                                                              Features
Library                                                                  Mouse             Html 5
             Stacked Negative Discrete Horizontal     3D      Legends          onClick                SVG     VML          AxisXY
 Name                                                                    Over              Canvas
D3.js         Yes        Yes          Yes     Yes     N/A       Yes       Yes       Yes      No       Yes      No            Yes

Highchart     Yes        Yes          Yes     Yes     Yes       Yes       Yes       Yes      No       Yes     Yes            Yes

Chartjs       Yes        Yes          Yes     Yes     N/A       Yes       Yes       Yes      Yes      No       No             No

ApexCharts    Yes        Yes          Yes     Yes     N/A       Yes       Yes       Yes      No       Yes      No            N/A

  References:
  1. https://davidwalsh.name/learning-d3
  2. https://www.d3indepth.com/scales/
  3. https://stackshare.io/d3
  4. https://www.slant.co/versus/10577/11579/~d3-js_vs_highcharts
  5. https://comparisons.financesonline.com/d3-js-vs-highcharts
  6. https://www.highcharts.com/
  7. https://stackoverflow.com/questions/28083421/svg-vs-html5-canvas-based-charts
  8. https://www.wappalyzer.com/technologies/javascript-graphics/chart-js/
  9. https://recharts.org/en-US/
  10. https://www.slant.co/options/21007/~recharts-review
  11. https://www.supermonitoring.com/blog/10-web-apps-for-data-visualization/
  12. https://radiant.digital/insights/2020/03/30/how-atomic-design-is-revolutionizing-enterprise-ux/
  13. https://www.creativebloq.com/web-design/10-reasons-you-should-be-using-atomic-design-61620771
  14. https://en.wikipedia.org/wiki/Comparison_of_JavaScript_charting_libraries
  15. https://www.npmjs.com/package/d3
  16. https://github.com/d3/d3
  17. https://github.com/highcharts/highcharts-dist
  18. https://www.npmjs.com/package/highcharts
  19. https://github.com/chartjs/Chart.js
  20. https://www.npmjs.com/package/chart.js

  www.mindtree.com                                                                                                   ©Mindtree 2020
  8 www.mindtree.com                                                                                                 ©Mindtree 2020
domains such as retail and airline. He is a passionate engineer who works activity to
optimise the application for maximum performance by identifying opportunities for
improvement, designing and implementation. He is eager to learn new technologies and
Daniel Niguse dedicated to solving complex business problems.
About Mindtree
Mindtree [NSE: MINDTREE] is a global technology consulting and services company, helping enterprises marry scale
with agility to achieve competitive advantage. “Born digital,” in 1999 and now a Larsen & Toubro Group Company,
Mindtree applies its deep domain knowledge to 300+ enterprise client engagements to break down silos, make
sense of digital complexity and bring new initiatives to market faster. We enable IT to move at the speed of business,
leveraging emerging technologies and the efficiencies of Continuous Delivery to spur business innovation. Operating
in 18 countries and over 40 offices across the world, we’re consistently regarded as one of the best places to work,
embodied every day by our winning culture made up of over 21,000 entrepreneurial, collaborative and dedicated
“Mindtree Minds.”
www.mindtree.com ©Mindtree 2020You can also read