Adding maps and histograms to App Builder - DEVELOPER LOUNGE LAB - USER CONFERENCE 2011
←
→
Page content transcription
If your browser does not render page correctly, please read the page content below

USER CONFERENCE 2011
SAN FRANCISCO | APRIL 26 – 29

Adding maps and histograms to App Builder
DEVELOPER LOUNGE LAB
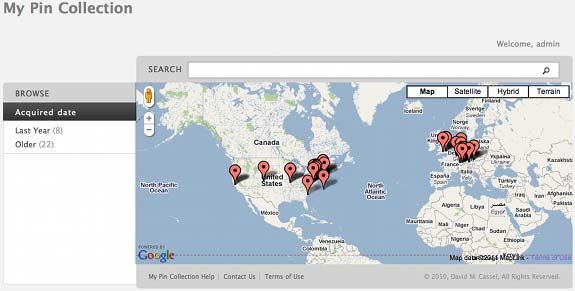
Table of Contents
Introduction ............................................................................................... 4
              Step 1: Load sample data................................................................................ 5
              Step 2: Use Application Builder ......................................................................... 6
              Step 3: Add a map element ............................................................................. 6
              Step 4: Return some data points ....................................................................... 7
              Step 5: Display the points ............................................................................... 8
              Step 6: Include the JavaScript files .................................................................... 9
              Step 7: Gather data for the histogram ................................................................ 11
              Step 8: Style it ........................................................................................... 12
              Step 9: Next Steps, Additional Resources, Etc…..................................................... 14
              Step 10: Get Beer ........................................................................................ 15

© Copyright 2010-2011 MarkLogic Corporation. MarkLogic is a registered trademark and MarkLogic Server is a trademark of
MarkLogic Corporation, all rights reserved. All other product names mentioned herein are the property of their respective owners.
              MarkLogic Corporation                                                                                    3

              Adding maps and histograms to App Builder
Introduction
Using MarkLogic’s Application Builder makes it a snap to put together an application quickly.
Whenever I build a search app this way, I feel like I’ve gotten 80% of what I need. This post shows
how to take the next step and add two features: maps and histograms.
To illustrate these steps, I’m going to use an application I put together to track my souvenir pin
collection. I wanted to keep track of when and where I got each of the pins, and a map is a natural
way to display that. At a high level, here are the steps for adding the map:
Put some sample data in the database
Use Application Builder to generate the basic application
Add an element where the map will appear
Create a module to return some data points
Write JavaScript to make the display
Include the necessary JavaScript files
Next, I’ll add a histogram to visualize when I got my pins. The steps to do that are:
Gather data for the histogram
Style it
Now for the details:

MarkLogic Corporation                                                                      4

Adding maps and histograms to App Builder
Step 1: Load sample data
I decided to go ahead and put part of my pin collection out there in the wild, so that you’ll have
something concrete to use to work through this tutorial. The content can be at:
http://developer.marklogic.com/media/media/learn/apps-and-historgrams-for-appbuilder-
apps/assets.zip.

This document may be found at:

http://developer.marklogic.com/learn/apps-and-histograms-for-appbuilder-
apps.doc

 The structure is nothing special, but it will do the job. Set up your database and load up the data.
The easiest way is with MarkLogic Server 4.2′s new Information Studio. Put a date element range
index on acquired-date (no namespace), you will need it for the histogram. The following steps set
the stage for customizing an Application Builder app:
    1.   Use the Application Services interface (http://localhost:8002) to create your pins
         database. Click on New Database and give it a name (I call it Pins).

    2.   Create a New Flow in Information Studio on port 8002 to load the data:

              a.   Use the Filesystem Directory collector. Click Configure and set the
                   Directory path to the directory in which you copied the pins content.

              b.   In the Load area, select your pins database, then click Document Settings
              c.   Specify “/pins/{$filename}{$dot-ext}” as the URI
              d.   Click Start Loading. You should see 30 documents collected.

    3.   Use the Application Services interface to add the acquired-date index
              a.   Select the pins database and click Configure

              b.   Under Range Indexes, click Add New

              c.   Click on Element Index

              d.   Select “date” as the Data Type, type acquired-date in the Element box and click
                   Find

              e.   Select the acquired-date element and click Done

MarkLogic Corporation                                                                       5

Adding maps and histograms to App Builder
Step 2: Use Application Builder
You can take all the defaults while going through the App Builder wizard, except to make a facet on
acquired-date. Here I deploy to a new app server named MyPins-8042, setting the port to 8042. When
you’re done this step, you should have a standard, out-of-the-box app where you can nose around my
pin collection. If you search for “bell”, you should find my Liberty Bell pin.
Application Builder puts the generated code into a modules database. You can either set up a
WebDAV server or copy the code to your file system using the App Builder Support Package. For
WebDAV, create a new WebDAV server with the MyPins-8042-modules as its database, point your
WebDAV client at the WebDAV app server and edit it there. To use the Support Package to get a copy
to put on the file system and edit that way (in App Builder, click the down arrow next to the
application’s name and choose Support Package from the drop menu; make sure you update the
application server to point to the directory on the filesystem where you unzip). Either way, we’ll be
working in the application/custom/ directory.
Step 3: Add a map element
Our goal here is to put the map on the first page we see. In an App Builder app, pages are identified
by the “view”. Open up application/custom/appfunctions.xqy and find the app:get-
content() function. The first thing you’ll probably notice is that it is commented out. When App
Builder generates an app, it produces standard and modifiable copies of a bunch of functions that
control how the app runs. Close the comment that precedes the function and remove the close-
comment marker at the end of it so that this copy of the function will be in effect.
You’ll notice this line at the top of the function:
let $view := $config:CONTEXT/*:view
This identifies the view. We want to add a div element to house the map on the “intro” view. Here’s
how the function ends up:
declare function app:get-content() {
let $view := $config:CONTEXT/*:view
return
if ($view eq "search") then (
xdmp:apply($config:toolbar),
if (data($config:RESPONSE/@total) eq 0) then
xdmp:apply($config:error-message,
concat("Your search for ",$config:CONTEXT/*:q,
" did not match anything. Make sure all words are spelled correctly or
try different keywords."))
else (
xdmp:apply($config:result-navigation),
xdmp:apply($config:results),
xdmp:apply($config:result-navigation)))
else if ($view eq "detail") then (
xdmp:apply($config:toolbar),
xdmp:apply($config:item-render)
)
else if ($view eq "terms") then
xdmp:apply($config:terms)
else if ($view eq "help") then
xdmp:apply($config:help)
else if ($view eq "contact") then
xdmp:apply($config:contact)
else if ($view eq "intro") then
else xdmp:apply($config:browse)
};
That gives us a place to put our map. Now we need to get some data for it.
MarkLogic Corporation 6
Adding maps and histograms to App BuilderStep 4: Return some data points
This XQuery code retrieves the geo points in the database, along with the pin’s URI and name. (The
where clause is necessary, because when a pin is added, there might be a description of where it
came from without having lat & long.) Save the following to application/custom/get-
points.xqy:
xquery version "1.0-ml";
{
for $pin in cts:search(/pin,
cts:element-query(xs:QName("location"), cts:and-query(())))
where fn:exists($pin/location/lat)
return
/detail{fn:base-uri($pin)}
{$pin/name/text()}
{$pin/location/lat/text()}
{$pin/location/long/text()}
}
Note that this isn’t anything fancy — it’s grabbing all the points. For an application with more data,
you’d probably want to restrict the results to the area showing on the map, and perhaps by other
criteria. To run good geo queries, you’ll want to add a geospatial index. We’ll leave that for another
day and just grab all the data for now.
MarkLogic Corporation 7
Adding maps and histograms to App BuilderStep 5: Display the points
I created an application/custom/js/maps.js file that handles initialization and display of
points. Let’s take a look at that, and then we’ll bring it all together by adding the script include
statements that we need.
function initialize() {
var latlng = new google.maps.LatLng(-34.397, 150.644);
var myOptions = {
zoom: 8,
center: latlng,
mapTypeId: google.maps.MapTypeId.ROADMAP
};
var map = new google.maps.Map(document.getElementById("map"),
myOptions);
loadPoints(map);
}
$(document).ready(function() {
initialize();
});
function buildMarkerClickEventHandler(marker, href) {
google.maps.event.addListener(marker, 'click', function() {
window.location = href;
});
};
function loadPoints(map) {
$.ajax({
url: "/custom/get-points.xqy",
contentType: "xml",
success: function(data) {
var bounds = new google.maps.LatLngBounds();
$(data).find("location").each(function(index) {
var lat = $(this).find("lat").text();
var long = $(this).find("long").text();
var marker = new google.maps.Marker({
position: new google.maps.LatLng(lat, long),
map: map,
title: $(this).find("name").text()
});
buildMarkerClickEventHandler(marker, $(this).find("url").text());
bounds.extend(new google.maps.LatLng(lat, long));
});
map.fitBounds(bounds);
}
});
};
We have an initialize() function that gets called when the page is ready. The initialize()
function creates a map in the div element that we created to hold the map in step 3. It then calls
loadPoints(), which makes an AJAX call back to the module we created in step 4. The results
come back as XML. I use jQuery to parse through the results, create a set of markers, and figure out
the correct bounds for the map so that it is zoomed just right to display our data. If you click on one
of the markers, that will take you to the detail page for the individual pin (take another look at the
get-points.xqy module and you’ll see that set up in the url element).
You may be looking at the code wondering why I made a buildMarkerClickEventHandler()
function instead of just creating the listener inline within loadPoints(). In a word, closure. To
keep this focused, I’ll leave a more detailed explanation for another day.
You’ll also need to download jQuery, as I’m using that in my script. Put it in
application/custom/js/ (there’s a copy in the Software directory on the class media).
MarkLogic Corporation 8
Adding maps and histograms to App BuilderStep 6: Include the JavaScript files
Now to bring it all together. We have the pieces; what’s missing is that they aren’t being used yet.
To add the JavaScript includes, let’s return to application/custom/appfunctions.xqy and
take a look at app:js(). Remove the comment markers so that this function will get used. In this
function we can add more includes. We can make them across-the-board or specific to a view. There
are three JavaScript files we need: jQuery, Google Maps, and our own maps.js. jQuery is something
that will likely get used a lot (at least the way I write), so I add that to the list of includes at the top
of the function. After that, we’ll add the Google maps include and maps.js, but only on the intro
view. Here’s how the function looks when we’re done:
(:~
: Base script elements for Javascript.
:)
declare function app:js()
as element()*
{
(,
,
,
,
,
,
,
,
(: add this (your jquery file may be a different version) ... :)
,
$config:ADDITIONAL-JS,
(: and this... :)
if ($config:CONTEXT/*:view = ("intro")) then (
,
)
else (),
// Sort menu
{
if (count(
$config:OPTIONS/search:operator[@name eq "sort"]/search:state) >
0)
then
concat('var sort_menu_content = [',
xdmp:apply($config:sort-menu-content,
$config:OPTIONS,$config:CONTEXT/*:q,$config:LABELS),']')
else ()
}
// Category toggle
var toggle_list_size =
[{ xdmp:apply($config:facet-toggle-content,$config:OPTIONS) }]
new ListToggler(toggle_list_size);
)
};
MarkLogic Corporation 9
Adding maps and histograms to App BuilderThe inline comments mark what we’re adding. Remember to un-comment the function by moving the close-comment marker from the end to before the function, just after the preceding comment. At this point, you should have a working map. Not only will it show where the pins came from, but you can click on them to get to the detailed listing. MarkLogic Corporation 10 Adding maps and histograms to App Builder
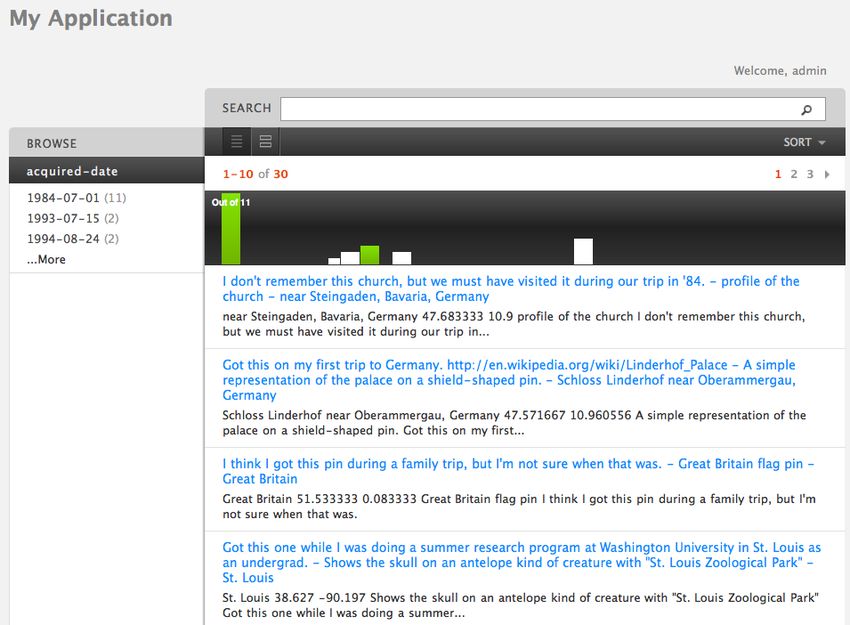
Step 7: Gather data for the histogram
Next step: let’s get the histogram to show when I got the pins. The first thing we need is some data.
The changes we need to make are in the app:results() function in appfunctions.xqy. We’ll
set up one bucket for each year – they could be any period you want. In particular, there will be one
bucket for each year starting with the earliest pin in the current results, and ending with the latest.
For scaling, we’ll also identify the highest value among our results. Then we’ll loop through the
buckets to produce a bar for each one. Here’s my revised app:results() function:
declare function app:results()
as element(div)
{

     {
      let $query as cts:query := cts:query($config:RESPONSE/search:query/*)
      let $qname := fn:QName("", "acquired-date")
      let $earliest :=
         cts:element-values($qname, (), ("ascending", "limit=1"), $query)
      let $latest :=
         cts:element-values($qname, (), ("descending", "limit=1"), $query)
      let $buckets as xs:date+ :=
         for $year in (fn:year-from-date($earliest)
                      to fn:year-from-date($latest))
         return xs:date(fn:concat($year, "-01-01"))
      (: Get the maximum value so the bars scale correctly :)
      let $MAX := cts:frequency(cts:element-value-ranges(
         fn:QName("", "acquired-date"),
         $buckets,
         ("frequency-order", "limit=1"),
         $query
      ))
      return
         (Out of {fn:format-number($MAX, "#,###")},
          (: Loop through the actual buckets :)
          for $r at $i in
            cts:element-value-ranges(
              fn:QName("", "acquired-date"),
              $buckets,
              "empties",
              $query
            )
          let $HT := 80
          let $f := cts:frequency($r)
          let $h := floor(xs:float($f) div xs:float($MAX) * $HT)
          return
            {$h}: {$f}
         )
     }

    {
      for $result in $config:RESPONSE/search:result
      return xdmp:apply($config:transform-result, $result)
    }

};

MarkLogic Corporation                                                                       11

Adding maps and histograms to App Builder
Step 8: Style it
You’ll notice a bit of the styling is taking place in the code. The reason is that the height of the bar is
based on the value itself. The rest of it goes in application/custom/appcss.css.
.incident-histogram {
position: relative;
overflow: hidden;
background: #333;
height: 80px;
padding: 0.25em 0.25em 0 1.5em;
border-bottom: solid 1px;
}
.incident-histogram .bar {
display: block;
margin-right: 1px;
background: #fff;
text-indent: -10000em;
width: 3px;
float: left;
}
.incident-histogram .bar:nth-of-type(10n+1) {
background: -webkit-gradient(linear, 0% 0%, 0% 100%, from(#84E400), to(#70B400));
}
.incident-histogram .max {
position: absolute;
top: -4px;
left: 8px;
color: white;
font-size: 75%;
font-weight: bold;
font-family: Helvetica;
}
That’s all there is to it – now a histogram will show up with your results.
MarkLogic Corporation 12
Adding maps and histograms to App BuilderMarkLogic Corporation 13 Adding maps and histograms to App Builder
Step 9: Next Steps, Additional Resources, Etc…
If you want to explore some similar changes, try your hand at the following:
• adding the map to the results page along with the histogram – make it less tall than the front
page one
• adding the histogram to the first page
• Use Application Builder to change how the result list display is formatted. Redeploy (if you
exported the code to the file system, you’ll need to do that step again; make sure you don’t
overwrite the custom directory).
You can find additional information at the following locations:
Download MarkLogic Server at http://developer.marklogic.com/products
Find documentation, tutorials and more at http://developer.marklogic.com/
http://developer.marklogic.com/media/media/learn/apps-and-historgrams-for-appbuilder-
apps/assets.zip.
http://developer.marklogic.com/learn/apps-and-histograms-for-appbuilder-apps.doc
MarkLogic Corporation 14
Adding maps and histograms to App BuilderStep 10: Get Beer MarkLogic Corporation 15 Adding maps and histograms to App Builder
You can also read