Indian Ocean Surface Circulations and Their Connection To Indian Ocean Dipole, Identified From Ocean Surface Currents Analysis Realtime (OSCAR) ...
←
→
Page content transcription
If your browser does not render page correctly, please read the page content below
Indian Ocean Surface Circulations and Their
Connection To Indian Ocean Dipole, Identified
From Ocean Surface Currents Analysis Realtime
               (OSCAR) Data
                         By
               LT. Haris Sarwar Rana
                   Pakistan Navy

                Advisor : Peter C Chu
          Second Reader : Charles Sun (NOAA)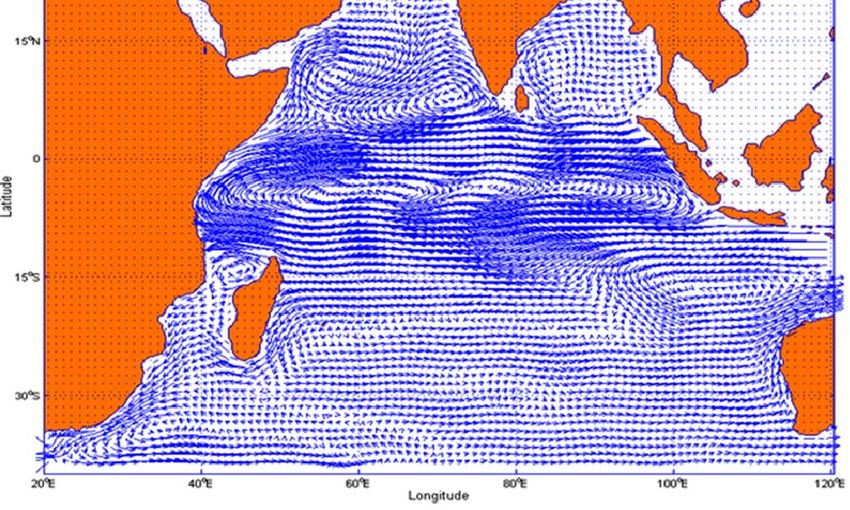
Outline Introduction Indian Ocean and its Importance OSCAR database Seasonal Variability Indian Ocean Dipole Operational and Scientific Applications Future Research
Introduction
Seasonal variability derived from the satellite altimetry
showed realistic Ocean Circulation patterns.
Indian Ocean Dipole Events renders Adverse weather
effects on Eastern and Western tropics of the Indian
Ocean, one end have heavy rains/floods and the other
side experience droughts/wild fires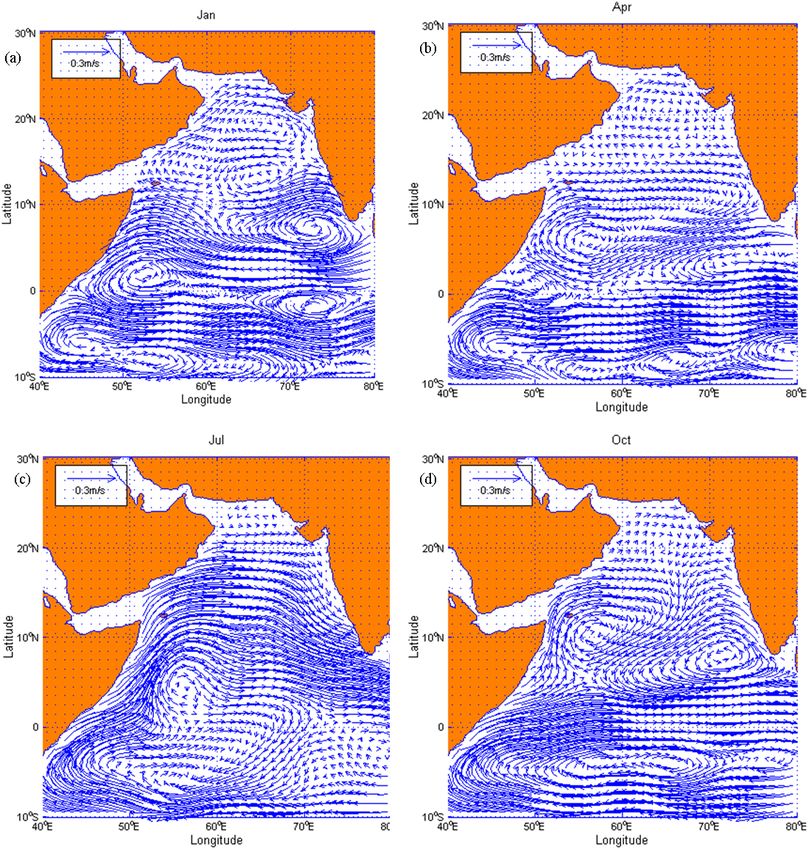
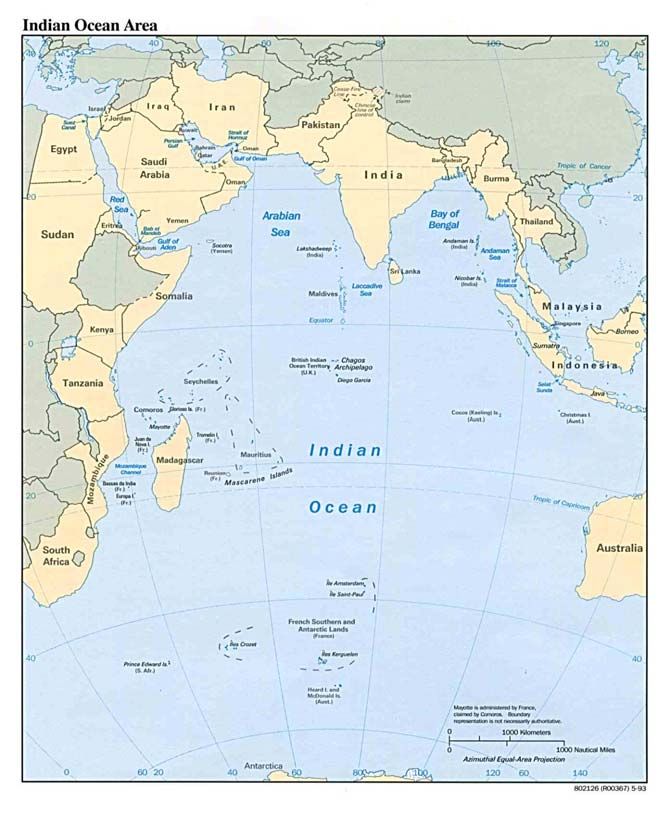
Indian Ocean
North South Extent 9600 Km
East West Extent 7800 Km
Total Area 74.1 x 10⁶ Km2
Sea trade can be traced to ancient
times
Until mid 1800 no nation
dominated the region completely
when British took control of most
of surrounding parts
In present mostly India and
Australia dominate the region but
after the fall of twin towers in US
now in context to Global war
against terror the US led coalition
forces are also making a difference
in overall dominance in the region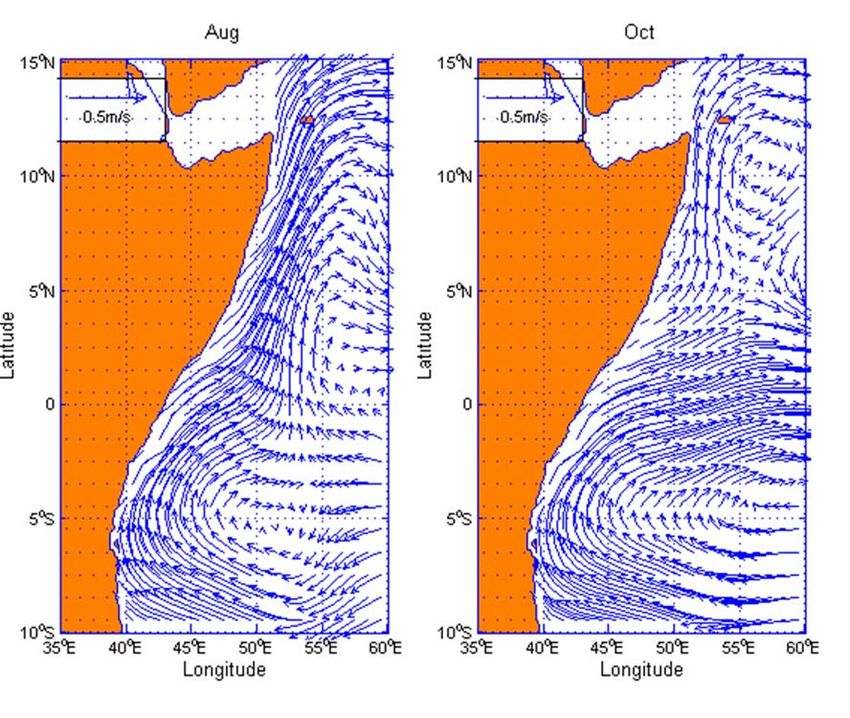
Economic Importance

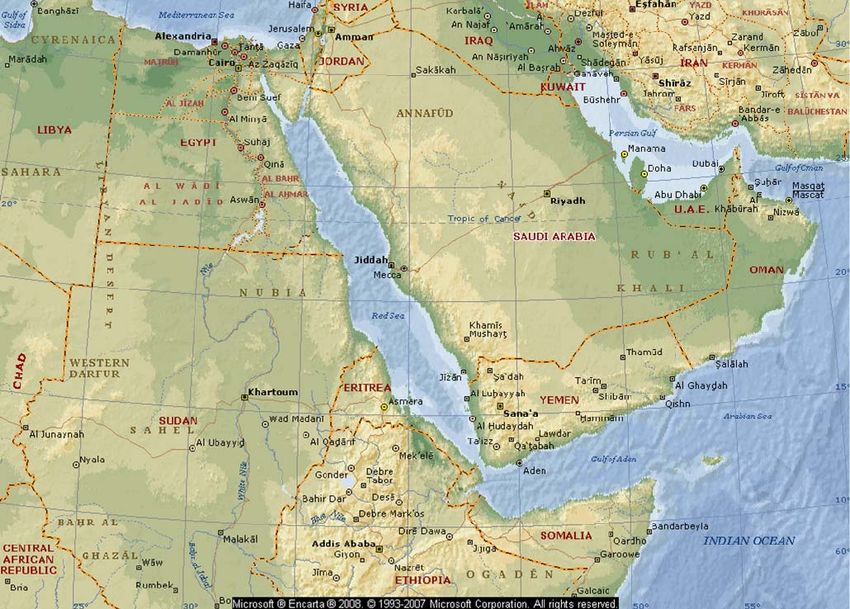
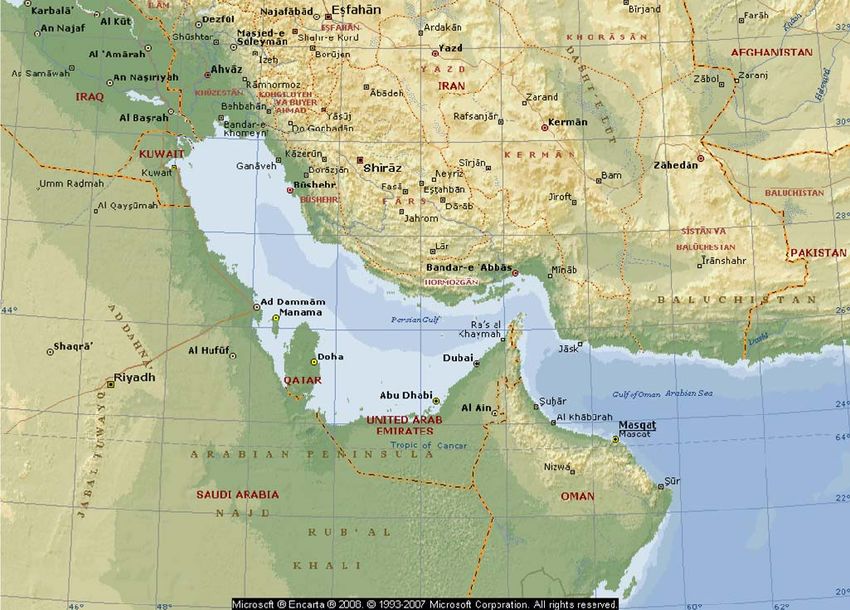
Indian Ocean Houses some of the most busiest
     waterways in the world which include: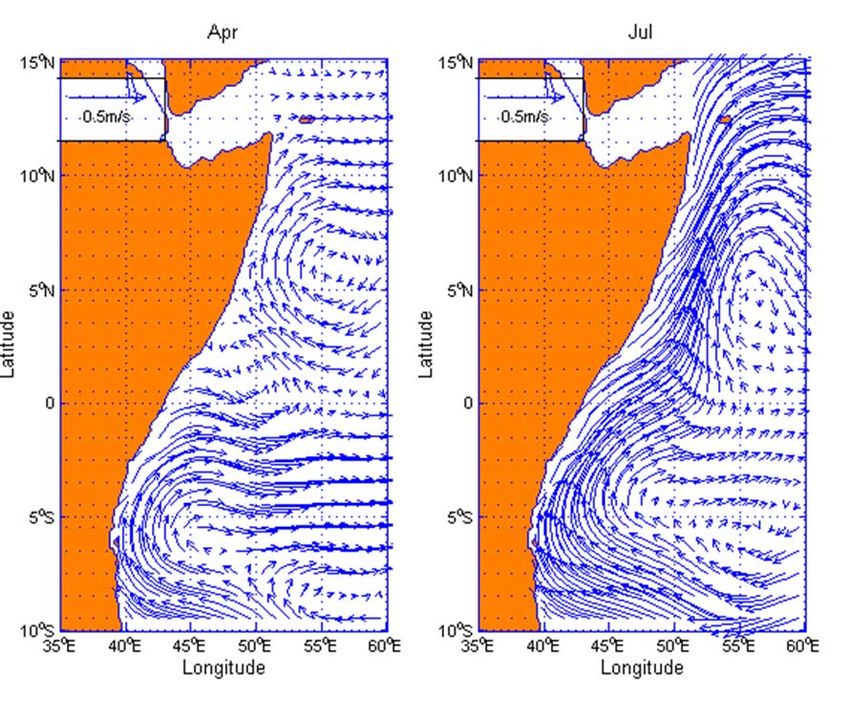
Persian Gulf and Strait of Hormuz

       Persian Gulf

                      Strait of Hormuz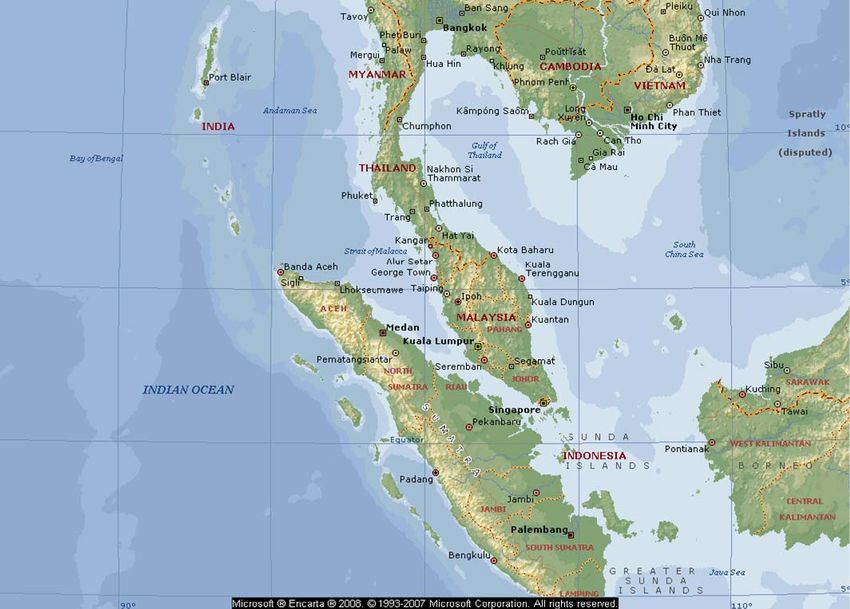
Red Sea and the Suez Canal

The Suez Canal

                     Strait of Bab el Mandeb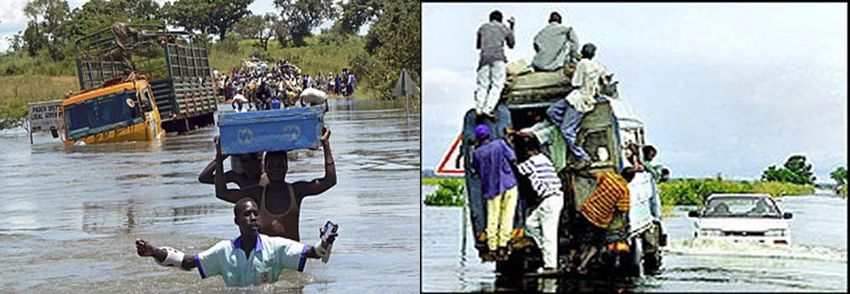
Strait of Malacca

Strait of Malacca
Economic Importance
Indian Ocean Houses some of the most busiest waterways
in the world ( Strait of Hormuz, Strait of Bab el Mandeb,
Strait of Malacca)
Approx 40% world offshore oil production
World’s bigger economies Europe, Japan And US import
approx 70%, 76% and 25% oil from the Gulf region
World’s growing Appetite for oil will make this region more
and more important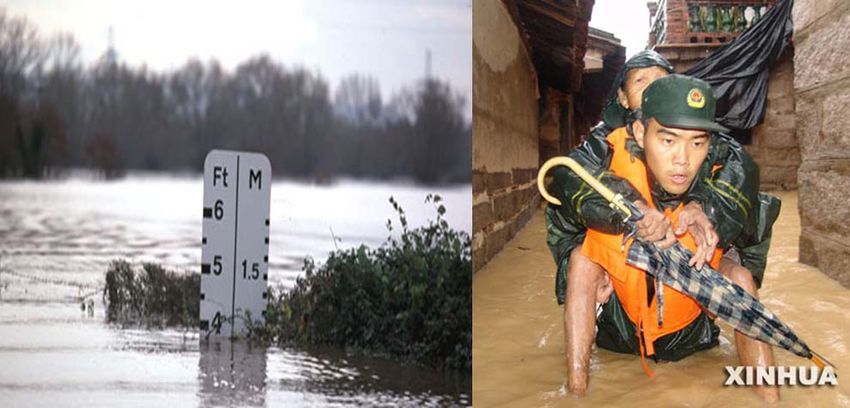
Political and Operational Importance
Peace and Stability in the Gulf
region is essential for safer trade
Continuous patrolling of Coalition
Forces In the Region
China’s greater interest in Indian
Ocean waters
Iran’s Ambitions to go Nuclear
Afghanistan’s Instability and
disrupting Al-Qaida’s network
Iraq’s InstabilityOcean Surface Currents Analysis – Realtime
(OSCAR) Data Base
Ocean Surface currents data available for whole world’
oceans at www.oscar.noaa.gov
Ocean Currents are computed from Sea Surface Height
(SSH) data which is derived from satellite based altimeters
JASON-1, GFO, Envisat and wind data which is derived
from QUICKSCAT satellite
Data continuously available after every 5 days
Data can either be downloaded for subsequent analysis or
can be instantly displayed
The JavaScript-based user interface provides users great
flexibility in extraction or display of the dataUser Interfaces
User Interfaces
Online Display

Lat-Long Map plot            Time Series plot
The Optimal Spectral Decomposition
                       (OSD) Data Refinement Method
Besides all good Major weakness of OSCAR data is its inability to
reveal realistic coastal boundary currents and also Data is quite Noisy
                                                Original Data 2007 Jan 4

                o
               60 N
                                            Kuroshio                  Gulf Stream
                         0.8(m/s)

                o
               30 N
    Latitude

                     0

                 o
               30 S

                 o
               60 S

                         60oE          o
                                    120 E           180                    o
                                                                       120 W
                                                                                     o
                                                                                    60 W   0

                                                          Longitude
OSCAR Currents after applying OSD
The resultant Current field is much more realistic and adequately true
depiction of lateral boundary current can be seen (Method Developed
at NOAP in NPS headed by Professor Peter Chu)
OSD smooth data 2007 Jan 4
0.8(m/s)
60oN Kuroshio Gulf Stream
30oN
Latitude
0
30oS
o
60 S
o
60 E 120oE 180 120oW 60oW 0
LongitudeThe Monsoon Winds
The Southwest or Summer Monsoon
Deep low pressure develops over
Northern Arabia and Pakistan
and a zone of High Pressure
over the Ocean
Pressure gradient over the
Ocean is large about 22 hPa
Resultant winds are strong and
humid
Southwest Monsoon brings the
well-known Monsoon rains and
floods to the southern part of
AsiaThe Northeast or Winter Monsoon
High pressure develops over the
Indian Land mass and a zone of
low pressure over the ocean
Air pressure gradient over the
ocean is small as compared to
Summer about 6 hPa
Resultant winds are dry and
have moderate force
Winter season is dry over most
of southern AsiaSeasonal Variability
Data Processing
Ocean Surface Currents Analysis (OSCAR) data was extracted
from 1993 to 2006
Monthly mean surface currents were calculated from the
reconstructed OSCAR data
Visuals for the whole Indian Ocean during the two Monsoon
Regimes were Analyzed
Ocean Surface currents variability as derived from the altimetry
data in detail was analyzed for three most Dynamic regions of
Somali Current, North Arabian Sea and the Bay of Bengal
Side by side comparison with the previous studies showed that
the data set produced true surface circulation patterns.Indian Ocean During Summer
Southwest
Monsoon
Current
Great Whirl
Somali Current
Southern Gyre
South Equatorial
CurrentIndian Ocean During Winter
Northeast
Lacadive High Monsoon
Current
Great Whirl
South Equatorial
Somali Current Countercurrent
Southern Gyre
South Equatorial
CurrentThe Somali Current
Great Whirl
Southern Gyre
East African
Coast CurrentThe Somali Current
Great WhirlComparison With Previous Studies From: Schott & McCreary, 2001
The North Arabian Sea

                        Lacadive Low
Bay of Bengal East Indian Coast Current
Indian Ocean Dipole and
Eastward Equatorial Jets
Indian Ocean Dipole (IOD)
Discovered in 1999, by Professor Yamagata and
Dr. Saji
An inter-annually occurring climate mode in the
tropical parts of the Indian Ocean
Typical to other climate oscillations the IOD
climate mode also has a ‘positive’ and a ‘negative’
phase
IOD events usually occure during the transition
period between MonsoonsPositive Dipole Mode Event
SST rises in the western
equatorial Indian Ocean and
drops in the Southeastern Part
of the Indian Ocean
Normal convection situated
over the eastern Indian Ocean
warm pool shifts to the west
Heavy rainfall over eastern
Africa and severe droughts/
Forest fires over the Indonesian
region.Negative Dipole Mode Event
SST rises in the Eastern
Equatorial Indian Ocean and
drops in the Western Part of
the Indian Ocean
Heavy rainfall over
Indonesian Region and severe
droughts/ Forest fires over the
East African region.The Eastward Equatorial Jet (Wyrtki Jet)
Appear in Indian Ocean
equatorial Region during
transition period between
Wyrtki Jets Monsoons
Several studies in past
used Models to show that
these jet weakens in a
Positive IOD event and
strengthens in a Negative
IOD event
In context to Surface
circulations this is the most
prominent feature which
can be further analyzed to
see its connection to Dipole
Mode eventsDipole Mode Index
Strength of IOD events are represented by the
Dipole Mode Index (DMI)
Defined as the zonal difference of sea surface
temperature anomaly between the tropical western
Indian Ocean (50oE-70oE, 10oS-10oN) and the
southeastern Indian Ocean (90oE-110oE, 10os-
Equator)Time Series of DMI +ve -ve
Anomalies During A Positive
   Dipole Mode Event
Zonal Currents Anomalies along the Equator During
                    Positive IOD

Large Negative
  Anomalies
Vector Currents Anomalies During a Positive IOD
Anomalies During A Negative
    Dipole Mode Event
Zonal Currents Anomalies along the Equator During
Negative IOD
Positive
AnomaliesVector Currents Anomalies During a Negative IOD
Results
Positive Dipole Event ---- Equatorial Jets
Weakens
Negative Dipole Event ---- Equatorial Jets
StrengthensOperational Applications
Ocean Currents and Mine Warfare
Integral Part of Naval warfare
Most cost effective weapons as it is inexpensive, easy to
conceal, easy to deploy, and almost requires no
maintenance
Mines can be used strategically and tactically for
denying access and defense of vital facilities
One of the important types of mine is the drifting mine,
used to completely deny access of friend and foe to
certain space
Deploying locations of the mines could be decided by
knowing the most recent surface circulation patternSearch and Rescue at Sea
In both peacetime and battle space environments,
search and rescue operations require meticulous
planning and careful execution
ocean surface circulation is the most important factor
to be kept in min before planning a search and rescue
operation
Used to estimate the likely position of men and material
to be rescued
Rescue effort can concentrate in a smaller and more
probable area of interceptionPlanning for an Economical Passage
Ocean circulation patterns could be used to plan for a
more economical passage
without jeopardizing the shortest route, routes that are
along the general flow of the ocean can be planned
Save both fuel and timeMonitoring Chemical Pollutants and Oil Spills
In an event of intentional or unintentional spills of
chemical pollutants and oil, ocean surface currents
could be used to determine how fast and far the spill
could go
Especially true in the coastal regions with very fast
surface currents, such as the Gulf Stream, Kuroshio,
and Somali Current.
Good knowledge of surface currents will tell us how
fast to act in terms of remedial measuresScientific Applications
Ocean Currents as a Source of Energy
In today’s industrialized world, the importance of
sustainable energy sources cannot be undermined
Bigger economies of the world are always looking for
newer ways to produce good amounts of energy
If only 1/1000 of the energy in Gulf Stream is utilized, it
will be about 21,000 times more energy than in the
Niagara Falls
Estimated world wide power in world’s ocean is about
5,000 GW with the power densities of about 15 KW/m2
(Technology White paper 2006)Large-Scale Climate and Synoptic Diagnostics
OSCAR data is regularly available, with 1° x 1° resolution
therefore it can be used for large-scale synoptic
diagnostics
Different large-scale features in the ocean surface
currents could be analyzed regularly to see the variability
such as IOD events, Large Scale Eddies …..etc
Change in general surface circulation behavior can be
analyzed or used for large-scale climate diagnosticsFuture Research
OSCAR Data can be used to Analyze Ocean Surface
circulations in other parts of the world as well.
With considerable refinement (OSD) and correct
methodology this data can also be utilized to examine large
scale phenomena such as El Nino, La Nino….. etcQuestions ?
Thank You !!
You can also read


