TRELLIDOR HOLDINGS LIMITED - HALF YEAR RESULTS ENDING 31 DECEMBER 2019
←
→
Page content transcription
If your browser does not render page correctly, please read the page content below

TRELLIDOR HOLDINGS LIMITED
HALF YEAR RESULTS ENDING 31 DECEMBER 2019

STRATEGIC OBJECTIVES FOR 2020
 As reported in the 2019 year ended results, key strategic objectives set for
 the Group were as follows:
                                                                                     TERRY DENNISON
                                                                                        GROUP CEO
 ➢ Continue with the share-buy buy program

 ➢ Optimising our balance sheet by increasing gearing to finance long-term organic
    growth

 ➢ Ongoing focus on cash generation and return on invested capital

 ➢ Enhancement of route to market in South Africa and abroad to facilitate growth

 ➢ Improving operational efficiencies and active cost management within the Group

 ➢ Introduction of new products both locally and abroad

                                         2
STRATEGIC OBJECTIVES UPDATE
 Continue with the share-buy back program:
 ➢ Repurchase of 5 561 547 Group shares out of cash resources at an aggregate value of
                                                                                          TERRY DENNISON
                                                                                             GROUP CEO
    R22 million at an average price per share of R3.94

 Optimising our balance sheet by increasing gearing to finance long-term
 organic growth
 ➢ Re-financed and increased existing debt facilities which resulted in the Debt/EBITDA
    ratio increasing to 1.4x from 0.9x

 ➢ The additional debt will be utilised to fund organic growth strategies

                                          3
STRATEGIC OBJECTIVES UPDATE
 Ongoing focus on cash generation and return on invested capital
 ➢ Net cash from operating activities grew by 27% compared to the prior period
                                                                                       TERRY DENNISON
                                                                                          GROUP CEO
 ➢ Achieved an 19% reduction in Taylor’s inventory over the comparative period while
    maintaining supply requirements

                                        4
STRATEGIC OBJECTIVES UPDATE
 Enhancement of route to market in South Africa and abroad to facilitate
 growth
                                                                                         TERRY DENNISON
                                                                                            GROUP CEO
 ➢ Our recently acquired Durbanville franchise achieved growth of 24% in the current
    reporting period

 ➢ Sale and purchase agreements to acquire 3 franchises in the eThekwini Metro area
    have been concluded in H2 2020 with the aim replicating the success of Durbanville

 ➢ Growth in Africa of 22%, including 19% in Ghana, year-on-year

 ➢ Research on replicating “Ghana Model” in East Africa completed and investment will
    be limited to supporting the existing franchisee

 ➢ Taylor products sold through the Trellidor network grew by a further 6%

                                          5
STRATEGIC OBJECTIVES UPDATE
 Improving operational efficiencies and active cost management within the
 Group:
                                                                                     TERRY DENNISON
                                                                                        GROUP CEO
 ➢ Gross margins were relatively flat despite a reduction in revenue

 ➢ Overheads were well managed below inflation, increasing by 1.5%

 ➢ The following measures in Taylor were implemented during the reporting period:
     ▪    Recruitment of a new production manager

     ▪    Redesign of the manufacturing process

     ▪    Changes to the purchasing methodology and suppliers

     ▪    We remain on track to implement phase 2 of the ERP system during H2 2020

                                             6
STRATEGIC OBJECTIVES UPDATE
 Introduction of new products both locally and abroad:
 ➢ Both businesses are in the development stages of new products for both the local
                                                                                      TERRY DENNISON
                                                                                         GROUP CEO
    and international market

 ➢ Product launches are planned for the remainder of the 2020 calendar year

                                         7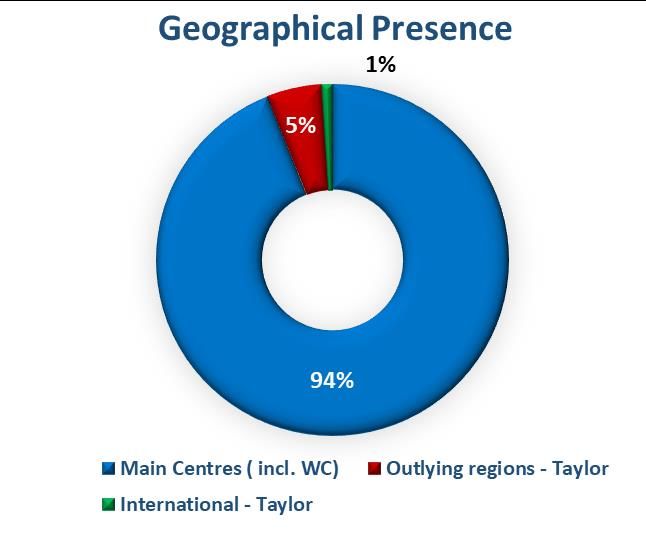
PROSPECTS
Share-buy back program
 ➢ The current share price continues to undervalue the business and so we will
                                                                                       TERRY DENNISON
                                                                                          GROUP CEO
    continue to apply excess cash to buy-back shares to enhance shareholder value

Enhancement of route to market in South Africa and abroad to facilitate
growth
 ➢ The launch of the Durban Sales Branch to drive sales growth including the focused
    integration of the Taylor product set and brand in the region

                                          8
PROSPECTS
Improving operational efficiencies and active cost management within the
Group
                                                                                      TERRY DENNISON
                                                                                         GROUP CEO
 ➢ The weak economic environment is anticipated to continue and as result the tight
    control of operational overheads and focus on margin retention will persist

 ➢ Group buying strategies of raw materials are expected to start yielding margin
    improvement in Taylor through the 2020 calendar year

 ➢ Implementation of centralized administration for the branches to facilitate cost
    efficient organic growth

                                          9
PROSPECTS
The Group remains focused on its core growth strategies of which the
Board believes will position it to benefit from any improving economic
                                                                         TERRY DENNISON
                                                                            GROUP CEO
conditions:
 ➢ Brand leadership

 ➢ Diversifying its product range

 ➢ Distribution enhancement

 ➢ Growth in South Africa, Africa and the UK

                                       10
GROUP FINANCIAL OVERVIEW
ADOPTION OF IFRS 16: LEASES
 The Group has adopted IFRS 16 from 1 July 2019 using the modified
 retrospective transition method and therefore comparative figures have not
 been restated.
                                                                                    DAMIAN JUDGE
 These lease liabilities are measured at the present value of the remaining lease     GROUP CFO

 payments, discounted using the lessee’s incremental borrowing rate as of 1 July
 2019.

                                      12
ADOPTION OF IFRS 16: LEASES
UNAUDITED
AT 31
DECEMBER
2019 DAMIAN JUDGE
R’000 GROUP CFO
CONSOLIDATED STATEMENT OF PROFIT OR LOSS AND OTHER COMPREHENSIVE INCOME
Reduction of lease rental expense 4 103
Depreciation of right-of-use asset (‘RoU’) (3 760)
Finance costs in respect of lease liability (941)
REDUCTION IN PROFIT BEFORE TAX (598)
CONSOLIDATED STATEMENT OF FINANCIAL POSITION
Right-of-use asset
RoU asset recognised on 1 July 2019 17 976
RoU asset recognised subsequent to 1 July 2019 662
Depreciation for the period (3 760)
INCREASE IN ASSETS 14 878
13ADOPTION OF IFRS 16: LEASES
UNAUDITED
AT 31
DECEMBER
2019
R’000 DAMIAN JUDGE
EQUITY GROUP CFO
Retrospective adjustment to opening retained earnings at 1 July 2019 -
Movement for the period (598)
DECREASE IN RETAINED EARNINGS (598)
DEFERRED TAX ASSET
Retrospective adjustment to deferred tax asset at 1 July 2019 -
Movement for the period (165)
INCREASE IN DEFERRED TAX ASSET (165)
FINANCE LEASE LIABILITY
Lease liability recognised as at 1 July 2019 (17 976)
Lease liability recognised subsequent to 1 July 2019 (662)
Add: Finance cost (941)
Less: Lease payments 4 103
INCREASE IN FINANCIAL LIABILITIES (15 476)
14GROUP FINANCIAL PERFORMANCE
HY 20 vs
Group financial performance (R'm) FY 2018 HY 2019 FY 2019 HY 2020 HY 19
Revenue 539.0 286.2 514.9 274.8 -4%
DAMIAN JUDGE
Gross profit 245.9 128.9 231.9 122.5 -5% GROUP CFO
EBITDA 103.5 55.7 81.2 49.1 -12%
Profit after tax 59.6 32.6 43.0 26.8 -18%
Dividends paid 32.9 17.4 27.2 11.7 -33%
Diluted EPS (cents) 54.4 29.8 40.0 25.1 -16%
Diluted HEPS (cents) 54.3 29.8 40.1 25.6 -14%
Gross margin 45.6% 45.0% 45.0% 44.6%
EBITDA margin 19.2% 19.5% 15.8% 17.9%
Weighted avg shares in issue (millions) 108.0 107.6 107.2 104.6
15GROUP FINANCIAL PERFORMANCE
Adverse economic conditions in
RSA continue
DAMIAN JUDGE
GROUP CFO
As a result the Group revenue is
down 4% year-on-year
The decline highlights the
importance of the sales growth
strategies being implemented
16GROUP FINANCIAL PERFORMANCE
EBITDA declined due to:
➢ Lower volumes in tough economic
conditions
DAMIAN JUDGE
➢ Inflationary impact on input costs GROUP CFO
Mitigating factors:
➢ Improved factory efficiencies in Trellidor
➢ Tighter cost controls across the Group
Future interventions:
➢ Centralising of IT, payroll and branch
accounting to improve controls and lower
costs
➢ Trellidor production and cost system being
implemented in Taylor factory
➢ Group procurement from suppliers with
synergy across the operations
17GROUP BALANCE SHEET
Debt/Equity ratio of 51% (2019:
39%) DAMIAN JUDGE
GROUP CFO
Debt/EBITDA ratio of 1.4x (2019:
0.9x)
Interest bearing debt of R110m
(2019: R90m) Ratios HY 2018 FY 2018 HY 2019 FY 2019 HY 2020
Debt/Equity 47% 43% 39% 35% 51%
Interest Cover 11.7x 9.6x 10.7x 7.9x 8.4x
18GROUP NET WORKING CAPITAL
Reduction in inventory coincides
with a reduction in payables DAMIAN JUDGE
GROUP CFO
Accounts receivable are in line
with trading
Group procurement initiative
has resulted in a targeted
inventory reduction in Taylor
19GROUP SUMMARISED CASH FLOW
DAMIAN JUDGE
GROUP CFO
20CAPITAL ALLOCATION
Return to shareholders
➢ Final dividend of R12m (2019: R17m)
DAMIAN JUDGE
➢ R22m spent on the buy-back of 5 561 547 shares at an average price GROUP CFO
of R3.94 per share
Debt Servicing
➢ Paydown interest bearing liabilities prior to refinancing of R11m
➢ Net interest R4.5m
21CAPITAL ALLOCATION
CAPEX
➢ R3.6m which is in line with our targeted spend and equals DAMIAN JUDGE
depreciation GROUP CFO
H2 2020 Key Capital Commitments
➢ R11m to acquire four local franchise operations has been deployed
22SEGMENTS
TRELLIDOR – SALES ANALYSIS
 Overall revenue has declined by 7% across the
 Trellidor markets

 International revenue growth of 6% driven by a                                                                 DAMIAN JUDGE
                                                                                                                  GROUP CFO
 strong performance on the African continent
 with African sales growing 22%

 The Ghana operation showed pleasing results
 with a 19% growth year-on-year

 There was a weaker performance in the UK
 which is coming off a strong 2019 base          Geographical Presence         HY 2019    FY 2019    HY 2020
                                                 Main centres (DBN, CPT, GP)        37%        37%        36%
                                                 Outlying regions (RSA)             43%        42%        43%
                                                 Africa                             15%        16%        19%
                                                 International (UK, Israel)          5%         5%         2%

                                         24
TRELLIDOR – SALES ANALYSIS
Diversified product range spans income
groups which mitigates weak middle and
upper middle class economy
DAMIAN JUDGE
GROUP CFO
The product mix remains consistent with
prior periods
It is pleasing to note the relatively
improved performance of Traditional
Trellidor products which were driven
primarily by International sales
25TRELLIDOR – TRADING MARGIN
Improved trading margin despite muted
sales
DAMIAN JUDGE
There has been a slight increase in wage GROUP CFO
cost % as result of semi-variable costs not
being fully recovered
Slight materials efficiency achieved
through the mix of sales in line with the
improved performance of Traditional
Trellidor product
26SEGMENTS
TAYLOR – SALES ANALYSIS
 A slight recovery in the Western Cape economy
 has resulted in Taylor showing revenue growth
 of 1.3%, despite weaker sales in Gauteng
                                                                                                               DAMIAN JUDGE
                                                                                                                 GROUP CFO

 Sales of Taylor products through the Trellidor
 Franchise network grew 6%, reflecting the
 continued success of this initiative

                                                  Geographical Presence       HY 2019    FY 2019    HY 2020
                                                  Main centres (incl. WC)          94%        95%        94%
                                                  Outlying regions (Taylor)         5%         4%         5%
                                                  International (Taylor)            1%         1%         1%

                                           28
TAYLOR – SALES ANALYSIS
Turnover well spread across product types
Constant innovation and development to keep
up with trends DAMIAN JUDGE
GROUP CFO
It is pleasing to note an increase in blind sales
year-on-year
Product Type HY 2019 FY 2019 HY 2020
Aluminium shutters 45% 43% 44%
PVC Shutters 11% 10% 9%
Blinds 32% 34% 35%
NMC 13% 13% 12%
29TAYLOR – TRADING MARGIN
Cost control measures implemented have been
successful in managing manufacturing costs
and wages
DAMIAN JUDGE
GROUP CFO
Group buying strategies have been
implemented and savings are expected
through the course of H2 2020
Improvements in the Taylor factory process are
ongoing with key strategies being implemented
through H1 2020
30ADDITIONAL INFORMATION
GROUP SUMMARISED CASH FLOW
Group summarised cash flow (R'm)                     FY 2018     HY 2019     FY 2019     HY 2020
EBITDA                                                   103.5        55.7        81.2        49.1
Movement in non cash items (incl provisions)               3.4         1.1         3.1        -1.9
Net working capital movement                               0.1       -16.0       -13.6        -0.6
 Inventory                                               -12.3        -4.2        -2.2        14.0   DAMIAN JUDGE
 Accounts receivable                                       0.9        -0.8         2.5         3.1     GROUP CFO
 Accounts payable                                         11.4       -11.0       -13.9       -17.7
Cash generated from operations                           107.0        40.8        70.7        46.7
Tax paid                                                 -30.6       -11.8       -19.1       -11.2
Net Cash from operations (excl finance costs)             76.4        29.1        51.6        35.5
Net Investment in PPE                                    -17.9       -10.5        -6.6        -3.9
FCF                                                       58.5        18.6        44.9        31.6
 Net interest costs                                       -8.2        -4.1        -8.1        -3.6
 Acquisition of subsidiary                                 0.0         0.0         0.0
 Repayment/raising of debt & equity                      -45.5        -6.1       -28.3       -10.2
Investing and financing activities                       -53.6       -10.1       -36.4       -13.8
Cash available to shareholders                             4.9        8.4         8.5        17.7
 Dividend paid to shareholders                           -32.9       -17.4       -27.2       -11.7
Cash movement for the year                               -28.1       -9.1        -18.6        6.1
 Opening cash balance                                     55.2       27.2         27.2        8.4
Closing cash balance                                      27.2       18.1          8.5       14.5

                                                32
GROUP SUMMARISED BALANCE SHEET
Summarised balance sheet (R'm) FY 2018 HY 2019 FY 2019 HY 2020
Non current assets
Property, plant and equipment 61.2 66.1 64.9 78.2
Goodwill and other intangibles 116.8 116.4 113.5 111.7
Deferred Tax 3.4 2.6 1.6 0.5
Other financial assets 0.7 0.0 0.8 0.7 DAMIAN JUDGE
GROUP CFO
182.1 185.2 180.8 191.1
Current assets
Inventories 106.4 110.6 107.1 93.1
Trade and other receivables 61.4 62.1 58.4 55.3
Cash 27.1 18.1 12.6 21.8
Other (Tax + Other) 3.8 2.7 4.0 5.8
198.6 193.5 182.1 175.9
Non current liabilities
Debt 71.4 66.4 29.5 87.7
Deferred tax 2.6 2.4 1.0 1.1
74.0 68.8 30.6 88.8
Current liabilities
Debt 21.7 23.4 49.1 22.2
Trade Payables 65.7 54.7 52.1 34.3
Other (Tax + Other) 1.2 0.3 0.3 0.3
Bank overdraft 4.1 7.3
88.6 78.4 105.6 64.0
Equity 218.2 231.5 226.7 214.2
33GROUP FINANCIAL PERFORMANCE
Core HEPS (R'm) FY 2018 HY 2019 FY 2019 HY 2020 HY 20 vs HY 19
Profit attributable to ordinary shareholders 58.8 32.1 42.9 26.3 -18%
Adjusted for:
Profit on disposal of property, plant and equipment (0.1) - 0.3 0.5 DAMIAN JUDGE
Headline earnings 58.7 32.1 43.0 26.8 -17% GROUP CFO
Adjusted for:
Amortisation of customer database - Taylor 4.9 2.4 4.9 2.4
Acquisition costs - Taylor -
Fair value adjustment on - - -
consideration - Taylor
Non-controlling interest (0.3) (0.1) (0.3) (0.1)
Tax effect thereon (1.4) (0.7) (1.4) (0.7)
Core Headline earnings 61.9 33.7 46.3 28.4 -16%
Weighted average number of ordinary shares 108.0 107.6 107.2 104.6
Earnings per share (cents) 54.4 29.8 40.0 25.1 -16%
Headline earnings per share (cents) 54.3 29.8 40.1 25.6 -14%
Core headline earnings per share (cents) 57.3 31.3 43.0 27.2 -13%
34SALIENT POINTS
25.6c Headline earnings per share (2019: 29.8c)
DAMIAN JUDGE
GROUP CFO
8.0c Final dividend declared per share (2019: 9.1c)
R49m EBITDA (2019: R56m)
R32m Cash from Operating Activities (2019: R25m)
15% Return on Invested Capital (2019: 20%)
35TERRY DENNISON DAMIAN JUDGE
GROUP CEO GROUP CFO
THANK YOUYou can also read