Real Estate marketplace - SEC.gov

Page created by Edna Rice
 
CONTINUE READING
Real Estate marketplace - SEC.gov
Real Estate marketplace
                                Better, Simpler, Smarter Real Estate

“
    I do want a real estate agent to help me through this complex process and to make sure
    I don’t get ripped off. But just like the rest of the products and services I use, I expect
    transparency and flexibility.
                                                     Open letter from millennials to the real estate industry
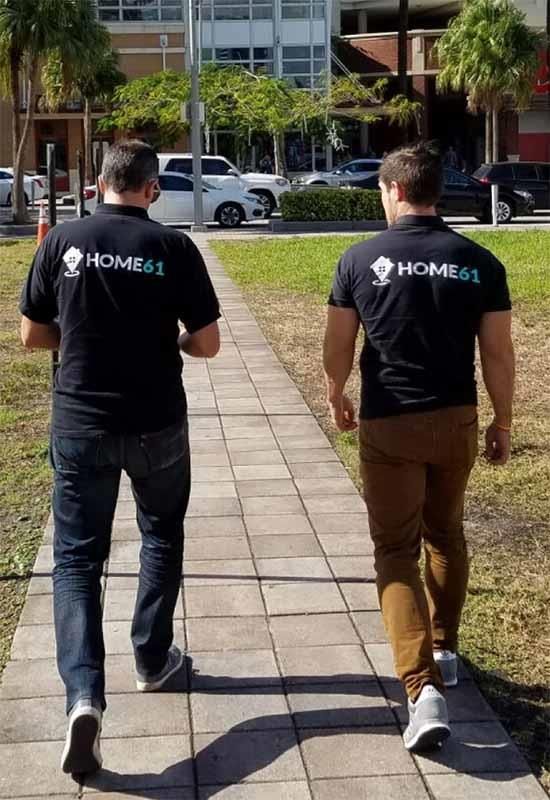
Real Estate marketplace - SEC.gov
COMPANY OVERVIEW
2016                                                                      Sales
                                          $50. M

                                          $45. M                  $44 M
  $44M              Profitable
  In sales          Unit economics        $40. M

                                          $35. M

  $1.2M             x2                    $30. M
  In revenues       YOY Growth
                                          $25. M          $24 M

                                          $20. M
  $568K             10%
  In gross margin   Contribution margin   $15. M

                                          $10. M

 416                  30                   $5. M
 Transactions         Agents                       $2 M
                                           $0. M
 Industry                                          2014   2015     2016
 Residential Real Estate Industry
                                                                                  | 02
Real Estate marketplace - SEC.gov
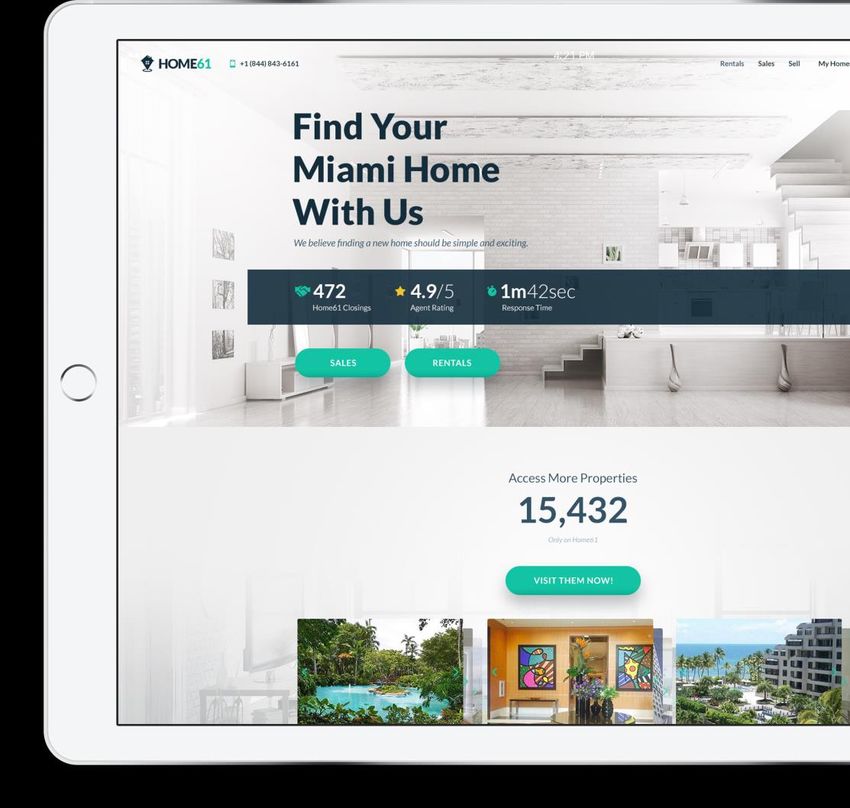
EXPECTED GROWTH                                                                                     Sales
5 Year forecast              $1,400 M

                                                                                                  $1,208 M
                             $1,200 M

                             $1,000 M

                              $800 M
            $1 Bn in Sales                                                               $698 M

                              $600 M

                                                                                $399 M
                              $400 M

                                                                       $195 M
                              $200 M
            2 New Cities                                       $77 M
                                               $24 M   $44 M
                                        $2 M
                                $0 M
                                        2014   2015    2016    2017     2018     2019     2020     2021

                                                                                                             | 03
Real Estate marketplace - SEC.gov
HOME61 IS FUNDAMENTALLY DIFFERENT

 A proven business model that generates profitable
 unit economics

 We built a marketplace where clients and agents
 interact rapidly and efficiently

 A great experience for clients and a sustainable
 business for agent

                                                     | 04
Real Estate marketplace - SEC.gov
A HUGE OPPORTUNITY
USA Residential Real Estate

                                                                                    Franchises
                                                                                       25%

                   $60Bn
                                                              “Mom and pop Shops”

                           In revenues                     Local Brokers
                                                               75%

 Buyer Search platform : Zillow, trulia, realtor.com
 Agent Search platform: Homelight, zillow, trulia,…
 Hybrid, Online brokerage: Refin, Compass, Triplemint,..
                                                                                                 | 05
Real Estate marketplace - SEC.gov
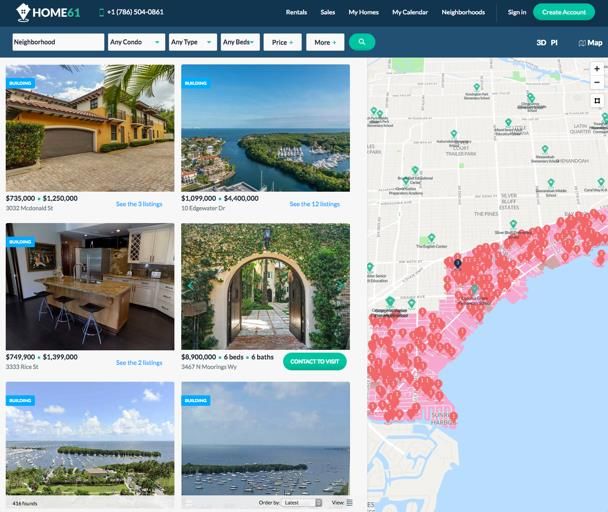
PROBLEM : BUYING | SELLING A HOME IS A HASSLE

  COMPLEX TRANSACTION                         NO TRUST IN AGENT      OUTDATED TECH
  Property search, offers, contracts,         No quality standards   No investment in technologies
  contingencies, Inspections, title search,   No online reputation   Local websites are old and out of touch
  liens, FHA, conventional and jumbo          Lack of transparency   No back office processes
  mortgages, HOA’s,….                         Unprofessional

                                                                                                          | 06
Real Estate marketplace - SEC.gov
SOLUTION: A TECH POWERED BROKERAGE

  A TRUSTED SOURCE                            FULL TRUST IN AGENT                NEW TECHNOLOGY
  Service standardization - Uberization       Mandatory On-boarding              Full transparency on offers
  All-in-one source with simplify processes   On-going training                  100% available listings
  In-house transaction coordinator, real      Online profile, reviews and past   Property data analytics
  estate lawyer,…                             transactions                       Ubiquitous features

                                                                                                               | 07
Real Estate marketplace - SEC.gov
HOME61 ECOSYSTEM GENERATES VALUE FOR EVERYONE
  A Better, simpler and                    More Revenues, more
  smarter experience for   BUYING AGENT    professionalism for agents
  buyer and sellers

        SELLERS                                    BUYERS

                           SELLING AGENT
                                                                        | 08
Real Estate marketplace - SEC.gov
HOME61 EXPERIENCE
   SELECT                                           MEET YOUR AGENT                    CONTROL ALL                                MOVE IN
YOUR PROPERTY                                         IN MINUTES.                      IN ONE PLACE                              YOUR HOME

                                  Our algorithm
                                  matches you
                                  instantly with
                                  our agent best
                                  suited for your
                                  need.

SIMPLE                                              FULL TRANSPARENCY                  CONVENIENCE                               GREAT EXPERIENCE
100% of properties available                        Access past transactions, rating   Schedule, rate, make offers, track        All your needs solved. A better,
within a click using data                           and reviews instantly.             deals all in one place. No apps needed.   simpler and smarter Real Estate.
analytics target the right home

                                                                                                                                                           | 08
Real Estate marketplace - SEC.gov
OUR CLIENTS LOVE US

                      Reviewed by over 1,200 clients.   | 10
ACHIEVING SOLID AGENTS RETENTION
Agents retention by cohort

            FROM ALL AGENTS RECRUITED IN 2015, 88% OF THEM ARE STILL WITH US

                                                                               | 11
WITH REVENUE GROWTH FOR AGENTS
Average agents revenues by cohort

            Revenues
             $8,000

             $7,000

             $6,000

             $5,000

             $4,000

             $3,000

             $2,000

             $1,000

                 $0
                       1   2        3   4   5   6   7   8   9   10   11   12   13   14   15    16
                                                                                              Months
                                                                                                       | 12
HOME61 IS A ROBUST SOURCE OF INCOME FOR AGENT
With less than 3 transactions per year on average, being an agent with a regular broker is not sustainable.

     WHY AGENTS LOVE HOME61?
     •   We generate 95% of their business and we create their referral network           15.80
                                                                                        Transactions on Year 1
     •   We train them to become professionals
     •   We launch their career.

                                                                                              X7
                                                                                           Market average

     RESULTS
     •
     •
         They close 7x more deal than their peers
         They earn 3x more the first year
                                                                                         $40.3K
                                                                                          First year Revenues
     •   Over 80% retention after 12 months

                                                                                                                 | 13
HOME61 TAKE RATES

                 SALES TRANSACTION   RENTAL TRANSACTION

    Commission                               ½
                        3%
    Buyer side                           Month Rent

    Commission                               ½
                        3%
    Owner side                           Month Rent

    Commission
                        6%                1 Month
    Both side

                                                          | 14
WITH STRONG UNIT ECONOMICS
Since Inception

                                    $         %      Comments

       AOV                       106,687             GMV per transaction

       Revenue Per Transaction   3,033.4     2.8%    Take rate : Net revenue

       Commission Paid           (1,604.0)   52.9%   Commission Paid to Agents

       Marketing Acquistion       (956.6)    31.5%   Online marketing Spending for leads

       Cost Per Transaction      (2,560.5)   84.4%

       Contribution               472.9      15.6%

                                                                                           | 15
IT’S TIME TO EXPAND TO NEW CITIES
                                            10 Cities represents a $13.8 Bn opportunity
                                                                                      # Sales       Median Sale      Market       Home61
                                                           City
                       5.49 Million                                                Transactions *     Price*          Size      Opportunity**

                       Transactions                      Miami                           125,897    $    225,750    $28.4 Bn       $1.7 Bn

                                                     Los Angeles                           83,271   $    538,500    $44.8 Bn       $2.7 Bn

                                                     Washington                            90,707   $    358,150    $32.5 Bn       $2.0 Bn

                                                        Chicago                          132,058    $    211,750    $28.0 Bn       $1.7 Bn

                       $232,000                         Phoenix                            90,417   $    214,300    $19.4 Bn       $1.2 Bn
                       Median Sales Price
                                                         Denver                            59,045   $    303,550    $17.9 Bn       $1.1 Bn

                                                         Dallas                            86,623   $    206,050    $17.8 Bn       $1.1 Bn

                                                         Atlanta                           85,021   $    192,735    $16.4 Bn       $1.0 Bn

                                                     Philadelphia                          72,574   $    214,508    $15.6 Bn       $0.9 Bn
                       3.6 Months
                       Inventory                        Houston                            37,122   $    240,152     $8.9 Bn       $0.5 Bn

                                                                                         862,735        2,705,445   $229.7 Bn     $13.8 Bn
                                            *Data Based on Zillow Research (MLS)

                                                  ** 6.0% commission rate

     2016 National Association of realtor
                                                                                                                                             | 16
FIVE YEAR FORECAST
P&L ($)

                     Assumptions: 2 new cities
                                                 | 17
HOME61 LED BY A PROVEN TEAM

       Olivier GRINDA      Olivier BRION      Cyril CARBONNIER      Brian PARAN        Peter ABRAMS
             CEO                COO                   CTO           Head of Sales      Head of Talent

    PRODUCT | MARKETING     OPERATIONS          TECH GURU           REAL ESTATE     AGENT RECRUITMENT

    Experiences founders with multiple exits. Home61 combines top talent in tech and real estate with
    graduates from top MBA programs from Europe and the USA.
                                                                                                        | 18
BACKED BY GREAT INVESTORS, ANGELS AND FOUNDERS
FROM AMAZING COMPANIES

      Dave Mclure               Xavier Niel   Fabrice Grinda

 FOUNDERS THAT ARE BACKING US

                                                               | 19
THE DEAL

           Fund Raise Amount            Already Committed

             $3.0 M                        $1.8 M
                    USD                         USD

           Use of the proceeds          Fundraising Contacts

           Expand to 2 new cities       Olivier Grinda
                                        og@home61.com
           Marketing & Operations
           Get to $1bn within 5 years

                                                               | 20
APPENDIX

           | 21
HOME61 IN THE PRESS

                      | 22
HOME61 SOCIAL MEDIA & REVIEWS

                                | 23
HOME61 BLOG

              | 24
HOME61 WEBSITE
100 % of listings available   Full listing information
Multiple search Criteria      Listings data analytics
Direct contact feature        Comparable
Property visits scheduling    Fully responsive

                                                         | 25
HOME61 BACK OFFICE FULLY INTEGRATED APP
Dashboard | tasks              Reviews
Lead management                Recommendations
Property visit scheduling      Listing search, data analytics
Contract editing | e-signing   Social media reach

                                                                | 26
INDUSTRY STANDARDS PREVENTED
TRADITIONAL BROKERS FROM CHANGING

   TECHNOLOGIES
   Simple Web site with basic search functions using IDX feed. No Back
   Office, no lead generation.

   AGENTS CONTROL THE BUSINESS
   100% of the Broker business is generated by its Agents. Agents control
   their marketing and communication to generate new clients hence
   keeping 90% of the revenue.

   SCALABILITY
   All processes are handled directly by the agent as a one-man operation.

   NO MARKETING FOR AGENTS
   Brokers don’t invest on their agent as they take rate on their business is
   less than 20%.

                                                                                | 27
HOME61 HAS STRONG COMPETITIVE
ADVANTAGES
   TECHNOLOGIES
   Using latest technologies for a better user experience and efficient
   local marketing.

   STANDARDIZED SERVICE QUALITY
   Mandatory on-boarding (3 weeks) and On-going training that are
   controlled on a regular basis with testing and client reviews : Sales,
   tech, real estate practices, Behavior and culture,…

   SCALABILITY
   All redundant processes are automatized and simplified for easier use
   and faster deployment.

   EFFICIENT MARKETING FOR AGENTS
   All Online marketing and communication is homogenized by a team
   of expert.

                                                                            | 28
HOME61 BARRIERS TO ENTRY

            TECHNICAL
           Front-end & Back-end coding in multiple programming languages.
           Data mining | Data integration using API’s | A.I. and Machine leaning
           Responsive coding

            MARKETING
           Multi-channel online marketing: SEM, SEO, Retargeting, Social Media, Ad-Display,, …
           Data Marketing Analysis for predictive marketing and ultra-local reach.
           Offline: PR, Flyers, Events, Mailers, TV Ad.
           Tracking and optimizing performance based on ROI.

            OPERATION PROCESSES
           Lead Flow Management Systems
           In depth Sales Management and Real Estate best practices
           Legal documentation, execution and escalations using automatization.

            TIME & CAPITAL RESOURCES
           Long Term Vision and Goals
           Investing for the future

                                                                                                  | 29
COMPETITIVE REAL ESTATE TECH BROKERS LANDSCAPE

                                      HOME61                  REDFIN               COMPASS                  OPENDOOR            LOCAL BROKERS

  Years of Operation                      2                      11                     4                        3                    N/A

  Compete on Client                                             YES                    NO                       NO                    YES

  Compete on Agent recruiting                                   YES                    NO                       NO                    YES

                                                           Transactional                                 Asset Management
  Business Model (Market)            Transactional                                Transactional                                   Transactional
                                                           Lead generation                                      FLIP
                                 Boost Agent Business      Agent on Salary    Bring Tech to High End
  Value Proposition (Agent)                                                                                      -                 Nice office
                                      (lead Gen.)            (Security)               Agent
                                Better and Smarter Real                                                We buy your home in 30
  Value Proposition (Client)                                Discount fees        High End Agents                                     None
                                   Estate Experience                                                    days at market value
                                      Ultra local           Nationwide              Ultra local            Nationwide
  Expansion Strategy                                                                                                            One neighborhood
                                with Physical presence    No Local Presence   with Physical presence     No Local Presence
                                       $3 MM                 $166 MM                 $70 MM                  $210 MM
  Latest Round                                                                                                                        N/A
                                      @ $8 MM               @ $500 MM                @ $1 Bn                  @ $1 Bn

  Monthly Burn                          < 100K                 > 2MM                > 10 MM                  > 15 MM             +5.0 K EBITDA

                                                                                                                                                   | 30
GROWTH ECONOMICS
Since Inception
                                   SOURCE OF REVENUES

               $1.00                           Paid Marketing
                                                  Channels
              Marketing
                   =
                                                    30%
                            Referrals
                              60%
                   $3.71
                                                            Organic
                  Revenue                                    10%

                                                                      | 31
UNIT ECONOMICS : SALES vs RENTALS
2016

                     ($)         SALES       RENTALS      Comments

       AOV                       417,495       24,511     GMV per transaction

       Revenue Per Transaction   9,183.0      1,120.9     Take rate : Net revenue

       Commission Paid           (4,453.5)    (533.1)     Commission Paid to Agents

       Marketing Acquistion      (1,860.0)    (631.4)     Online marketing Spending for leads

       Cost Per Transaction      (6,313.5)    (1,164.6)

       Contribution              2,869.5       (43.7)

                                                                                                | 32
FINANCIALS
P&L summary ($) | Since inception      HOME61 ($)               2014        2015         2016

   349.3K                              Sales Volume (GMV)        2M         24 M         44 M

   Unique Visitors
                          5.3%         Income                 64,243     750,057     1,169,524
                          Conversion
   18.6K                               GOGS                    40,822      416,081      601,504

   Sign-ups                            GROSS PROFIT           23,421     333,976      568,020
                          17.5%        % of income              36.5%        44.5%        48.6%
                          Conversion
   3.2K                                Marketing               10,498      163,814      451,275
   Qualified Leads                     Human Resources         57,182      350,723      501,602

                          20.0%        Professional Fees       49,351      216,410      312,033

   654                    Conversion   G&A                     12,753      125,779      171,401

   Deal Closed
                                       EBITDA               (106,363)   (522,750)    (868,292)

                                                                                         | 33
AVERAGE TRANSACTION VALUE : SALES
2016 data
                                 $1,800,000

                                 $1,600,000

            $479,833             $1,400,000

                 HOME61          $1,200,000

                                 $1,000,000

                                  $800,000

            $385,427              $600,000

            MIAMI GREATER AREA    $400,000

                                  $200,000

                                        $0

                                              | 34
AVERAGE TRANSACTION VALUE : RENTALS
2016 data

                                  $3,000

        $2,009 /Months            $2,500

                  HOME61          $2,000

                                  $1,500

            $2,100/Months         $1,000

             MIAMI GREATER AREA
                                   $500

                                     $0

                                           | 35
WITH A UNIQUE VALUE PROPOSITION TO CLIENTS

                         A MUCH BETTER EXPERIENCE

            BUYERS                                      SELLERS
     Great UI/UX search capabilities        Excellent property data analytics that
     accompanied with a superior service,   help price right and sell fast with a
     standardized and transparent.          continued service and transparency.

                                                                                     | 09
You can also read