THIRD QUARTER 2019 EARNINGS CONFERENCE CALL - October 31, 2019
←
→
Page content transcription
If your browser does not render page correctly, please read the page content below

THIRD QUARTER 2019

EARNINGS
CONFERENCE CALL

October 31, 2019

  © 2019 SPARTAN MOTORS, INC.   1
FORWARD-LOOKING STATEMENT

This presentation contains several forward-looking statements that are not historical facts, including statements concerning our business,
strategic position, financial projections, financial strength, future plans, objectives, and the performance of our products and operations.
These statements can be identified by words such as "believe," "expect," "intend," "potential," "future," "may," "will," "should," and similar
expressions regarding future expectations. These forward-looking statements involve various known and unknown risks, uncertainties, and
assumptions that are difficult to predict with regard to timing, extent, and likelihood. Therefore, actual performance and results may
materially differ from what may be expressed or forecasted in such forward-looking statements. Factors that could contribute to these
differences include operational and other complications that may arise affecting the implementation of our plans and business objectives;
continued pressures caused by economic conditions and the pace and extent of the economic recovery; challenges that may arise in
connection with the integration of new businesses or assets we acquire or the disposition of assets; restructuring of our operations, and/or
our expansion into new geographic markets; issues unique to government contracting, such as competitive bidding processes, qualification
requirements, and delays or changes in funding; disruptions within our dealer network; changes in our relationships with major customers,
suppliers, or other business partners, including Isuzu; changes in the demand or supply of products within our markets or raw materials
needed to manufacture those products; and changes in laws and regulations affecting our business. Other factors that could affect
outcomes are set forth in our Annual Report on Form 10-K and other filings we make with the Securities and Exchange Commission (SEC),
which are available at www.sec.gov or our website. All forward-looking statements in this presentation are qualified by this paragraph.
Investors should not place undue reliance on forward-looking statements as a prediction of actual results. We undertake no obligation to
publicly update or revise any forward-looking statements in this presentation, whether as a result of new information, future events, or
otherwise.

                                                              © 2019 SPARTAN MOTORS, INC.                                                2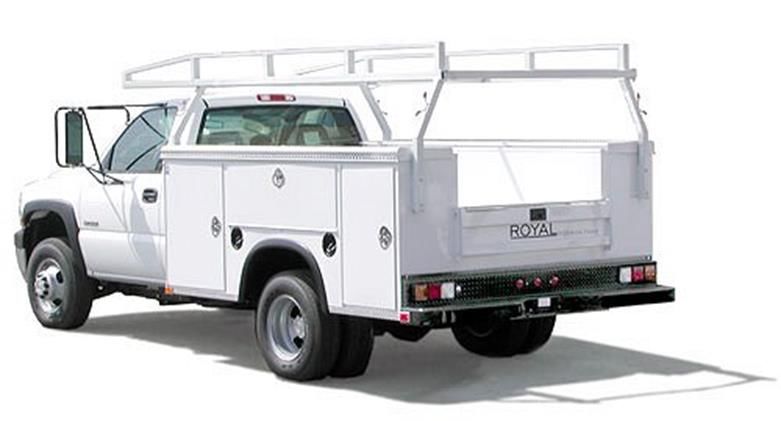
OVERVIEW – 3Q19 VS. 3Q18
                       Revenue ($ M)                                                           Net Income ($ M) (EPS)
                                         $289.0
                                                                                                                        $10.4

             $226.2
                                                                                        $5.2

                                                                                        $0.15                           $0.29

              3Q18                       3Q19                                           3Q18                            3Q19

▪ Revenue for 3Q19 up $62.8M, or 27.8%, to $289.0M from              ▪ Net Income for 3Q19 up $5.1M, or 97.5%, to $10.4M
  $226.2M                                                                     • Reflects FVS volume and favorable material costs resulting
     • FVS up $61.2M, or 51.6% – increased sales of                             from offshore sourcing and improved pricing
       delivery vehicles in all vehicle classes                               • Increased start-up costs for upfit orders in South Carolina,
     • ER up $4.0M, or 6.6% – increased volume and higher                       Kansas City and Mexico
       pricing
                                                                     ▪ EPS increased $0.14, or 93.3%, to $0.29 from $0.15 last year
     • SCV down $6.6M, or 12.7% – higher contract
       manufacturing volume offset by a decrease in luxury           ▪ Excluding USPS backlog, 3Q19 backlog up 40.8%, or $132.9M to
       motor coach sales                                               $458.8M

                                                        © 2019 SPARTAN MOTORS, INC.                                                       3
INVESTING IN OUR FUTURE
▪ M&A activity – coast to coast expansion
     • 3 acquisitions in 10 months
           - Expanded capacity with 8 manufacturing facilities

▪ Launched and expanded capacity
     • Ephrata TB – USPS completed / new 6 months TB backlog
     • Charlotte TB
     • Upfit facilities
           - North Charleston – Mercedes Sprinter
           - Kansas City – Ford Transit
           - Saltillo, MX – Ram ProMaster

▪ Investing in new products and technologies to drive future growth
     • New “purpose-built” Class 3 vehicle to be released in early
       2020
     • New LMD shelving to drive customer efficiencies
     • Detroit Truck Manufacturing

                                                                 © 2019 SPARTAN MOTORS, INC.   4
ACQUISITION OF ROYAL TRUCK BODY
▪ Purchased Royal Truck Body
      • California based manufacturer of service truck
        bodies
      • $90M in cash, or $80M net of tax benefits
      • Full year revenues of approximately $45M - $50M
      • Adjusted EBITDA margins significantly higher than
        SCV margins

▪   Provides coast-to-coast geographic coverage
      • Six facilities located in California, Arizona and
        Texas
      • Together with General Truck Body, provides
        significant West Coast and Southwest truck body
        operations
      • Better serve current and prospective customers in
        the region
            - Expanded manufacturing capabilities
            - Fleet customers
            - New regional customers
                                                            © 2019 SPARTAN MOTORS, INC.   5
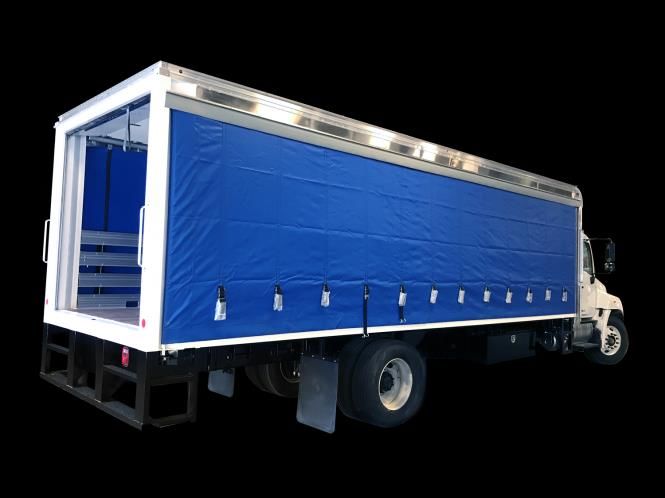
GROWTH STRATEGY AT WORK

        ▪ Delivery vehicle – momentum continues unabated
            • Consumers spent $517.4B online in 2018, up 15%
            • FVS backlog up YOY 93% at 3Q19, excluding USPS
             • Reflects broad industry demand for vehicles across
               the GVWR spectrum
        ▪ Latest acquisition provides coast-to-coast manufacturing
          capabilities

                                © 2019 SPARTAN MOTORS, INC.          6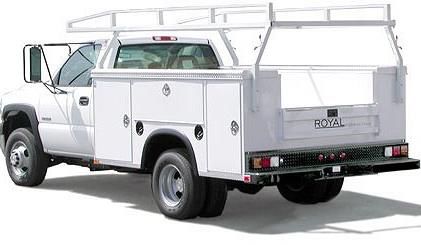
FINANCIAL REVIEW
3RD QUARTER 2019

            © 2019 SPARTAN MOTORS, INC.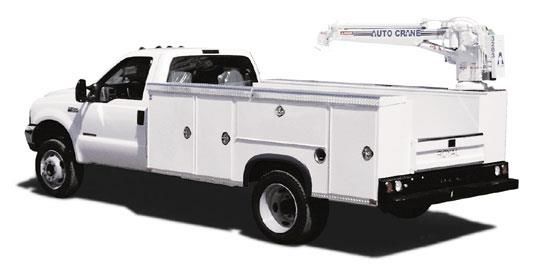
OVERVIEW – 3Q19 VS. 3Q18
        Adjusted EBITDA ($ M) (Adj EBITDA as % of Sales)                                   Adjusted Net Income ($ M) (Adj EPS)
                                              $19.2                                                                      $12.3

               $10.6                                                                           $6.0

                4.7%                           6.6%                                           $0.17                      $0.35

               3Q18                            3Q19                                            3Q18                       3Q19

▪ Adjusted EBITDA rose $8.6M to $19.2M                                     ▪ Adjusted net income rose 106.0% to $12.3M from $6.0M

▪ Adjusted EBITDA margin increased 190 basis points to                     ▪ Adjusted EPS of $0.35 versus $0.17 a year ago
  6.6% of sales compared to 4.7% of sales                                  ▪ Backlog down 5.4% to $458.8M from $484.9M a year
                                                                             ago.
     • Primary driven by FVS volume, favorable material
       costs, pricing                                                               • Excluding the unique USPS truck body order,
                                                                                      backlog totaled $458.8M, up 40.8% compared to
     • Partially offset by start-up upfit and facility                                $325.9M in 2018
       reconfiguration costs

                                                 See GAAP reconciliation in Appendix
                                                            © 2019 SPARTAN MOTORS, INC.                                               8
FLEET VEHICLES & SERVICES – 3Q19
               FVS Revenues ($ M)                                ▪ Revenue up $61.2M to $179.6M from $118.4M
                                      $179.6
                                                                          • Increased sales of delivery vehicles in all classes as well as
                                                                            improved pricing
          $118.4
                                                                 ▪ Adjusted EBITDA increased by $17.4M to $24.7M from $7.2M due to
                                                                     volume, more favorable material costs, and improved pricing, partially
                                                                     offset by upfit center start-up costs and facility reconfiguration

                                                                 ▪ Adjusted EBITDA margin increased 760 basis points to 13.7% of sales
           3Q18                        3Q19
                                                                   from 6.1%. Impacted by:

FVS Adjusted EBITDA ($ M) (Adj EBITDA as % of Sales)                      • Favorable material costs resulting from increased offshore
                                      $24.7                                 sourcing
                                                                          • Improved pricing
                                                                          • Upfit startup costs
                                                                          • Reconfiguration of the Bristol, Indiana facility.
           $7.2
                                       13.7%                     ▪ Excluding the USPS truck body order, backlog totaled $223.8M, up
            6.1%
                                                                   $107.6M or 93.0% compared to $116.2 at September 30, 2018
           3Q18                        3Q19

                                                       © 2019 SPARTAN MOTORS, INC.                                                        9
EMERGENCY RESPONSE – 3Q19
                  ER Revenues ($ M)
                                                                   ▪ Revenue up 6.6% to $64.2M from $60.3M
                                      $64.2
                                                                            ▪ Increased volume and improved
          $60.3
                                                                              pricing

                                                                   ▪ Adjusted EBITDA fell $1.7M to a loss of
                                                                     $1.1M compared to a gain of $0.6M last
           3Q18                       3Q19                           year

                                                                            ▪ Mix, higher material costs, partially
ER Adjusted EBITDA ($ M) (Adj EBITDA as % of Sales)
                                                                              offset by pricing and volume
           $0.6                                                    ▪ Backlog up 11.1% to $195.1M compared to
           1.0%                        1.6%                          $175.7M a year ago
                                       -1.7%

                                      -$1.1

           3Q18                       3Q19

                                                      © 2019 SPARTAN MOTORS, INC.                                     10
SPECIALTY CHASSIS & VEHICLES – 3Q19
SCV Revenues ($ M)
▪ Revenue down $6.6M, or 12.7%, to $45.1M from
$51.7
$51.7M last year
$45.1
• $5.9M decrease in luxury motor coach chassis
sales, offset by higher contract manufacturing
▪ SCV adjusted EBITDA decreased $1.8M to $4.1M
from $5.9M
3Q18 3Q19
▪ Adjusted EBITDA margin fell 240 basis points to 9.0%
SCV Adjusted EBITDA ($ M) (Adj EBITDA as % of Sales) of sales from 11.4% of sales
$5.9
• Due to mix and increased manufacturing
$4.1 throughput
▪ Backlog up 17.5% to $39.9M, compared to $34.0M at
September 30, 2018.
11.4% 9.0%
3Q18 3Q19
© 2019 SPARTAN MOTORS, INC. 11BALANCE SHEET – 3Q19
Spartan Motors, Inc.
Summary Balance Sheet
(unaudited)
Sep 30, Dec 31,
($000's) 2019 2018 ▪ Total liquidity of $55.2M at 3Q19 reflects:
Assets
Cash $ 15,019 $ 27,439 • $15.0M cash on hand
Accts Receivable 112,455 106,801
Contract Assets 49,043 36,027
• $40.2M of borrowing capacity
Inventory 87,936 69,992
PP&E 62,189 56,567 ▪ Long-term debt of $108.9M
Right of Use Assets-Operating Leases 37,110 -
Other Assets 148,860 56,958
• Includes capital to support Royal Truck
Total Assets $ 512,612 $ 353,784 Body acquisition
Liabilities & Shareholders' Equity
Accts Payable $ 83,723 $ 76,399
• Reflects $5.0M paid down on the
Long-term Operating Lease Liability 32,171 - revolving credit facility post-acquisition
Long-term Debt 108,944 25,547
Other Liabilities 88,148 65,756 • Paid additional $10M down on revolver
Total Liabilities 312,986 167,702
Shareholders' Equity 199,626 186,082
on October 21
Total Liabilities & Equity $ 512,612 $ 353,784
Total Liquidity
Cash $ 15,019 $ 27,439
Net Borrowing Capacity 40,189 86,410
Total Liquidity $ 55,208 $ 113,849
© 2019 SPARTAN MOTORS, INC. 12FINANCIAL OUTLOOK - 2019
2019 Guidance
MP% Increase
($M except per share) Low Mid-point High Over Prev Guid
Revenue $990.0 $995.0 $1,000.0 2%
Net income $27.3 $28.1 $28.8 11%
Adjusted EBITDA $51.9 $52.8 $53.7 18%
EPS $0.77 $0.79 $0.81 10%
Adjusted EPS $0.89 $0.91 $0.93 23%
© 2019 SPARTAN MOTORS, INC. 13CLOSING REMARKS
▪ We expect to see stronger year-over-year profitability growth in
the fourth quarter of 2019
▪ Fundamentals of all three business segments remain strong
▪ Continue to work on operational and organization
improvements to drive profitable growth
▪ Focused on executing strategic plan
▪ Spartan team determined to deliver exceptional growth in sales
and profitability and increasing shareholder value
© 2019 SPARTAN MOTORS, INC. 14APPENDIX
© 2019 SPARTAN MOTORS, INC.RECONCILIATION OF NON-GAAP FINANCIAL
MEASURES
This presentation contains adjusted EBITDA (earnings before interest, taxes, depreciation and amortization), which is a non-GAAP financial
measure. This non-GAAP measure is calculated by excluding items that we believe to be infrequent or not indicative of our continuing operating
performance. For the periods covered by this release such items include expenses associated with restructuring actions taken to improve the
efficiency and profitability of our manufacturing operations, various items related to business acquisition and litigation activities, and the impact
executive severance and stock based compensation.
We present the non-GAAP measure adjusted EBITDA because we consider it to be an important supplemental measure of our performance. The
presentation of adjusted EBITDA enables investors to better understand our operations by removing items that we believe are not representative
of our continuing operations and may distort our longer term operating trends. We believe this measure to be useful to improve the
comparability of our results from period to period and with our competitors, as well as to show ongoing results from operations distinct from
items that are infrequent or not indicative of our continuing operating performance. We believe that presenting this non-GAAP measure is useful
to investors because it permits investors to view performance using the same tools that management uses to budget, make operating and
strategic decisions, and evaluate our historical performance. We believe that the presentation of this non-GAAP measure, when considered
together with the corresponding GAAP financial measures and the reconciliations to that measure, provides investors with additional
understanding of the factors and trends affecting our business than could be obtained in the absence of this disclosure.
Our management uses adjusted EBITDA to evaluate the performance of and allocate resources to our segments. Adjusted EBITDA is also used,
along with other financial and non-financial measures, for purposes of determining certain incentive compensation for our management team.
© 2019 SPARTAN MOTORS, INC. 16RECONCILIATION OF NON-GAAP FINANCIAL
MEASURES Financial Summary (Non-GAAP)
Consolidated
(In thousands, except per share data)
(Unaudited)
($000) Thre e Months Ende d Se pte mbe r 30,
Spartan Motors, Inc. 2019 2018
Net income attributable to Spartan Motors, Inc. $10,354 $5,243
Add (subtract):
Restructuring charges 137 501
Acquisition related expenses including stock compensation 1,684 267
Recall expense - 112
Long term strategic planning expenses - 277
Executive compensation plan 531 -
Litigation costs - 321
Severance costs 234 -
DTA valuation allowance - (373)
Tax effect of adjustments (605) (360)
Adjusted net income attributable to Spartan Motors, Inc. $12,335 $5,988
Net income attributable to Spartan Motors, Inc. $10,354 $5,243
Add (subtract):
Depreciation and amortization 2,691 2,600
Taxes on income 3,423 1,037
Interest expense 144 225
EBITDA $16,612 $9,105
Add (subtract):
Restructuring charges 137 501
Acquisition related expenses including stock compensation 1,684 267
Litigation costs - 321
Recall expense - 112
Long term strategic planning expenses - 277
Executive compensation plan 531 -
Severance costs 234 -
Adjusted EBITDA $19,198 $10,583
Diluted net earnings per share $0.29 $0.15
Add (subtract):
Restructuring charges - 0.01
Acquisition related expenses including stock compensation 0.05 0.01
Litigation costs - 0.01
Long term strategic planning expenses - 0.01
Executive compensation plan 0.02 -
Severance costs 0.01 -
DTA valuation allowance - (0.01)
Tax effect of adjustments (0.02) (0.01)
Adjusted diluted net earnings per share $0.35 $0.17
© 2019 SPARTAN MOTORS, INC. 17RECONCILIATION OF NON-GAAP FINANCIAL
MEASURES
Financial Summary (Non-GAAP)
Consolidated
(In thousands, except per share data)
(Unaudited)
Forecast
Year Ending December 31, 2019
Low Mid High
Net income $ 27,314 $ 28,037 $ 28,759
Add:
Depreciation and amortization 9,885 9,885 9,885
Interest expense 2,518 2,518 2,518
Taxes 6,800 7,000 7,200
EBITDA $ 46,517 $ 47,440 $ 48,362
Add (subtract):
Restructuring, acquisition and other
charges 5,362 5,362 5,362
Adjusted EBITDA $ 51,879 $ 52,802 $ 53,724
Earnings per share $ 0.77 $ 0.79 $ 0.81
Add:
Restructuring, acquisition and other
charges 0.15 0.15 0.15
Less tax effect of adjustments (0.03) (0.03) (0.03)
Adjusted earnings per share $ 0.89 $ 0.91 $ 0.93
© 2019 SPARTAN MOTORS, INC. 18THANK YOU © 2019 SPARTAN MOTORS, INC.
You can also read


