Niël Pretorius Chief Executive Officer Riaan Davel Chief Financial Officer 121 Mining Investment Africa Conference 1-3 February 2021 - 121 Group
←
→
Page content transcription
If your browser does not render page correctly, please read the page content below
Niël Pretorius            Riaan Davel
Chief Executive Officer   Chief Financial Officer

121 Mining Investment Africa Conference
1-3 February 2021

                                             PAGE
DISCLAIMER
Many factors could cause the actual results, performance or achievements to be materially different from any future results,
performance or achievements that may be expressed or implied by such forward-looking statements, including, among others,
adverse changes or uncertainties in general economic conditions in the markets we serve, a drop in the gold price, a sustained
strengthening of the Rand against the Dollar, regulatory developments adverse to DRDGOLD or difficulties in maintaining
necessary licenses or other governmental approvals, changes in DRDGOLD’s competitive position, changes in business
strategy, any major disruption in production at key facilities or adverse changes in foreign exchange rates and various other
factors. These risks include, without limitation, those described in the section entitled “Risk Factors” included in our annual report
for the fiscal year ended 30 June 2020, which we filed with the United States Securities and Exchange Commission on 29
October 2020 on Form 20-F. You should not place undue reliance on these forward-looking statements, which speak only as of
the date thereof. We do not undertake any obligation to publicly update or revise these forward-looking statements to reflect
events or circumstances after the date of this report or to the occurrence of unanticipated events. Any forward-looking statements
included in this presentation have not been reviewed and reported on by DRDGOLD’s auditors.

                                                                                                                                    PAGE 2
PROFILE

 South Africa-based world leader in
 gold tailings retreatment                                    5.73Moz
                                                              reserves
                                                              Two Witwatersrand
                                                              operating footprints:
                                                              Ergo
                                                              Far West Gold Recoveries

Growth prospects                       Reversing the
                                                              ZAR23 301m
Gold and beyond, leveraging Sibanye-   environmental legacy
Stillwater relationship                                       Market capitalisation at
                                       of mining              30 June 2020
Compelling ESG proposition                                         up 680% y-o-y
Liberating land for redevelopment
Empowering host communities

                                                                                         PAGE 3
PERFORMANCE HIGHLIGHTS: FY2020

                                 PAGE 4
OPERATING UPDATE: Q1 FY2021 V Q4 FY2020

                 45%                                       10%                                2%
   1 514kg      increase                 R489 750        decrease           R588 239        increase
  PRODUCTION                      OPERATING COST PER KG SOLD        ALL-IN SUSTAINING COST PER KG

                                             R770.4m
                                                EBITDA
                                             (110% increase)

                             6%
   R1 029 839/kg           increase         R2 015.2m                               0
   AVERAGE GOLD PRICE                 CASH AND CASH EQUIVALENTS           EXTERNAL BORROWINGS
        RECEIVED
                                                                                                    PAGE 5
ESG – GOVERNANCE

      International
                         Responsible Mining
  Integrated Reporting
                             Principles
         Council

                                          PAGE 6
SHARE PRICE

              ZAR cents 1 765.00
              12 January 2021

                                   PAGE 7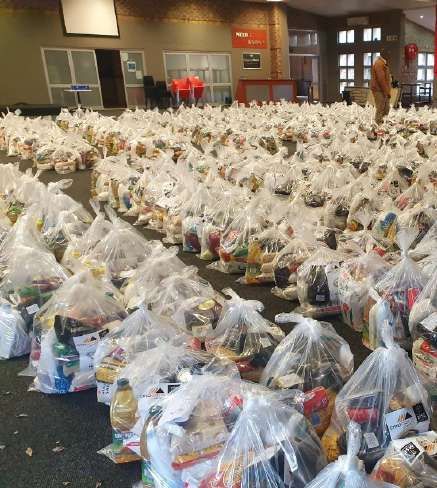
LOOKING AHEAD

                                          FAR WEST GOLD                    GROUP PRODUCTION,
            ERGO                           RECOVERIES                        COST GUIDANCE
 Positioned well to ramp up to       Phase 2 advanced to the planning    Gold production of between
 full production under COVID-19.     and permit application processes    165 000 and 185 000 ounces.
                                     with growth prospects and
 Level 3 regulations with priority   opportunities within the Sibanye-
 on health and safety of staff       Stillwater portfolio.
 and the business.

 Focus on power storage for resilient capacity in terms of both               Cash operating cost
 power supply and quality, whilst expanding environmental                       of ~R535 000/kg
 clean-up for sustainable land use, reduced pollution and
 support of neighbouring communities

                                                                                                       PAGE 8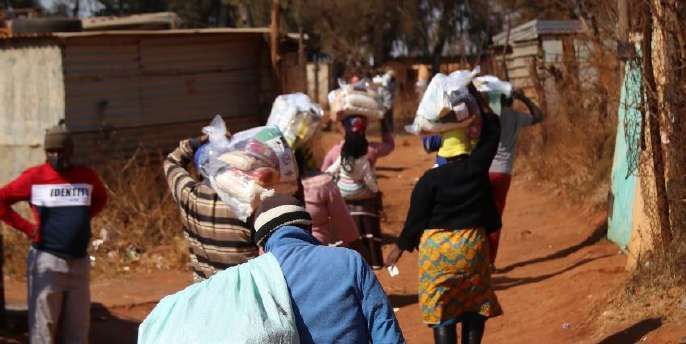
Niël Pretorius, CEO                     James Duncan, investor relations   Registered office          Shareholder data
 Riaan Davel, CFO                        Email:  james@rasc.co.za           Corporate Office Park      (Incorporated in the Republic of South Africa)
 Tel:       +27 (0) 11 470 2600                                             Cycad House, Building 17   Registration No.1895/000926/06
 Fax:       +27 (0) 86 524 3061                                             Cnr 14th Ave / Hendrik     JSE share code: DRD
 Email:     niel.pretorius@drdgold.com                                      Potgieter Road             ISIN: ZAE 000058723
            riaan.davel@drdgold.com                                         Weltevreden Park 1709      NYSE share code: DRD
 Website: www.drdgold.com                                                   PO Box 390
                                                                            Maraisburg 1700
                                                                            South Africa

CONTACT
DETAILS
                                                                                                                                                        PAGE 9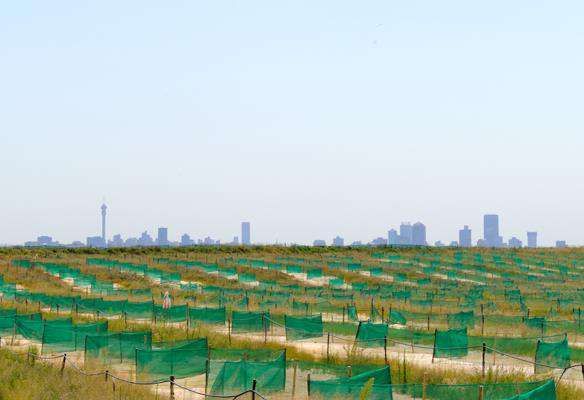
ADDITIONAL
INFORMATION
https://www.drdgold.com/investors-and-media/presentations/2020
                                                                 PAGE 10
GROUP KEY FEATURES: FY2020 V FY2019
R4 185.0m 52% R1 562.1m 320% 5 424kg 9%
increase increase rise
REVENUE OPERATING PROFIT PRODUCTION
R634.5m 13th consecutive financial year of DIVIDEND PAYMENT
HEADLINE EARNINGS
35 cents per share declared as final divided (85 cents per
share for FY 2020)
All-in sustaining costs margin of 29.7% WOMEN IN MINING
SOCIAL CAPITAL
RELATED SPEND
DUST EXCEEDENCES
DECREASED TO
33% increase in the average ZAR gold price 23%
Increase from 21% to
0.52%
received to ZAR 768 765/kg 23% of total staff increase
PAGE 11GROUP OPERATING TRENDS
Volume (000t) Yield (g/t)
13,983
14,000 0.220 0.217
13,500 13,226 0.210
0.204
13,000
0.200
0.194
12,500 12,297 0.190
12,004 0.190
12,000
0.180
11,500
11,000 0.170
HY1 FY2019 HY2 FY2019 HY1 FY2020 HY2 FY2020 HY1 FY2019 HY2 FY2019 HY1 FY2020 HY2 FY2020
Production (kg)
3,500
3,037
3,000
2,697
2,500 2,387
2,280
2,000
1,500
1,000
HY1 FY2019 HY2 FY2019 HY1 FY2020 HY2 FY2020 PAGE 12GROUP FINANCIAL TRENDS
Operating margin (%) All-in sustaining costs margin (%)
50.0 40.0
40.6 32.7
40.0
34.1 30.0 26.7
30.0
20.0 16.1
20.0 17.9
8.2 10.0
10.0
0.8
- -
HY1 FY2019 HY2 FY2019 HY1 FY2020 HY2 FY2020 HY1 FY2019 HY2 FY2019 HY1 FY2020 HY2 FY2020
Free cash flow (Rm) HEPS (cents per share)
600.0 48.4
519.8 50.0
500.0 406.6 40.0 34.0
400.0
300.0 246.3 30.0
18.1
200.0 20.0
100.0 10.0
-
-100.0 -
-200.0 -10.0
-7.2
-300.0 -20.0
-261.0
HY1 FY2019 HY2 FY2019 HY1 FY2020 HY2 FY2020 HY1 FY2019 HY2 FY2019 HY1 FY2020 HY2 FY2020 PAGE 13STATEMENT OF FINANCIAL POSITION
as at 30 June 2020
As at As at
30 June 2020 30 June 2019
Rm Rm
Property, plant and equipment 2 621.1 2 775.3
Non-current investments and other assets 856.3 618.6
Deferred tax assets 8.0 10.0
Cash and cash equivalents 1 715.1 279.5
Other current assets 474.7 376.6
Total assets 5 675.2 4 060.0
Equity 4 040.2 2 688.6
Provision for environmental rehabilitation 568.9 682.6
Deferred tax liability 273.1 193.2
Other non-current liabilities 47.1 37.4
Current liabilities 745.9 458.2
Total equity and liabilities 5 675.2 4 060.0
Current ratio 2.9 1.4
PAGE 14STATEMENT OF CASH FLOWS
for the year ended 30 June 2020
Year to Year to
30 June 2020 30 June 2019
Rm Rm
Net cash inflow from operating activities 1 128.9 288.3
Cash generated by operations 1 309.6 282.0
Interest and dividends received 68.1 16.8
Interest paid (8.7) (9.3)
Income tax paid (240.1) (1.2)
Net cash outflow from investing activities (202.5) (303.0)
Acquisition of property, plant and equipment (181.1) (347.4)
Proceeds on disposal of property, plant and equipment 0.7 5.8
Environmental rehabilitation payments (22.1) (16.6)
Funds received from rehabilitation obligation funds - 55.2
Net cash flow from financing activities 509.2 (7.9)
Proceeds from share issue 1 085.6 -
Borrowings raised - 192.0
Borrowings repaid - (192.0)
Dividends paid on ordinary share capital (564.5) -
Repayment of lease liabilities (11.4) (3.7)
Treasury shares acquired - (0.3)
Share issue and borrowing expenses (0.5) (3.9)
Increase/(decrease) in cash and cash equivalents 1 435.6 (22.6)
Opening cash and cash equivalents 279.5 302.1
Closing cash and cash equivalents 1 715.1 279.5 PAGE 15FINANCIAL REVIEW: STATEMENT OF PROFIT OR LOSS
for the year ended 30 June 2020
Year to Year to
30 June 2020 30 June 2019
Rm Rm
Revenue 4 185.0 2 762.1
Cost of sales (2 937.9) (2 553.9)
Gross profit from operating activities 1 247.1 208.2
Other income 0.7 7.9
Administration expenses and other costs (309.9) (90.9)
Administration expenses and other costs excluding share-based payment expense (85.8) (69.5)
Share-based payment expense (224.1) (21.4)
Results from operating activities 937.9 125.2
Finance income 109.8 58.3
Finance expenses (68.8) (78.4)
Profit before tax 978.9 105.1
Income tax (343.9) (26.6)
Profit for the year 635.0 78.5 PAGE 16ESG – ENVIRONMENT
NATURAL CAPITAL
0% 0.52% R54.4m 65.5ha 26.6ha
steady use dust emissions spent on tailings deposition lodged with NNR
externally sourced exceedances rehabilitation facilities vegetated for approval for
potable water redevelopment
TAILINGS MANAGEMENT
Internal Tailings Performance Management System (TPMS) Review of Historical Interferometric
Independent
implemented for dedicated data collection, storage and processing Synthetic Aperture Radar (InSAR)
Tailings Review Board
• ensures integrity of data for day-to-day management imagery for mapping ground
in place since 2018 deformation over large areas
and oversight
Quarterly
drone
surveillance PAGE 17ESG – SOCIAL
HUMAN CAPITAL
2019 2020
21% women in mining 23%
13% women in core positions 14%
18% women in management 19%
R8.5m Spend on individual training courses R11.5m
SOCIAL CAPITAL
spent on skills and development projects for local communities,
R20.4m including spend on COVID19 related community relief
(R16.6 million spent in 2019)
PAGE 18RESPONSE TO COVID-19
• South Africa moves to lockdown
level 1
South Africa • operations back at full production
• South Africa eases lockdown regulations
declares • health and safety precautions
• underground mining resumes at 50% of capacity remain in place
State of Disaster
• health and safety precautions remain in place • 2.1% of workforce tested positive
operations • strong balance sheet allows for continued • 4 cases out of 54 still active
continue caution • no fatalities
18 August 21 September 28 December
15 March 2020 26 March 2020 16 April 2020 1 June 2020
2020 2020 2020
• South Africa returns to
• South Africa declares 21-day • South Africa moves to • South Africa moves to
lockdown level 2
adjusted level 3 lockdown
National Lockdown lockdown level 3
• operations temporarily halted • Health and safety • Operations proceed with
• underground mining resumes
precautions continued caution
• dispensation for surface mining at 100% of capacity
operations – regulators, unions remain in place
• health and safety precautions
engaged on work resumption remain in place • 1.9% of workforce
• Ergo resumes with 34% of staff, tested positive
• strong balance sheet allows
FWGR with 60% of staff • 3 cases out of 52 still
for continued caution
• screening, hygiene, social active
distancing, personal protective • no fatalities
equipment measures prioritised PAGE 19COVID-19 AND COMMUNITY SUPPORT
BEYOND OUR GATES
The MSE Initiative Staff contribute R1.6 million to nationwide
COVID-19 Solidarity Fund
Support for
6 264 families in need
Broad Based
Livelihoods programme
Awards of Appreciation
participants complete
from City of Johannesburg
MyFuture certificate
and social partners for
MSE Relief efforts
PAGE 20You can also read