The Endless Frontier? Innovation, Sustainability and Tragic Choices in the Treatment of Cancer Diseases
←
→
Page content transcription
If your browser does not render page correctly, please read the page content below
Milano,725
                                                       Milano,    Gennaio
                                                                Maggio    2019
                                                                       2018

The Endless Frontier?
Innovation, Sustainability and Tragic Choices in the
Treatment of Cancer Diseases

Fabio Pammolli

DIG and CADS, Politecnico di Milano
Fondazione CERM

Cancer Real World. Milan, January 25, 2019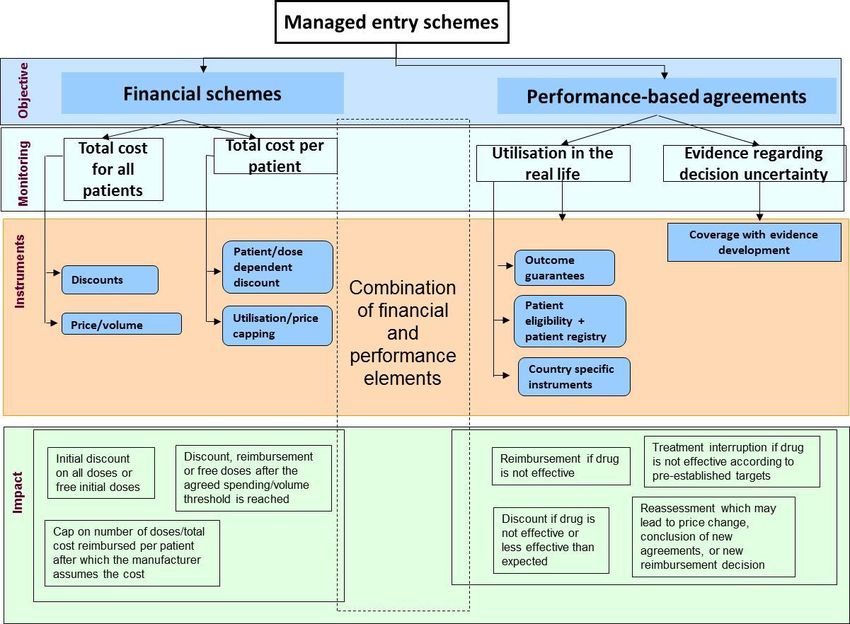
Milano,7 25
                                             Milano,      Gennaio
                                                       Maggio 20182019

                                             INDEX

1   The Endless Frontier

2   Innovation, Sustainability and Pricing

3   Targeting and Impact Analysis in the Wild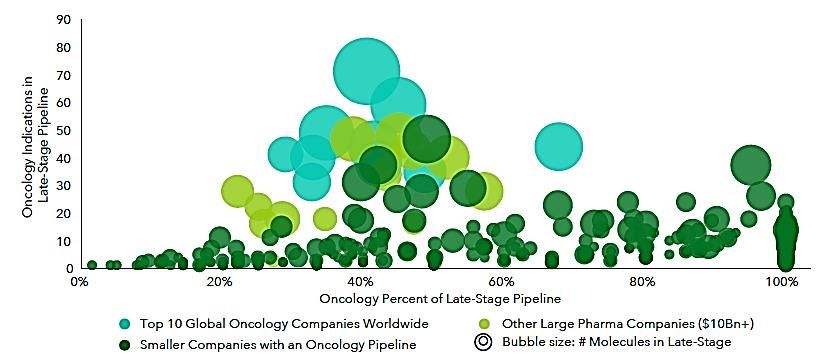
Milano,7 25
                                             Milano,      Gennaio
                                                       Maggio 20182019

1   The Endless Frontier

2   Innovation, Sustainability and Pricing

3   Targeting and Impact Analysis in the Wild
Milano,7 25
                                                                                               Milano,      Gennaio
                                                                                                         Maggio 20182019

                                                                    The Endless Frontier

F. Pammolli, L. Magazzini, M. Riccaboni, (2011), “The productivity crisis in pharmaceutical R&D ”, Nature
Reviews Drug Discovery volume 10, pages 428–438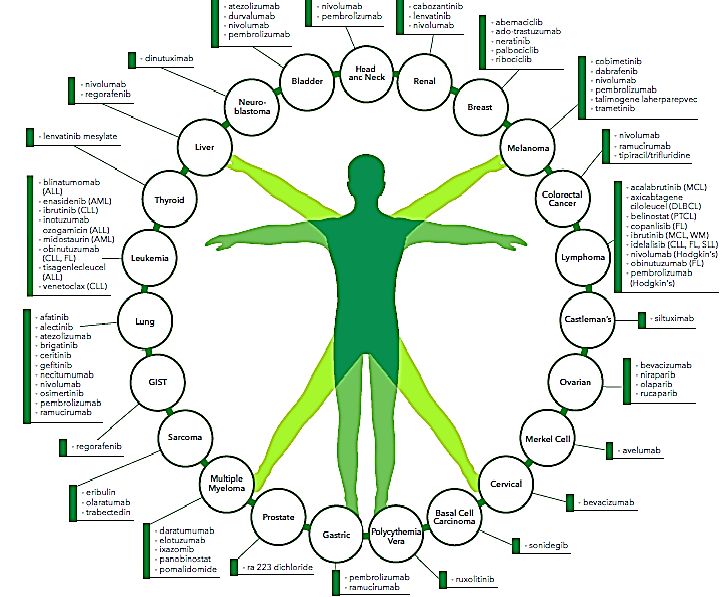
Milano,7 25
                                                                                          Milano,      Gennaio
                                                                                                    Maggio 20182019

                                                     The Endless Frontier
   Company Late-Stage Pipelines, Number of Oncology Indications and Oncology
                              Percent of Pipeline
                                                       Source: IQVIA R&D Intelligence, 2018

• CAR T (Chimeric Antigen Receptor T-cell) Immunotherapy - 50 projects in
  clinical trials.
• Cell therapy, carrier cell therapy and stem cell therapy - 529 projects in clinical
  development
• Conjugated monoclonal antibodies - 188 projects in clinical development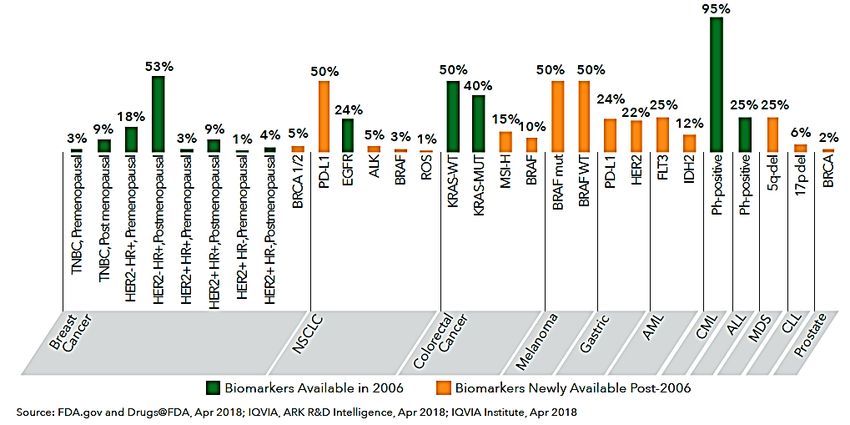
Milano,7 25
                                                                                   Milano,      Gennaio
                                                                                             Maggio 20182019

                                                             The Endless Frontier
                           New Active Substance Approvals in Oncology by Indication, 2013—2017

Data Source: IQVIA, 2018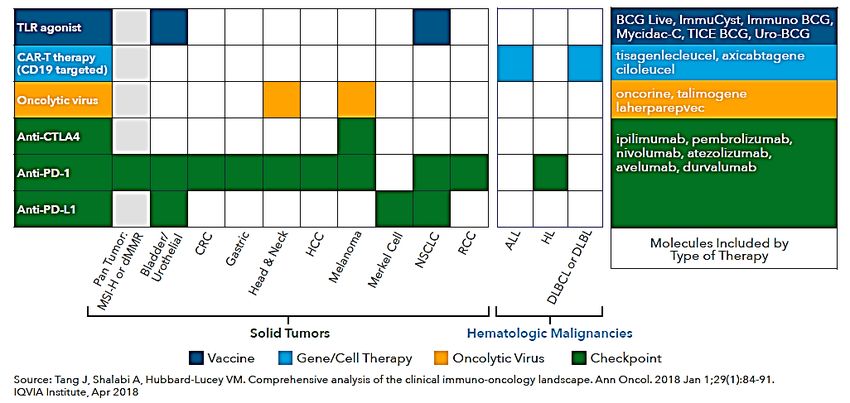
Milano,7 25
                                                                 Milano,      Gennaio
                                                                           Maggio 20182019

                                            The Endless Frontier

Patient Incidence of Positive Biomarker Results Per Cancer by Biomarker
                            Availability, 2017
Milano,7 25
                                                                    Milano,      Gennaio
                                                                              Maggio 20182019

                                                 The Endless Frontier

Approved Checkpoint Inhibitors and Next-Generation Biotherapeutics by Mechanism
                      of Action and Tumor Type Approvals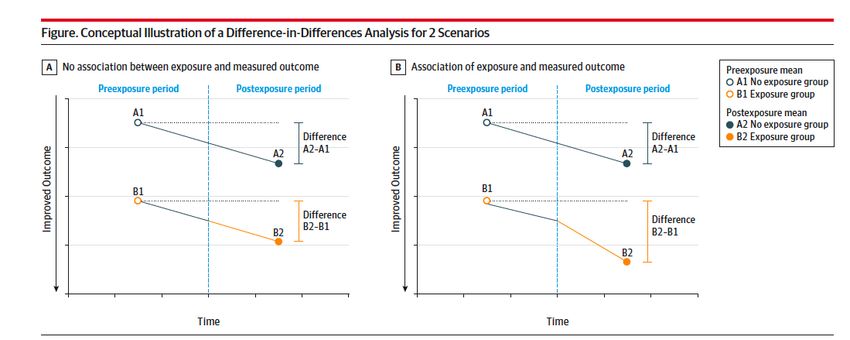
Milano,7 25
                                             Milano,      Gennaio
                                                       Maggio 20182019

1   The Endless Frontier

2   Innovation, Sustainability and Pricing

3   Targeting and Impact Analysis in the Wild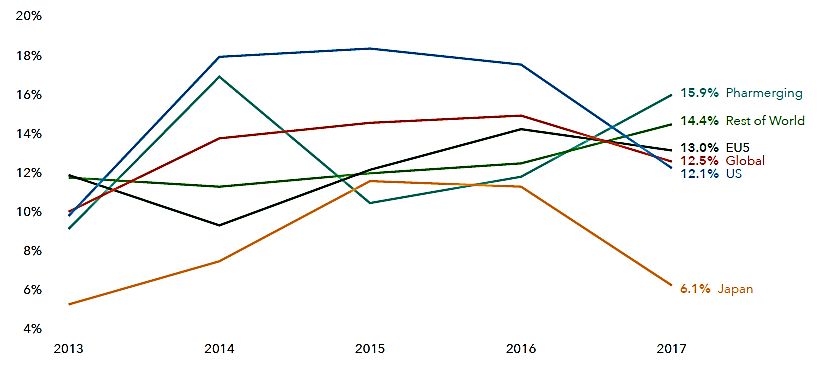
Milano,7 25
                                                                    Milano,      Gennaio
                                                                              Maggio 20182019

                                      Innovation, Sustainability and Pricing

      Growth Rates for Global Oncology Therapeutic Medicines
                       Spending, 2013—2017

Data Source: IQVIA, MIDAS, Dec 2017
Milano,7 25
Milano, Gennaio
Maggio 20182019
Innovation, Ageing, and the Welfare System
Cancer Survivors by Age Cohort
C L. Shapiro (2018), Cancer Survivorship, New England Journal of MedicineMilano,7 25
Milano, Gennaio
Maggio 20182019
Innovation and Ageing: The Macro Constraints
Population 65+ :
2017: 22.3% (Germany: 21.2%, France:19.2%)
2040: 32.1% (Germany: 28.7%, France:25.6%)
Welfare expenditure, Italy
Demographics: higher life expectancy (+2 years)
AWG Risk: Higher health expenditure due to technological
driversMilano,7 25
Milano, Gennaio
Maggio 20182019
Innovation, Ageing: The Macro Constraints
PAYGO Burden, baseline (Demography: EUROPOP2015 base scenario,
AWG Reference scenario)
Italy: Current: 64.2% (21.8% health+ltc) 2040: 80.0% (26.4%
health+ltc)
Demographic stress scenario (higher life expectancy)
2040: 80.2% (24.5% health+ltc)
Innovation intensive stress scenario (Health)
2040: 81.4% (27.8% health+ltc)Milano,7 25
Milano, Gennaio
Maggio 20182019
Innovation and Ageing: The Macro Constraints
Total Health Expenditure as a function of GDP:
8.9% (OECD) (of which 71% funded through public expenditure, i.e.
6.3% GDP).
We project public health expenditure using age-class cost profiles
and population projections and compute the average benefit cut
required to keep the expenditure at the current level (as a % of
GDP).
Costs are assumed to grow at the GDP growth rate.
2020 2030 2040
Coverage Cut
2.9% 9.5% 15.3%Milano,7 25
Milano, Gennaio
Maggio 20182019
Back to Innovation and SustainabilityMilano,7 25
Milano, Gennaio
Maggio 20182019
Back to Innovation: Pricing, Reimbursement and MEAsMilano,7 25
Milano, Gennaio
Maggio 20182019
Back to Innovation: Pricing, Reimbursement and MEAs
Financial Sustainability, Risk Sharing, Payments by Results,
….but…
Real World Challenges
- Accelerated Adaptive pathways, Micro-level heterogeneity,
Clinical guidelines vs. usage in specific patient cohorts
- Adjunctive therapies, Multiple indications, Combined therapies
(e.g. ipilinumab + nivolumab in metastatic melanoma), Entry of
new drugs
- Percentage of long term survivors (unknown ex ante)
- Duration of drug responses (unknown ex ante)
- Local and national formulary listing decisions; Off-labelingMilano,7 25
Milano, Gennaio
Maggio 20182019
Back to Innovation: Pricing, Reimbursement and MEAs
Alternative solutions
Master and Margarita (Bulgakov) (e.g. broad equivalency classes,
denial of breakthrough designations, rationing/coverage restrictions,
delays … )
OR …
Data repositories to support ML+Causal modelling in real world to
sustain payment by results, adaptive reimbursement, outcome based
refund agreements, protocols in real world, socio-economic impact
AND …
Drugs Looking for Diseases, Medical Decision Making, Tragic ChoicesMilano,7 25
Milano, Gennaio
Maggio 20182019
1 The Endless Frontier
2 Innovation, Sustainability and Pricing
3 Targeting and Impact Analysis in the WildMilano,7 25
Milano, Gennaio
Maggio 20182019
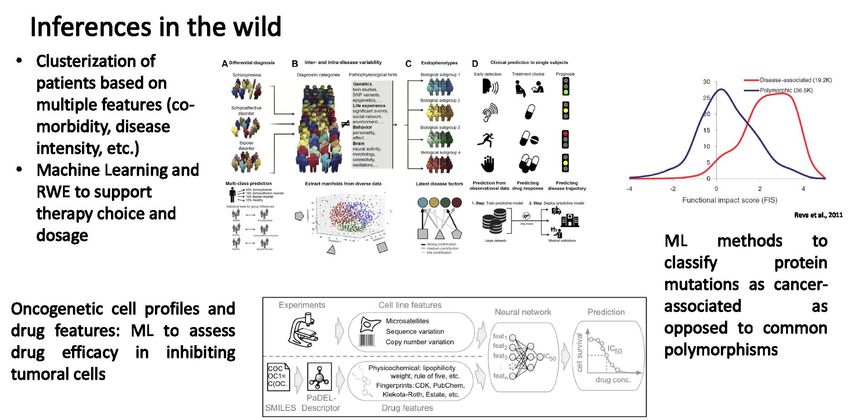
Targeting and Impact Analysis in the Wild
Causality in the wild:
- Age groups
- Ethnicity and gender
variances
- Co-morbidity
- Concomitant drugs
- Lifestyle variances
- Differences in disease
severity
- Varying levels of
compliance
- (….)
X. Huang et al., 2018, “Revealing Alzheimer’s disease genes spectrum in the whole-genome by machine learning”, BMC Neurology
S. Mueller et al., 2017, “Overall Survival In Patients With Non-small Cell Lung Cancer: A Comparison Of Clinical Trial Versus Real-world
Outcomes Using A Propensity Score Reweighting Approach”, INGRESSMilano,7 25
Milano, Gennaio
Maggio 20182019
Targeting and Impact Analysis in the WildMilano,7 25
Milano, Gennaio
Maggio 20182019
Targeting and Impact Analysis in the Wild
A) Schematic of a Regression Discontinuity Design analysis. The treatment is only administered if the
running variable is above the threshold. The outcome (y-axis) is plotted as a function of a running variable
(x-axis). The magnitude of the treatment effect, the difference in outcome at the threshold, is estimated using
regression. B) Schematic figure representing the analysis performed in (Thistlethwaite D.L., Campbell
D.T., 1960, “Regression-Discontinuity Analysis: An Alternative to the Ex-Post Facto Experiment”, The
Journal of Educational Psychology. 1960;51:309-17). Academic outcome (probability of scholarship) is
plotted as a function of test score, and a discontinuity is seen at the cutoff for receiving a certificate of merit.
Note that this figure is stylized and does not use the data used in the original analysis; it is intended only to
demonstrate the approach. C) Graphical model of Regression Discontinuity Design. W are confounding
variables; R is the running variable which determines the treatment along with the threshold; X is the
treatment (independent variable) which is either administered (do(X)) or not administered (do(not X))
depending on R; and Y is the outcome (dependent variable) of interest. D) Graphical model representing
this analysis. Socioeconomic status (for example) is likely to affect both test score and the probability of
receiving a scholarship. Test score determines whether a certificate of merit is awarded, which in turn affects
the probability of receiving a scholarship.Milano,7 25
Milano, Gennaio
Maggio 20182019
Targeting and Impact Analysis in the Wild
Venkataramani, Atheendar & Bor, Jacob & B Jena, Anupam. (2016). Regression discontinuity designs in healthcare
research. BMJ. 352.Milano,7 25
Milano, Gennaio
Maggio 20182019
Targeting and Impact Analysis in the Wild
A) Schematic of a Difference-in-Differences analysis. The trend of two groups, treated and untreated, is
plotted as a function of time. Before the treatment, the trends of the two groups should be parallel (a constant
difference-in-differences). The treatment effect is estimated by the degree to which the trends diverge after
the treatment is administered. B) Schematic figure representing the analysis performed in (Pischke J.S.,
2007, “The impact of length of the school year on student performance and earnings: Evidence from the
German short school years”, Economic Journal, 117, 1216-42). Outcome (probability of grade repetition) is
plotted as a function of time, before and after the implementation of the short school year in some states. The
difference between State outcomes changes after the change in school year (i.e., there is an increase in
difference in differences). Note that this figure is stylized and does not use the data used in the original
analysis; it is intended only to demonstrate the approach. C) Graphical model for Difference-In-
Differences. All variables are considered as a function of time, t. W are confounding variables; X is the
treatment (independent variable) which is administered (do(X)) to population 1, and not administered (do(not
X)) to population 2; Y1 and Y2 are the outcomes (dependent variables) for populations 1 and 2, respectively;
D is the difference between Y1 and Y2 and is tracked over time. D) Graphical model representing the
analysis performed. Common trends such as federal taxes and economic conditions are likely to affect the
two States similarly. The short school year is implemented only in one State. The difference in outcome is
calculated from the two States’ outcomes.Milano,7 25
Milano, Gennaio
Maggio 20182019
Targeting and Impact Analysis in the Wild
Designing Difference in Difference Studies: Best Practices for Public Health Policy
Coady Wing, Kosali Simon, Ricardo A. Bello-Gomez
Annual Review of Public Health 2018 39:1, 453-469Milano,7 25
Milano, Gennaio
Maggio 20182019
Targeting and Impact Analysis in the Wild
An instrumental variable (IV) is a variable,
generally found in administrative data, that is
assumed to randomize a treatment to estimate
cause and effect relationships, thus controlling
for known and unknown patient characteristics
affecting health outcomes. An important (often
heroic) assumption is that the IV randomizes
treatment but does not directly affect the patient
outcome.
A) Graphical model for Instrumental Variables. W are confounding variables; X is the independent
variable; Y is the outcome (dependent variable); Z is the instrument which only affects Y through its effect
on X. B) Graphical model representing the analysis performed. Graphical model representing this
analysis performed in (Evans W.N., Ringel J.S., 1999, “Can higher cigarette taxes improve birth
outcomes?”, Journal of Public Economics, 72, 135-54. Maternal smoking is thought to affect birth weight.
But socioeconomic status (for example) likely affects both a mother’s decision to smoke as well as the
child’s birth weight. A tax on cigarette smoking could affect maternal smoking but is unlikely to directly
influence the birth weight, except through an effect on maternal smoking. Such a tax is therefore a good
instrument to examine the effect of smoking on birth weight without being confounded by socioeconomic
statusMilano,7 25
Milano, Gennaio
Maggio 20182019
Inferences in the Wild: The Organization of Research
DATA SOURCES Raw data
DATA CLEANING AND
- Micro and Hospitals
(files,
databases, …) INTEGRATION
population data and
Individuals Disambiguation
research
from institutes Conflict
Matching
Public
heterogeneous administration
resolution Geolocation
Companies
sources
Cleaned/Integrated
- Combination of ML data
and causal models
in real world quasi DATA ANALYTICS
experimental
settings
Causal
- Multidisciplinary Machine
Econometric
Learning
data analytics Modeling
factories
Decision Making, Targeting and Impact EvaluationMilano,7 25
Milano, Gennaio
Maggio 20182019
Summing Up
- The Endless Frontier: Innovation, ageing, sustainability and
tragic choices in health.
- Looking for a Selective Universalism, designed around the
evolution of individual needs over the life cycle
- Causal inferences in real world to sustain Risk Sharing and
Outcome-Based Dynamic Pricing Schemes. Data: A Tragedy
of the Anticommons (M. Heller)?
- Adaptive Precision Therapies call for … Adaptive Precision
Policies.
- ML and causal modelling for targeting and impact
evaluation. The organizational challenge for researchYou can also read