Australia & New Zealand - Looking Forward as Markets Re-Open: Presentation by Angela Foley Ohio Partner | Foley & Associates June 26, 2020 - Ohio ...
←
→
Page content transcription
If your browser does not render page correctly, please read the page content below

Looking Forward as
                                    Markets Re-Open:

                                    Australia &
                                    New Zealand
Presentation by Angela Foley
Ohio Partner | Foley & Associates
June 26, 2020
AGENDA
1.   Current Environment in Australia & New Zealand

2. Why you should be looking at this region

3. Industry Sectors & Opportunities

4. Call to action

                                                      2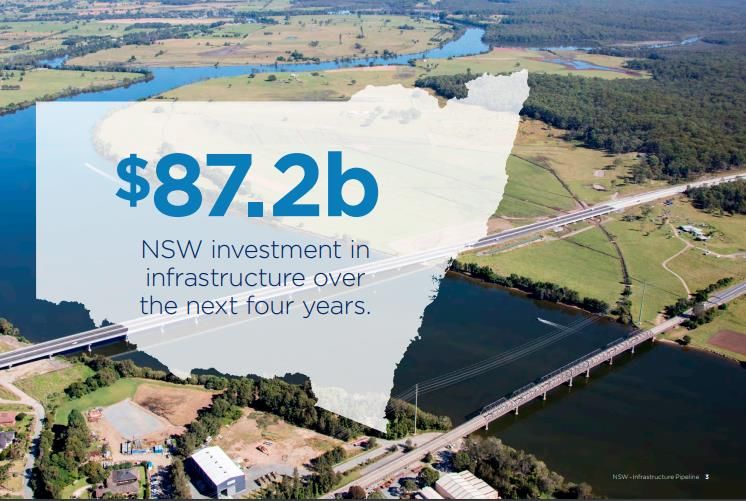
1. Current
Environment:
Australia &
New Zealand
How have we weathered the crisis
and why the economies are
expected to bounce back?
The Current Environment

Australia                       New Zealand
(25.7m total population):       (5m total population):
▌   7,521 - total number of     ▌   1,515 - total number of confirmed
    confirmed cases since the       cases since the pandemic began
    pandemic began
                                ▌   22 total deaths
▌   103 total deaths
                                ▌   98% recovered
▌   92% recovered
                                ▌   0 new cases on 24 June
▌   29 new cases on 24 June

                                                                 4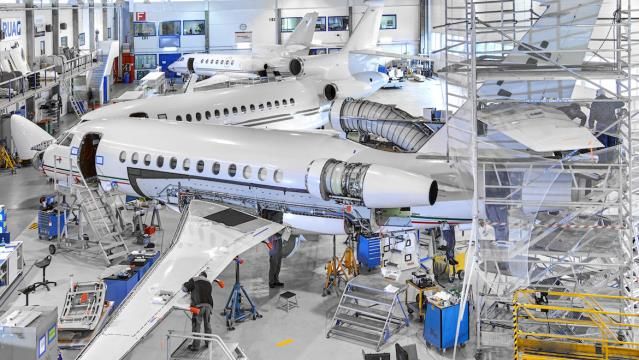
The Current Environment

▌   3-stage plan by Australian Federal Government:

    to allow businesses to reopen, large gatherings and interstate
    travel by the end of July 2020.

▌   International travel to New Zealand & Pacific Islands under
    consideration

▌   No plans yet to restart broader international travel

                                                                     5
Keeping the Economy Moving

▌ Australia – largest ever       ▌ New Zealand – Announced
  government economic stimulus    fiscal stimulus measures:
  package:

          A$ 320 billion                 NZ$ 23 billion
            ~US$ 221.8b                      ~US$ 14.9b

                                                              6
World Economic Outlook (IMF)

IMF 2020 Projections (June 2020)

▌ Global economic growth predicted to fall -4.9% in 2020,
  due to coronavirus containment measures:

                                           New
    China      Australia         Japan              Germany   US              UK           France
                                          Zealand

     1%         - 4.5%           - 5.8%   - 7.2%     - 7.8%   - 8%          - 10.2%        - 12.5%
   (real GDP, annual % change)

▌ -0.8% economic growth in emerging & developing Asia.

▌ Australia & New Zealand in recession.                              *IMF, World Economic Outlook, June 2020

                                                                                                         7
AUSTRALIA: What does recovery look like?

                                 4%
                                             Rebound in 2021:
      1.8%                                     +4% growth
       2019                      2021

                    2020

                  -4.5%

   *IMF, World Economic Outlook, June 2020

                                                                8
NEW ZEALAND: What does recovery look like?

                    5.9
                           Rebound in 2021*:
                     %       +5.9% growth
     2.2%

     2019           2021
                    2021
      1     2020
              2      3

                                     *IMF, World Economic Outlook, April 2020
            -7.2%
                                                                         9
3 possible pathways for the Australian economy 2020/21

                                                          MOST
                                                         LIKELY?

 *Source: The Demographics Group
                                                             10
2. Why consider Australia & New Zealand ? Planning your next move… Strategy for 2020 and beyond
Thinking about next steps…
In the lead up to, and once
                               Challenge, Change, Disruption
lock-down is lifted…
                              Strong Market Knowledge
where should I be investing              +
time and resources?             Responsible Planning

                              to navigating the situation
                                   moving forward!

                                                               12
Where in the world are you doing business…?
Think…
SALES…?
EXPORTS…?
MARKETS…?
13 13NEW MARKETS | Key Points to Consider
CAPACITY
END PARTNERS (e.g.
CUSTOMERS Distributors)
COMPETITORS $$$ BUDGET
GOVERNMENT
PRODUCT /
RESOURCES SERVICE
RESEARCH MODIFICATION
PARTNERS
14Exposure to global supply chain risks
▌ Global supply chain
disruptions
▌ Shortages of critical
items
e.g. lockdowns / quarantines in China
have disrupted our inbound supply chains…
15Exposure to global supply chain risks
▌ Australia: ▌ New Zealand:
Strategically dependent on Strategically dependent on
China for 595 categories of China for 514 categories of
goods, of which: goods, of which:
167 have applications in critical 144 have applications in critical
national infrastructure national infrastructure
16Australia heavily depends on imports
Australian Imports Total Imports % of total
(Category), 2018 Imports from imports
(US$ Billion) China
(US$
Billion)
Machinery 32.5 10.6 33%
Mineral Fuels 31.3 1.8 6%
Vehicles 31.1 1.3 4%
Electrical Machinery & 26.1 13.0 50%
50% or more
Equipment
Plastics and Plastic Articles 5.8 2.3 40%
Iron or Steel Articles 5.1 2.6 51%
Furniture, Bedding & Lighting 5.1 3.5 69%
Source: Trading Economics: Australia Imports from China (2018); and, Australia Imports by Category (2018)
17Example: Construction & Building
China = No.1 source Australia sources from China:
of many building
materials used in
Australian projects +69% of furniture
+56% of glass
+40% of nuts, screws &
bolts
18Example: Medical Equipment & Medicine
AUSTRALIA RELIES Australia imports:
ON IMPORTS OF
MANY CRITICAL
ITEMS
80% +90%
of the medical of medicines &
equipment used pharmaceutical
in country products
19Urgent need for supply chain diversification…
…opportunities for Ohio exporters!
A time for innovation…
▌ Onshore critical functions
▌ Invest in automation of critical processes
▌ Seek greater geographical diversification in supply chains
Productivity Efficiency Health & Safety 20Focus on the new reality!
213. Key Sectors & Opportunity for Ohio Exporters Where are the $$$... ?
AGRICULTURE &     ADVANCED      INFRASTRUCTURE
FOOD PRODUCTION   MANUFACTURING

    MEDTECH &      AEROSPACE        CHEMICAL
 BIOTECHNOLOGY                      PRODUCTS

                                                   23
Agriculture & Food Production
▌ Food security is a top priority for Australia’s government.
→ Australia will add 1 million ha to grain production in 2020.
24Agriculture & Food Production
▌ Increased grain production will lead
to growing demand for essential
agricultural equipment, fertiliser,
chemicals, biological solutions etc.
▌ Australia is also embracing robotics
& automation technologies to
improve efficiency.
25Advanced Manufacturing
Advanced manufacturing will be the key to rebuilding the local industry…
▌ Focus on developing ‘niche’ markets in sectors such as
food production, medical engineering, mining etc.
→ Manufacturers will require new types
of machinery, cutting-edge
technologies and advanced solutions
as they diversify production.
26Industrial Equipment & Machinery
Machinery (as a category) was Ohio’s leading export to Australia in 2019*
▌ In Q1 2020 (Jan-Mar), imports of machinery &
transportation equipment into Australia from the US were
valued at A$4.4 billion (~US$3bn) (Australian Bureau of Statistics)
→ Ohio exports of machinery,
except electrical, to Australia in 2019
was valued at over US$170 million*.
27
*Office of Trade and Economic Analysis (OTEA), International Trade Administration, U.S. Department of Commerce .Infrastructure
▌ The building & construction industry is at the frontline of
Australia’s economic recovery.
→ Several major projects underway in the transport sector,
including upgrades to highways, new tunnels, new metro &
rail systems, and the Western Sydney Airport.
28Infrastructure
▌ New South Wales (NSW) government has
committed to continue to deliver
infrastructure & construction projects.
Investing a record A$87.2 bn (~US$55.5bn) for
critical state infrastructure to 2023, including:
› A$51.2 bn (~US$35.5 bn) on roads & transport
› A$8 bn (~US$5.5 bn) for health infrastructure
and service related projects
2929Infrastructure
▌ Under the Covid-19 Response and Recovery Fund (CRRF),
the NZ government has committed to investing:
→ NZ$5 bn (~US$3 bn) to build 8,000 new homes.
→ An initial NZ$3 bn(~US$2 bn)
contingency fund for additional
infrastructure investment.
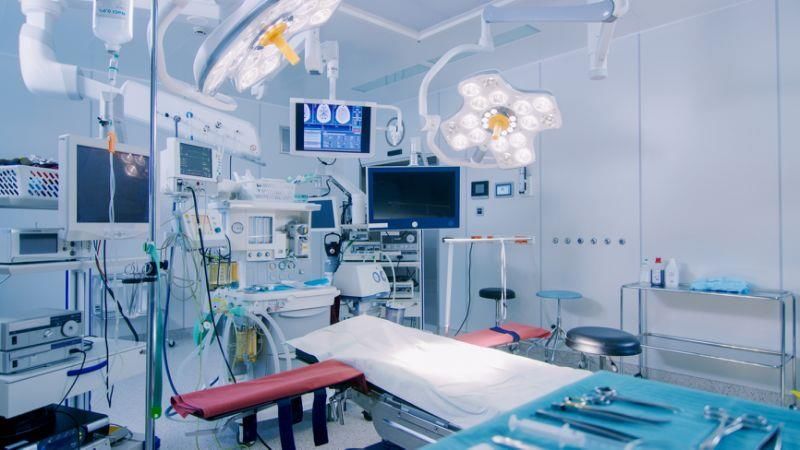
30Medical Devices & Equipment
▌ ~80% of medical devices used
in Australia are imported.
▌ USA is one of 3 major exporters
of medical devices to Australia.
→ In 2017, US exports of medical equipment and supplies to
Australia totalled US$1.5 bn.
31Medical Devices & Equipment
Demand in Australia is growing rapidly for…
Remote patient monitoring solutions that reduce hospital &
rehabilitation costs and lead to faster patient recovery.
Telehealth technology & services, supported by the Australian
government’s US$0.7 bn funding boost.
Medical devices & equipment tailored for
the aged care sector.
Orthopaedics & prosthetics.
32Biotechnology
▌ Australia's biotech sector - valued at A$100
billion (~US$68.6bn) (2017, ASX-listed companies)
» ~1,000 biotech & MedTech companies
currently engaging in R&D (tax incentive -
reduces companies’ R&D costs)
» ~1,000 clinical trials commenced in Australia
each year - A$1 bn(~US$686m) investment.
The world’s top 10 pharmaceutical companies
alone invest ~A$200 million (~US$155m) p.a. in
clinical trials in Australia.
33Biotechnology
▌ Focus on precision medicine / genomics:
» Australian Genomics Health Alliance – a
collaboration of ~80 organizations including
research institutions & clinical service
providers (federation of data)
» Genomics Health Futures Mission –
A$500m (~US$345m) over 10 years.
» Shifting the balance of health care spending
from lifetime management of chronic
conditions to cost effective early intervention.
34Aerospace
▌ Aircraft Manufacturing & Repair Services
industry in Australia worth A$4 billion
(~US$2.8bn) in 2019-20. (IBISWorld Australia, 2020)
→ Local MRO operations in aerospace
expected to expand as developments in
automation reduce high labor costs.
→ Boeing, Airbus and BAE Systems are dominant players,
supported by a strong local manufacturing market.
35Chemicals
▌ Ohio’s 2nd largest export category to both Australia & New
Zealand (ANZ)*.
▌ In 2019, chemical exports from Ohio to ANZ were valued at
over US$ 116 million.
▌ Chemicals in Australia are regulated according to their use:
Industrial Agriculture & Veterinary Food & Beverage
Australian Industrial Chemicals Australian Pesticides & Veterinary Food Standards Australia &
Introduction Scheme (AICIS) Medicines Authority (APVMA) New Zealand (FSANZ)
*Office of Trade and Economic Analysis (OTEA), International Trade Administration, U.S. Department of Commerce.
36Major Industry Events in Australia: 2020/21
AusMedtech Advanced Manufacturing Expo
Medical Sector Advanced Manufacturing Sector
Date: 20-21 May 2021 Date: 18-20 November 2020
Location: Melbourne, VIC Location: Sydney Showground, NSW
www.ausmedtech.com.au www.advancedmanufacturingexpo.com.au
Australian National Field Days CIVENEX
Agriculture Sector Infrastructure Sector
Dates: 22-24 October 2020 Date: 3-4 February 2021
21-23 October 2021 Location: Sydney, NSW
Location: Borenore, NSW www.civenex.com
www.anfd.com.au
AVALON
Aviation / Aerospace Sector
Dates: 23-28 November 2021
Location: Avalon Airport, Geelong, VIC
www.airshow.com.au
37Major Industry Events in New Zealand: 2020/21
HealthTech Conference EMEX
Medical Sector Advanced Manufacturing Sector
Date: 25 June 2020 Date: 12-14 October 2020
Location: Online (webcast) Location: ABS Showgrounds,
www.healthtechweek.nz Auckland
www.emex.co.nz
Fieldays Online BuildNZ
Agriculture Sector Infrastructure Sector
Dates: 13-26 July 2020 Date: 12-13 August 2020
16-19 June 2021 Location: Auckland
Location: Online www.buildnz.com
www.fieldays.co.nz
384. Next Steps Developing a plan of action…
Developing a Plan of Action…

 Focus on                       Know        Access the
               Develop a
short term                       what       resources
               long term
 wins, but                    questions      available
                strategy
   also…                        to ask        to you!

  Strong market knowledge + responsible planning
     is the key to navigating the current situation.

                                                         40
                                                           40
Services Offered
Ohio Development Services Agency (ODSA)
offers several services to assist Ohio companies to:
▌ Better understand your ‘export readiness’,
▌ Identify and assess potential new export markets, and
▌ Identify and engage with potential partners and end-customers.
41
41In-Country Resources for ODSA:
Based in Sydney, Foley & Associates acts as the authorised trade
representative for the state of Ohio in Australia and New Zealand.
We assist companies to:
Prepare for Grow
Understand Establish a
market : international
the market presence
entry sales
Our core services, listed below, are just some of the services available to Ohio companies via the
Ohio Development Services Agency:
Partner Searches &
Market Research Market Visits
Virtual Matchmaking
• Market Assessments • Distributors & Agents • Tailored B2B/B2G
• Regulatory Overviews • Customers & End Users Appointments
• Competitor Analyses • Integrators & Partners • Meeting Programs
• Feasibility Studies • Assistance with /
• Market Entry Strategies Representation at
42
Industry Shows / EventsThank you
Q&A
To learn more, and explore opportunities for business growth into
Australia and New Zealand, please contact:
Tom Bainbridge Angela Foley
Ohio Development Services Agency Foley & Associates (Sydney)
(614) 728-3120 +61 2 9229 855
Tom.Bainbridge@development.ohio.gov angela@foley.net.au
http://development.ohio.gov www.foley.net.auYou can also read