RESULTS PRESENTATION for the six months ended 31 August 2018 - Balwin Properties
←
→
Page content transcription
If your browser does not render page correctly, please read the page content below
RESULTS PRESENTATION for the six months ended 31 August 2018
AGENDA

   FINANCIAL HIGHLIGHTS

   GROUP PROFILE

   OPERATIONAL OVERVIEW

   FINANCIAL OVERVIEW

   LOOKING FORWARD

   ANNEXURE

                          2|
FINANCIAL HIGHLIGHTS

   R 1 193 million               33%
   Revenue

   R 246 million                 14%
   Operating profit

   R 178 million                  9%
   Profit for the year

   38 cents                       9%
   Basic and headline earnings per share

   509 cents                     18%
   Net asset value per share

                                           3|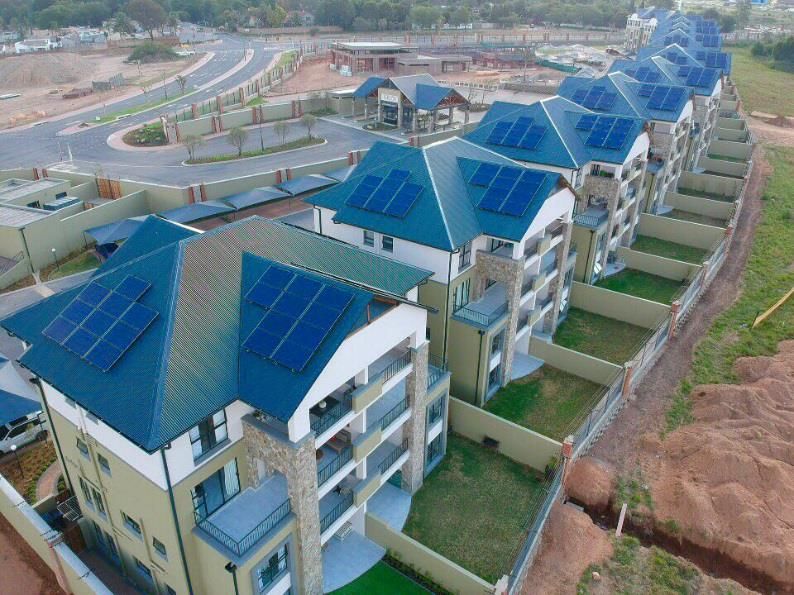
OPERATIONAL HIGHLIGHTS
1 058 apartments handed over (H1FY18: 734)
11 developments currently under construction
4 new developments launched during the period
Average selling price R1 125 488
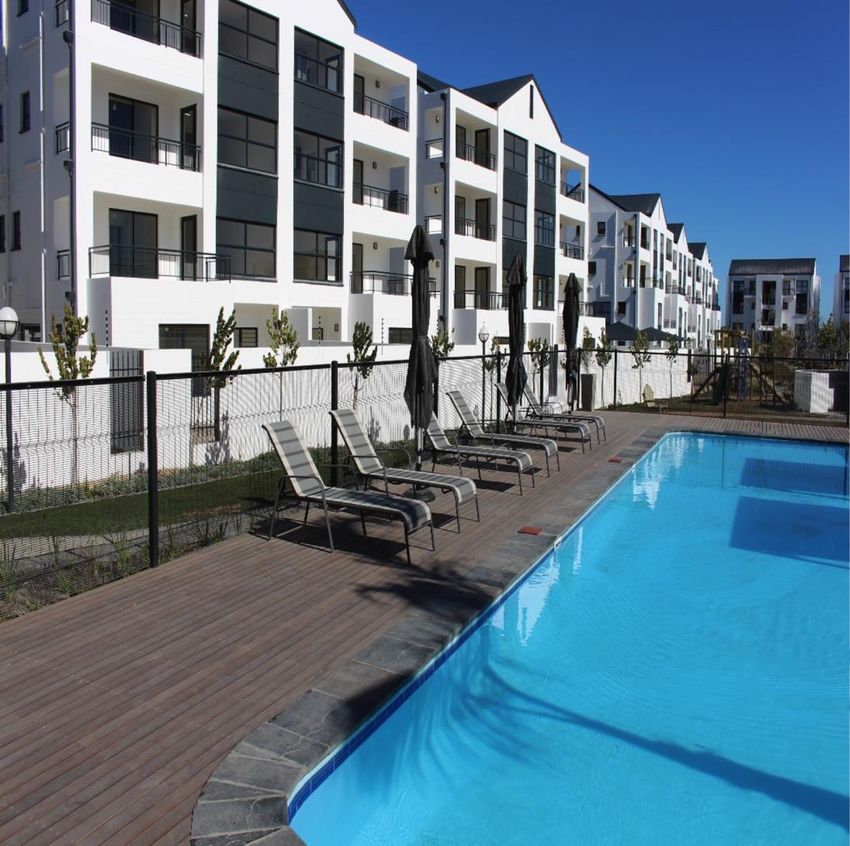
Launch of the first ever Crystal Lagoon in Sub-Saharan Africa at
The Blyde
Opening of the award winning The Polo Fields Lifestyle Centre
4|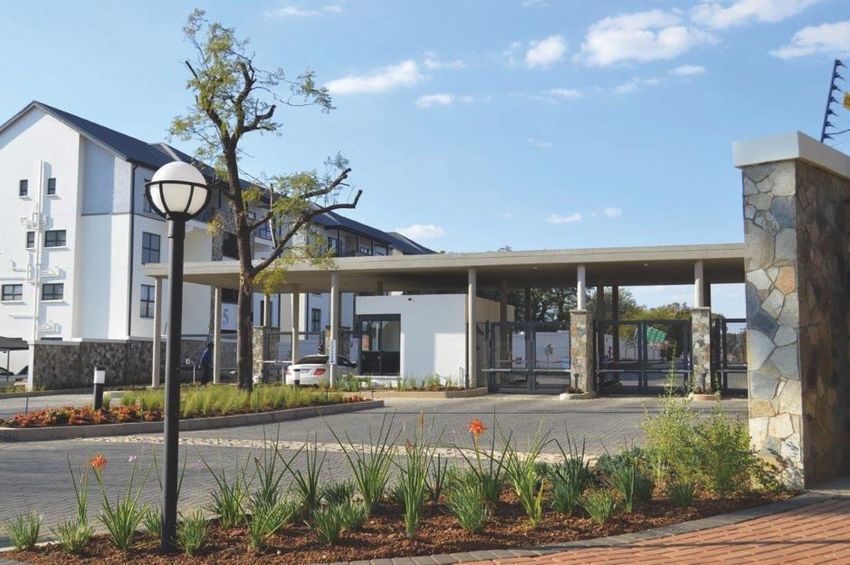
OPERATING MODEL
FINANCIAL AND OPERATIONAL SUCCESS DEPENDS ON CONTINUOUS
DEVELOPMENT

Build to sell model
  •   Selling 30 - 35 apartments per location per month.
  •   Targeting an average profit margin of 35% and higher over the lifecycle of
      each project.
  •   Secured approximate 12 year development pipeline of 40 461 apartments
  •   Maintaining costs.
  •   Execute on existing pipeline (in key target locations).

                                                                                   5|
OPERATING MODEL
KEY ASPECTS OF BALWIN’S BUSINESS MODEL

 •   Keeping a constant rate of construction (continuous development) subject to
     demand – to retain contractors, maintain quality, support build to sell model.
 •   Focuses on the mid-market segment in terms of the pricing and location of
     developments. Key selling points are lifestyle, quality and brand.
 •   Continuous focus on keeping up with international standards and best
     practice in the design and marketing of Balwin developments.
 •   Target areas are JHB North, JHB South, JHB East, Tshwane, Western Cape and
     Kwa Zulu Natal.

                                                                                      6|
OPERATING MODEL
TURNKEY APPROACH

                   7|
OPERATING MODEL
GOVERNANCE

 •   Development opportunities identified
 •   Internal due diligence process followed:
     o Costs
     o Infrastructure
     o Zoning
     o Independent review of nodal residential demand
 •   Presented for management review and recommendation
 •   Presented to the Transactions Committee for review and recommendation
 •   Presented to the board for final approval and implementation

                                                                             8|
PROGRESS ON DEVELOPMENTS
WATERFALL
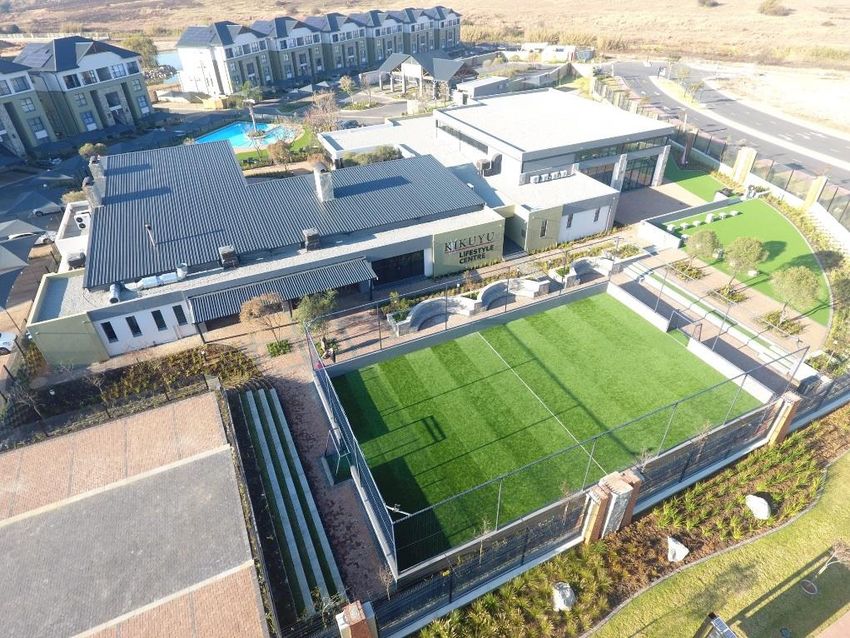
• Kikuyu continues to receive consistent demand – all 215 previously handed
over apartments have registered.
• Increase in demand at The Polo Fields since the launch of the award winning
lifestyle centre.
JOHANNESBURG
• Construction currently underway at four developments.
• The first phase at The Reid, Sandton was successfully handed over in the
period.
• The upgrade of the external road at The Whisken, Kyalami was completed.
• Introduction of the new 12 unit block configuration – adapting to market
demand. Encouraging demand for new configuration.
9|
PROGRESS ON DEVELOPMENTS
TSHWANE
 •   Launch of the first Crystal Lagoon in sub-Saharan Africa in September 2018.
 •   Demand experienced beyond expectations, positive price revision.

WESTERN CAPE
 •   Construction currently underway at three developments.
 •   The Jade, Somerset West continues to enjoy sustained demand with
     approximately 70% of the development already sold.
 •   Registration achieved of the first two phases of De Zicht, Durbanville.
 •   Won the “Apartment, For South Africa” award for its Paardevlei Square
     development.

KWA-ZULU NATAL
 •   Construction commenced in the period with strong interest.
 •   First five phases are sold out and the first phase is expected to be handed over
     in the 2019 financial year.

                                                                                        10 |
MONTHLY SALES
Note - sales include all apartments contracted and do not necessarily relate to the financial period or
the next financial period.
11 |ANNUITY INCOME
• Balwin Rentals Proprietary Limited
o Commitment to deliver the rental model through strategic alliances.
• Balwin Fibre Proprietary Limited
o Fibre network provider.
o The business is intended to operate in all Balwin developments with a mandate to
protect the interests of all Balwin clients while earning an attractive return.
o Income will be generated by line rental to ISPs and tower rental.
Fibre Installed to date:
• Solar Africa Proprietary Limited
A partnership agreement in which Balwin Properties earns a 33% profit share.
12 |FINANCIAL REVIEW
Jonathan Weltman
Chief Financial OfficerAPARTMENTS HANDED OVER IN H1 FY19
Johannesburg Total: 591
The Polo Fields 170
Kikuyu 128
Westlake 73
The Whisken 69
The Reid 67
Amsterdam 61
Malakite 1
Balboa Park 22
Tshwane Total: 192
The Blyde 192
Western Cape Total: 275
De Zicht 99
The Jade 60
The Sandown 52
Paardevlei Lifestyle Apartments 48
Paardevlei Square 11
Paardevlei Duplex Houses 5
TOTAL 1 058
14 |FINANCIAL REVIEW
REVENUE
• Increased by 33% - result of increase in the number of apartments to 1 058 (H1FY18: 734)
• The average selling price per apartment reduced marginally due to different product mix
• Forecasted continued reduction in selling price due to configuration of block in response
to market demand – no impact on the gross profit margin
Classic Model
August 18 August 2017
Apartment Number
Average price Number apartments Average price
type apartments
1 Bedroom R802 727 R876 686
363 271
2 Bedroom R1 315 859 R1 317 968
169 114
3 Bedroom R1 510 165 R1 481 154
292 218
TOTAL
824 603
Elite Model
August 18 August 2017
Apartment Number
Average price Number apartments Average price
type apartments
1 Bedroom R966 844 - -
35
2 Bedroom R1 630 484 R1 964 902
79 36
3 Bedroom R2 677 301 R2 432 445
120 95
TOTAL
234 131
15 |AVERAGE SELLING PRICE (*)
16 |FINANCIAL REVIEW
GROSS PROFIT
• Gross profit margin of 27.2% (H12018: 32.4%).
• The decline is a result of:
o absorption of increase in the VAT rate into the selling price.
o sales promotions - contributed to the strong demand for the apartments.
o large number of early stage developments included in sales mix.
OPERATING EXPENSES
• Inflationary based increase in operating costs.
• Cost management remains a focus area for management.
17 |FINANCIAL REVIEW
EARNINGS PER SHARE
• 9% increase from prior period to 38 cents (2017: 35 cents).
FUNDING STRUCTURE AND COSTS
• Development finance is obtained on a phase-by-phase basis.
• Secured against the pre-sales of the specific phase being financed.
• Obtained at an approximate loan to value of 70% with the remainder of the construction
costs financed through equity.
• Debt to equity ratio as at end of the reporting period is 15%.
18 |SUMMARISED STATEMENT OF
COMPREHENSIVE INCOME
GROUP (R’000)
6 months ended 6 months ended
31 August 2018 31 August 2017
Revenue 1 193 150 894 077
Cost of sales (867 563) (604 226)
Gross profit 325 587 289 851
Other income 1 049 2 162
Operating expenses (80 195) (75 238)
Operating profit 246 441 216 775
Investment revenue 2 613 10 416
Net finance income (2 427) (419)
Profit before tax 246 627 226 772
Taxation (68 727) (63 694)
Profit for the year 177 900 163 078
Other comprehensive income 144 686
Total comprehensive income 178 044 163 764
Basic and diluted earnings per share
Basic (cents) 37.85 34.70
Diluted (cents) 37.68 34.54
Key ratios:
Gross profit margin 27% 32%
Total comprehensive income/revenue 15% 18%
Effective tax rate 28% 28%
19 |SUMMARISED STATEMENT OF
FINANCIAL POSITION
GROUP (R’000)
31 August 2018 31 August 2017
Non-current assets
82 694 56 978
Current assets 3 691 162 3 057 020
Developments under construction 3 027 910 2 413 677
Cash and cash equivalents 62 339 266 671
Other current assets 600 913 376 672
Total assets 3 773 856 3 113 998
Shareholders’ equity 2 390 790 2 030 893
Non-current liabilities 352 912 583 992
Current liabilities 1 030 154 499 113
Development finance 901 696 389 528
Other current liabilities 128 458 109 585
Total equity and liabilities 3 773 856 3 113 998
20 |DEVELOPMENTS UNDER CONSTRUCTION
(LAND VS TOP STRUCTURES)
R’000
Construction costs 1 521 396
Land and land contribution costs 1 506 514
TOTAL 3 027 910
21 |SUMMARISED STATEMENT OF
CASH FLOWS
GROUP (R’000)
6 months ended 6 months ended
31 August 2018 31 August 2017
Cash flow from operating activities
Cash generated from operations
185 370 103 868
Interest Income
2 613 10 416
Finance costs
(26 313) (23 334)
Taxation paid
(93 852) (128 136)
Net cash generated from/(used in) operating activities
67 818 (37 186)
Net cash (used in)/from investing activities
(8 244) 7 713
Net cash used in financing activities
(97 268) (250 825)
Total cash movement for the period
(37 694) (280 298)
Cash at the beginning of the period
100 033 546 969
Total cash at the end of the period
62 339 266 671
22 |FUNDING STRUCTURE
GROUP (R’000)
6 months ended 6 months ended
31 August 2018 31 August 2017
Total liabilities 1 383 066 1 083 105
Non-current liabilities
352 912 583 992
Current liabilities*
1 030 154 499 113
Equity 2 390 790 2 030 893
Debt to equity ratio 15% 29%
Average cost of borrowing 10.0% 10,5%
*Development finance is funded on a phase-by-phase basis secured against pre-sales
23 |LOOKING FORWARD
Steve Brookes
Chief Executive OfficerTHE FUTURE
• 1 789 apartments pre-sold for H2FY19 and beyond
• Management is focusing on executing on its existing pipeline
• Focus on operational performance and execution across all developments
• Careful capital allocation and cash flow management remain priorities
• Board will reconsider the dividend policy at year end
• The group is focused on transformation and empowering previously disadvantaged
communities
• Address market dynamics (configuration, pace, pricing) to maintain healthy level of sales
– complimented to adaptability of the new block configuration
• Drive annuity income opportunities
25 |INVESTMENT CASE
• Highest gross margin for a listed residential property developer globally due to in-house
construction management, in-house sales and strong budget controls
• Low operating expenses provide sufficient margin of safety, gross margin needs to
decline significantly before a loss is incurred
• High barriers to entry – low levies and efficiencies obtained through economies of scale
• Phased development where the rate of construction is matched to the rate of sales
• Strong management with more than 22 years experience, management are the
founding directors and the majority shareholders, therefore management is aligned to
the interests of other shareholders
• Long term relationship with suppliers and sub-contractors nationally which results in cost
savings and high quality homes
• Long term development pipeline in key strategic locations
• Well positioned to address the undersupply of quality, affordable housing in the middle
market income market
26 |BALWIN FOUNDATION
Core Focus
01
EDUCATION:
01
Scholarships, Bursaries and Learnerships to
support and empower the youth in areas
related to the building industry. EDUCATION
DEVELOPMENT:
02 Building related trade training skills development
and short courses to increase employability for
Registered
in 2016.
the unemployed from local communities, as well Started
as development of SMMEs in order to promote job operating in
creation. May 2017.
02 03
03 FUNDING:
Obtain various sources of sustainable funding in DEVELOPMENT FUNDING
order to fund various causes and develop local
communities, schools, sportsgrounds etc.BALWIN FOUNDATION
Education & Development
Bursary Programme Learnership Programmes
11 86
Learners
managed
on
4
Tertiary
Students Learnership
programmes
5
Scholars Construction
Accredited Trade Skills Training
Supervision of
13 19 89 484 293
Construction
Processes
Months Courses Training Days Certificates Individuals Business
Management
Gardening,
Horticulture &
New Venture
CreationANNEXURE
GROUP PROFILE
• Listed on the JSE in 2015.

• Founded in 1996.

• Balwin operates a build-to-sell model, currently developing and selling
  between 2 000 – 3 000 residential apartments each year with capacity to
  scale up to 5 000 apartments in the current nodes.

• Success built on selling 30 - 35 apartments per location, per month in
  diverse locations.

• Develop predominantly in key target nodes in the Western Cape (Somerset
  West and Milnerton) , Johannesburg (South, East, North and Waterfall),
  Tshwane (East only) and KwaZulu-Natal (Ballito and Umhlanga).

• Mid-market 1, 2 and 3 bedroom sectional title apartments.

• Typical pricing from R599 900 - R1 999 900.

                                                                            30 |
STRATEGY (*)
CLASSIC BUSINESS MODEL
• Core business
• Focus on providing a quality product to the middle-income market
• Benefit from economies of scale, in-house construction and management whilst
retaining flexibility throughout individual phases of large developments
• Price range: R599 000 to R1 999 900
ELITE BUSINESS MODEL
• Continuously tailoring developments to match market demand
• Upmarket developments in select nodes where higher selling price can be
achieved
• Developments built to higher specifications
• Price range: R1 999 900 to R2 999 900
31 |DEVELOPMENT PIPELINE
Total
Total apartments
Expected Expected Total Total apartments sold but not
commencement date of Total apartments apartments apartments recognised in recognised in Total unsold
Development date Completion Status (*) in development sold registered revenue revenue apartments
Waterfall
Kikuyu Commenced March 2022 A 1 270 545 336 342 203 725
The Polofields Commenced March 2022 A 1 512 558 478 480 78 954
Waterfall Fields TBC TBC I 6 752 - - - - 6 752
Waterfall Ridge TBC TBC I 10 320 - - - - 10 320
Total 19 854 1 103 814 822 281 18 751
Johannesburg East
Malakite Commenced Complete C 290 290 279 279 11 -
The Reid Commenced June 2022 A 1 294 171 - 8 163 1 123
Westlake 1 and 2 Commenced TBC A 1 132 820 814 815 5 312
Total 2 716 1 281 1 093 1 102 179 1 435
Johannesburg North
Amsterdam Commenced October 2019 A 1 040 1 040 688 700 340 -
The Whisken Commenced November 2020 A 1 492 302 - 108 194 1 190
Total 2 532 1 342 688 808 534 1 190
Johannesburg South
Balboa Park Commenced Complete C 410 409 406 406 3 1
Majella Park October 2019 October 2020 I 280 - - - - 280
Total 690 409 406 406 3 281
KwaZulu Natal
Ballito Hills Commenced TBC A 3 500 297 - - 297 3 203
Marshall Dam TBC TBC I 1 092 - - - - 1 092
Total 4 592 297 - - 297 4 295
(*) A – Active, I – Inactive, C - Complete
32 |DEVELOPMENT PIPELINE
Total
Total apartments
Expected Expected Total Total apartments sold but not
Commencement date of Total apartments apartments apartments recognised in recognised in Total unsold
Development date Completion Status (*) in development sold registered revenue revenue apartments
Tshwane
The Blyde Commenced TBC A 3 544 276 - 197 79 3 268
Total 3 544 276 - 197 79 3 268
Western Gape
De Zicht Commenced October 2020 A 876 314 179 180 134 562
Paardevlei Lifestyle Estate Commenced February 2021 A 342 80 15 41 39 262
Paardevlei Square Commenced Complete C 87 65 64 64 1 22
The Jade Commenced August 2019 A 432 288 60 60 228 144
The Sandown Commenced Complete C 636 629 610 615 14 7
The Huntsman January 2019 June 2023 I 1 044 - - - - 1 044
Gordons Bay TBC TBC I 1 300 - - - - 1 300
Fynbos February 2019 TBC I 1 116 - - - - 1 116
Paarl TBC TBC I 336 - - - - 336
Total 6 169 1 376 928 960 416 4 793
Rentals
Greenlee November 2018 December 2023 I 1 728 - - - - 1 728
Greenpark Commenced June 2021 A 1 200 - - - - 1 200
Greencreek TBC TBC I 1 760 - - - - 1 760
Greenwood TBC TBC I 1 760 - - - - 1 760
Total 6 448 - - - - 6 448
Grand Total 46 545 6 084 3 929 4 295 1 789 40 461
(*) A – Active, I – Inactive, C - Complete
33 |CONTACT DETAILS
Stephen Brookes Jonathan Weltman
Chief Executive Officer Chief Financial Officer
Tel: +27 11 450 2818 Tel: +27 11 450 2818
34 |You can also read