The ecosystem service approach to inform the economics of climate change research: Recent developments - Unai Pascual - Basque Centre for ...
←
→
Page content transcription
If your browser does not render page correctly, please read the page content below
The ecosystem service approach to
   inform the economics of climate
         change research: Recent
                    developments

                         Unai Pascual
Motivation for an economic
assessment of ecosystem services
Ecosystems provide many different goods and services of value to people
Provision of ecosystem services usually not taken into account in policy
decisions that affect ecosystems
Distortions in decision-making can undermine the provision of ES thus
negatively affecting society and the environment
Increased interest in understanding the spatial pattern of benefits from ES
No need to try to evaluate everything in monetary terms, e.g., value of species
preservation is probably best left in its own terms
To realize the promise of ecosystem services will need to address issues of
• Economic assessment/Valuation/MCA, etc.
• Incentives
Climate regulation is a key ES to be included in integrated assessments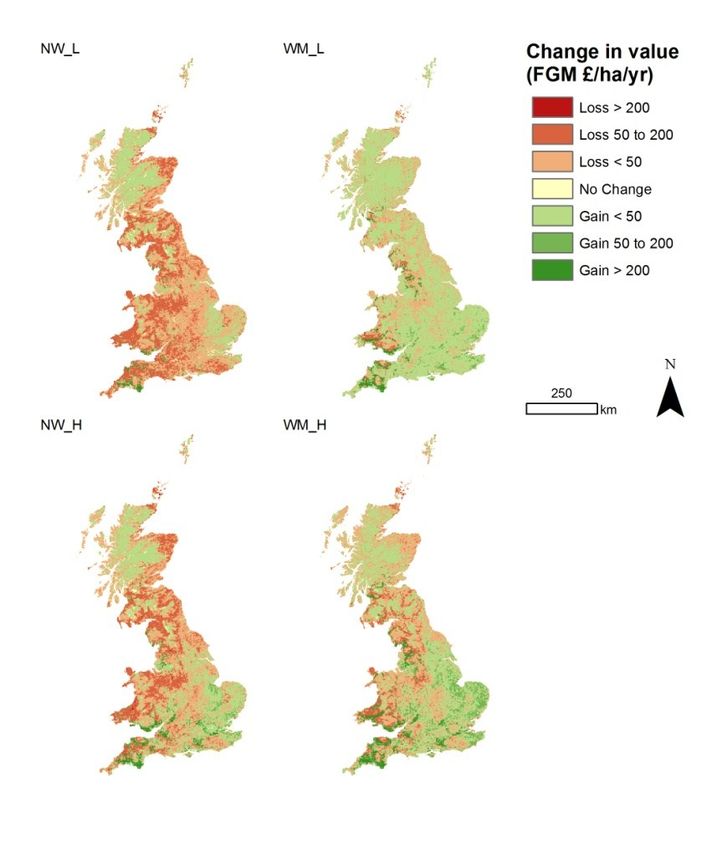
3
A framework for mapping & valuing ES
                         Policy
         INSTITUTIONS              CHOICES
                                                      Information

                                     actions

      VALUES                            ECOSYSTEMS

    valuation                         Production
                                      function
                        SERVICES
                                               Source: Steve Polasky
5
UKNEA (2009-2011)
Full blown sub global assessment
emphasizing economics (follow up of
the MEA)
Evidence source and a methodology
guide for the work of the new EU
Working Group on ecosystem
mapping (part of the EU’s
Biodiversity strategy to 2020).
6
Economic ES assessment for the UK
“The UK National Ecosystem Assessment is a vital step forward in our ability to
understand the true value of nature and how to sustain the benefits it gives
us….The findings of this assessment have played a big part in shaping our
forthcoming Natural Environment White Paper that will help us revitalise our
towns and countryside.” (UK Environment Secretary, Caroline Spelman ).
Economic analysis of scenarios conducted for the UK NEA
Natural science and economic valuation to examine the impact of land use
change envisioned under a number of scenarios
Results show that the consideration of ecosystem service values, inc. Climate
regulation, can substantially alter decision outcomes
7The Economic Analysis for the
UK National Ecosystem Assessment
Ian J. Bateman,, Amii Harwood, David J. Abson, Barnaby Andrews, Andrew Crowe, Steve
Dugdale, Carlo Fezzi, Jo Foden, Roy Haines-Young, Mark Hulme, Paul Munday, Unai
Pascual, James Paterson, Grischa Perino, Antara Sen, Gavin Siriwardena, Mette Termansen.
8 UKNEA as example of the potential use of the ecosystem service framework to
explicitly acknowledge both temporal and spatial trade-offs across different
ecosystem services
Impetus for integrated assessments through the ecosystem service approach
(ESA) and link it with CBA
Depart from the idea that values are constant across a variable area, e.g., Entry
Level Stewardship scheme in England
Climate Change explicitly accounted for (scenarios B1 and A1)
Thorny problem with valuing biodiversity and its role as source of supporting
services
9UK-NEA scenarios do provide a useful testbed for methodological investigation
Climate regulation
Provisioning service: ES: Carbon storage
Agricultural and GHG balance
production
Cultural service:
Biodiversity Open access
(constraint variable) recreation & Urban
Cost greenspace amenity
Effectiveness
1012 Scenarios = 6 x 2
1. World Markets (WM): The goal is economic growth and the elimination of trade
barriers
2. Nature at Work (NW): ES are promoted through the creation of multifunctional
landscapes
3. Go with the Flow (GF): Current trends are assumed to continue
4. Green and Pleasant Land (GPL): A preservationist attitude to ecosystems
5. Local Stewardship (LS): Society strives to be sustainable within its immediate
surroundings;
6. National Security (NS): Emphasis on increasing self-sufficiency;
Expected climate change impacts included considering:
the low (B1) and high emission (A1F1) IPCC scenarios
spatially disaggregated by the UK Climate Impacts Programme (UKCIP)
11Example .of WM and NW scenarios
Wold Markets (WM) scenario:
• regulation of all forms is rolled back
• Most substantial increases in population and urban extent
• environmental and planning restrictions and greenbelt rules are relaxed
• Previously protected grasslands and heathlands are lost
Nature at Work (NW) scenario:
• Enhances existing regulations ensuring a static urban extent
• Major increases in grasslands, heathlands and all types of woodland, especially
broadleaves as forested areas.
• Significant contraction in farmland.
12UKNEA scenarios for CBA
Mean land use coverage and population figures for the UK: Year 2000 baseline
Variable Base WM-H WM-L NW-H NW-L GF-H GF-L GPL-H GPL-L LS-H LS-L NS-H NS-L
Δ population 0 21% 21% 6% 6% 17% 17% 2% 2% 0% 0% 10% 10%
Δ real income 0 2% 2% 3% 3% 1.5% 1.5% 2% 2% 0.5% 0.5% 1% 1%
% urban 6.7 14.3 14.6 6.6 6.7 7.6 8.1 6.7 6.7 6.4 6.5 7.0 6.8
% heathlands 13.8 11.7 11.5 16.6 15.6 15.0 14.8 14.6 14.8 14.2 14.1 8.2 8.0
% grasslands 15.9 13.7 13.3 20.2 20.0 18.3 17.6 25.3 22.1 21.9 21.5 8.4 8.2
% conifer 5.3 6.2 5.0 8.5 8.8 4.2 4.2 3.8 3.8 4.8 4.8 18.9 18.2
% broadleaf 6.3 5.3 5.8 10.6 10.6 9.8 9.4 11.1 11.9 7.7 6.7 6.4 7.2
% farmland 43.5 39.3 41.2 27.8 28.9 35.5 37.5 29.3 31.5 36.6 38.1 42.0 43.2
% other 8.3 9.5 8.6 9.7 9.3 9.5 8.5 9.1 9.1 9.4 8.3 9.1 8.3
13Climate regulation
Provisioning service: ES: Carbon storage
Agricultural and GHG balance
production
Cultural service:
Biodiversity Open access
(constraint variable) recreation & Urban
Cost greenspace amenity
Effectiveness
14Provisioning services (agriculture)
Over 1 million sets of grid-sq records for the period between 1969 and 2006
• Agricultural Census data of land use shares, livestock numbers and other farm data at
a 2km grid square (400ha)
Farm gross margin (FGM) estimates used
Optimal land use shares estimated allowing for corner solutions
Scenarios assumed constant real values for ag prices
Prediction of climate change impacts on e.g., growing season precipitation and
temperature used to estimate the value of CC related provisioning services
• Detailed data on the physical environment (soil characteristics, slope, etc.) and
climatic determinants of land use.
15Average annual change in market values in UK agriculture (£million, 2010)
• WM better than NW for ag (not
surprising)
• CC good for ag overall but
regional disparities predicted
16Climate regulation
Provisioning service: ES: Carbon storage
Agricultural and GHG balance
production
Cultural service:
Biodiversity Open access
(constraint variable) recreation & Urban
Cost greenspace amenity
Effectiveness
17GHG emissions in the UK (1990-2011)
18Climate regulation (carbon storage & GHG balance)
Land use change implications for GHG emissions need to be considered
• Methane (CH4) from livestock
• Nitrous oxide (N2O) from the application of inorganic fertilizers
• Carbon dioxide (CO2) associated with changes in carbon stocks in above and below
ground biomass + burning of fossil fuels to power agricultural machinery + production
of fertilizers and pesticides
Carbon equivalent values based on the UK official non-traded carbon DECC
prices
• Irrespective of which prices it is found that increases in Ag values under the WM
scenario are offset by the costs of increased GHG due to land use change
• Lower Ag values under the NW scenario are more than compensated by reductions in
the costs of GHG emissions
Abson, D., Termansen, M., Pascual, U., Aslam, U., Fezzi, C. and Bateman, I.J. (forthcoming) Valuing climate change effects upon
UK agricultural GHG emissions: Spatial analysis of a regulating ecosystem service, Environmental and Resource Economics
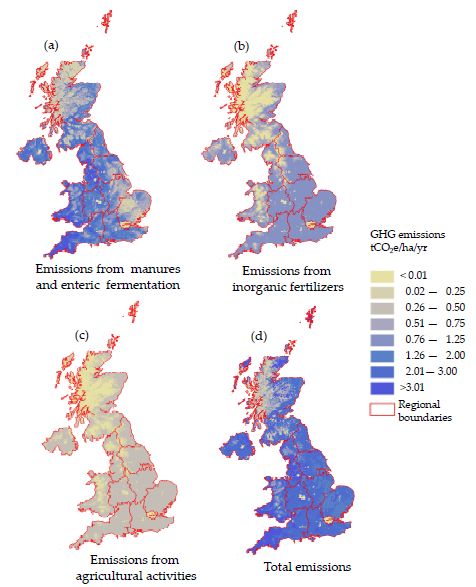
19Estimated GHG fluxes from UK agriculture for the
baseline year (2004)
GHG emissions from ag
land: 47.2/ million tCO2e
for the baseline year
6-8% of total emissions.
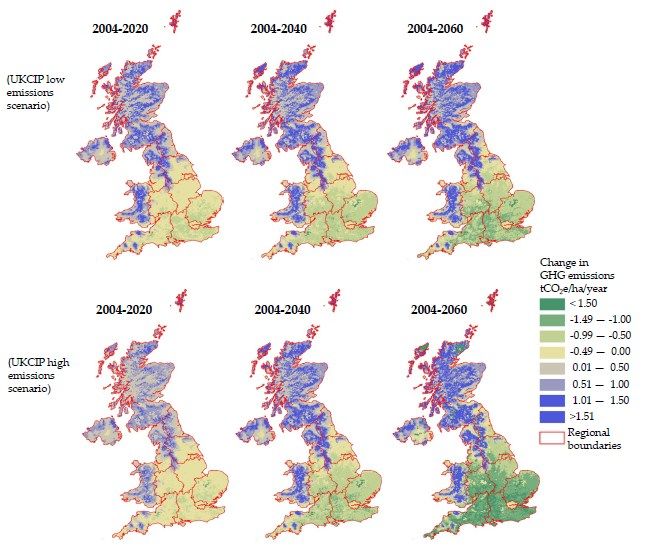
20Predicted per hectare agricultural GHG emissions
under the two cc scenarios
rough grazing
to grassland &
beef production
arable to
grasslands
21Regional based GHG emissions and costs
emissions
costs
22Climate regulation
Provisioning service: ES: Carbon storage
Agricultural and GHG balance
production
Cultural service:
Biodiversity Open access
(constraint variable) recreation & Urban
Cost greenspace amenity
Effectiveness
23Open access recreation
Meta-analysis of 250 previous estimates of the value of a recreational visit to
estimate the influence of the ecosystem type on recreational values
• A trip generation function is used to predict visits from every small area Census unit
across the UK to a 1 km square grid across the country
• Data on 48,000 households who together visited over 15,000 unique locations
This allows the estimation of a spatially and ecosystem sensitive total value of
visits and how that value varies compared to actual land use
Main result: recreational gains or losses trends are greatest near to population
centres
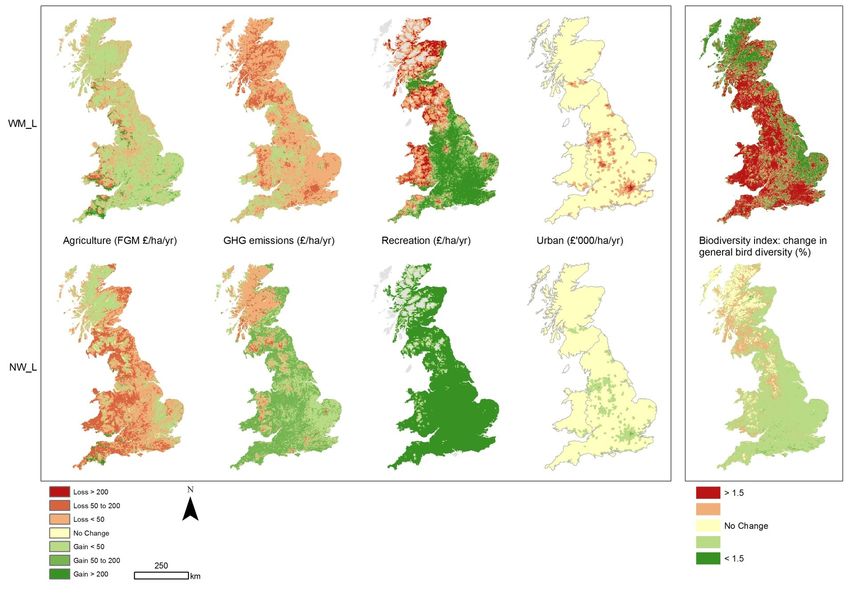
The loss of greenbelt land around cities under the WM scenario results in major
losses of recreational value
24Climate regulation
Provisioning service: ES: Carbon storage
Agricultural and GHG balance
production
Cultural service:
Biodiversity Open access
(constraint variable) recreation & Urban
Cost greenspace amenity
Effectiveness
25Biodiversity
Non-use values has attracted the most attention amongst the valuation community.
• BUT non-use values are typically assessed via stated preference (WTP) techniques which
tend to reflect preferences for charismatic species + inconsistent with its role regarding
supporting service
UKNEA approach: find the cost-effective solution to satisfying the biodiversity
conservation constraint
• Simpson index of Bird diversity (out of 96 bird species) are modelled as a function of land
use for each 1km square across scenarios
Example:
• The loss of greenbelt areas results in declines under the WM scenario
• The pro-environmental characteristics of the NW scenario results in biod increases
26aggregating market vs. non market ES values
Climate regulation
Provisioning service: ES: Carbon storage
Agricultural and GHG balance
production
Cultural service:
Biodiversity Open access
(constraint variable) recreation & Urban
Cost greenspace amenity
Effectiveness
27Spatial ES value assessment, £/ha/yr (WM vs NW
under B1 scenario)
loss
gain 28Results (change from baseline 2000 to 2060, £ million
p.a) WM WM NW NW GF GF GPL GPL LS LS NS NS
Scenario →
High Low High Low High Low High Low High Low High Low
↓Measure Monetised impacts (£ millions p.a.; real values, £ 2010)
Market agricultural output values1 880 420 -110 -510 590 220 -30 -290 430 350 1,200 680
Non-market GHG emissions2 -1,680 -2,130 4,570 4,590 -810 -800 2,410 2,410 570 -100 3,400 3,590
Non-market recreation3 -820 5,040 23,910 24,170 4,120 5,710 5,160 6,100 1,100 1,540 3,340 4,490
Non-market urban greenspace4 -24,000 -24,000 4,730 4,730 -1,960 -1,960 2,350 2,350 2,160 2,160 -9,940 -9,940
Total monetised values5 -25,620 -20,670 33,100 32,980 1,940 3,170 9,890 10,570 4,260 3,950 -2,000 -1,180
Non-monetised impacts8
9
Change in farmland bird species 0 0 -1 -1 0 0 0 0 0 0 -1 -1
Bird diversity (all species)10 -- + ++ ++ ++ ++ ++ ++ - - ++ +++
Rank: Market values only 2 6 10 12 4 8 9 11 5 7 1 3
Rank: All monetary values 12 11 1 2 8 7 4 3 5 6 10 9
Rank: Positive welfare values and
6 5 2 1 3 4
no farmland bird losses
Rank: Positive welfare values, no
farmland bird losses & general 4 3 2 1
biodiversity gains
Rank: Positive welfare & market
values, no farmland bird losses & 2 1
general biodiversity gains
Scenarios are as follows: WM = World Markets; NW = Nature at Work; GF = Go with the Flow; GPL = Green and Pleasant Land; LS =
Local Stewardship; NS = National Security.
29Conclusions
1. Interdisciplinary approach is seen as superior in integrated ES assessments in
the context of climate change research
2. Restricted analysis focussing solely upon market priced goods yields a very
different view on which scenario is superior than a more broadly based
assessment which also considers non-market values
3. Such assessments can be consistent with a “critical natural capital” approach
(strong sustainability) Where there are limits to estimating robust values (e.g.,
biodiversity benefits) then a constraints approach can still help decision makers.
4. Caveats:
1. Simplicity of the synthesis analysis Assumption of linear pathways and ignoring
possibilities of non-linearities, thresholds and feedback effects
2. Potential for double counting, e.g., urban amenities and recreation
5. Full integrated assessment needs to be complemented with other methods,
including participatory valuation and multicriteria assessment tools
30You can also read