February 2021 polar vortex sends Texas natural gas markets spinning - ICF
←
→
Page content transcription
If your browser does not render page correctly, please read the page content below
February 2021 polar vortex sends Texas natural
gas markets spinning
By Andrew Griffith and Michael Sloan

The energy crisis in the ERCOT region (and surrounding regions) is the result of an extraordinary weather
event driving a combination of increases in demand for both electricity and natural gas, decreases in the
production of natural gas due to well and processing plant freeze-ups, and outages on the power system
due to both freeze related plant outages and lack of fuel. The increase in demand and decrease in supply
has created an unbalanced market for both power and natural gas, resulting in dramatic power outages as
well as historic high prices for both natural gas and electricity.

This ICF analysis focuses on the natural gas system in Texas. Critical conclusions include:

   •   Well and processing plant freeze-ups reduced natural gas production in Texas by more than 50%.
   •   In Texas, most of the decline in production was offset by a decline in natural gas pipeline and LNG
       exports, however that still did not leave sufficient gas to meet the surge in demand.
   •   The loss of exports from Texas to other nearby states was offset in part by very high regional
       storage withdrawals.
   •   Despite the loss in production, natural gas consumption in Texas, including both LDC and power
       generation demand, reached historical winter highs early in the crisis.

See ICF’s analysis – Winter storms wreak havoc on ERCOT grid for a preliminary assessment of the power
system during this crisis.

                                                       1                                @Copyright ICF 2021
The short-term inability to increase gas supply, combined with extremely inelastic demand for natural
gas, including power generation gas demand is resulting in a classic market response to an inelastic
supply curve and an inelastic demand curve -- extraordinary spikes in price. These prices should drop
nearly as quickly as they spiked when power and gas demand decline with warmer weather and the
production freeze-ups dissipate, although the current level of storage withdrawals may lead to upward
price pressure later in the season.

Natural gas supply

Natural gas production is down dramatically due to well and processing plant freeze-offs. As a result of
well and processing plant freeze-offs and difficulty transporting liquids-heavy natural gas that can freeze,
natural gas production in Texas dropped 52 percent, from 22.3 billion cubic feet per day (Bcf/d) on
February 6th to 11.7 Bcf/d on February 17th. The first signs of a recovery in production were seen on
February 18th, with 1.8 Bcf/d of production returning and bring total production in the state back to almost
13.5 Bcf/d. We do not suspect any foul play or market manipulation in terms of gas supply. We believe the
well and processing plant freeze-offs are real, as most producers do not have enough market power to
impact prices by withholding production, and we suspect that most, or all the producers are out
desperately trying to get the wells online to take advantage of the prices.

                                            Source: OPIS PointLogic

It is anticipated that the usual quick recovery from freeze-offs might take longer than it has historically
given how extreme these production cuts have been and the widespread nature of the freezing in
multiple production and processing systems.

                                                        2                                 @Copyright ICF 2021
Production loss partially offset by a decline in natural gas net exports
The decline in production in Texas has been offset to a degree 1 by declines in net pipeline exports and
LNG exports out of the state.
• Net pipeline exports from Texas to the surrounding states and Mexico declined significantly. Texas
was exporting 13.0 Bcf/d of gas to its neighbors on February 7th, but it was only exporting a net of
2.9 Bcf/d on February 17th. 3.7 Bcf/d of February 17th’s pipeline exports were flowing to Mexico
and the 1.1 Bcf/d of gas was flowing into the state from sources west of Texas. This was an
extraordinary change for a state that is usually the primary source of gas for Mexico and much of
the Southwest US.
• LNG export feedgas deliveries in the state were almost completely halted after recently exceeding
4.0 Bcf/d. Natural gas delivered to the Texas LNG liquefaction facilities was down to 0.05 Bcf/d. 2
Source: OPIS PointLogic Source: OPIS PointLogic
Much of the decline in natural gas pipeline exports into other regions has been offset by an increase in
regional storage withdrawals. However, the increase in storage withdrawals appears to be primarily in the
South Central storage region outside of Texas:
• The full South Central storage region, which includes Texas, has been withdrawing 22 Bcf/d of gas
from its storage facilities since February 12th. Prior to this week, the South Central storage region
withdrawals were averaging 6 Bcf/d. Hence regional storage withdrawals have increased by 16
Bcf/d. 3
1
Under more normal circumstances, we would have anticipated that the increase in demand associated with the winter weather
would have resulted in a significant increase in gas supply in the state, hence the ability to offset lost production should not be
interpreted to indicate that the state was able to address to offset the impact of the lost production.
2
This is in line with Texas Governor Greg Abbott’s February 18th order preventing Texas natural gas producers from selling their gas
outside of the state. It is unclear whether the governor’s order is enforceable given the firm contractual commitments that Texas’
natural gas producers and pipelines have, thus we are still seeing some exports from the state on the pipelines.
3
It is worth noting that, if this level of storage draw continues, we are likely to see continued high prices later in the season. At the
current rate of depletion, the South Central storage inventory would reach its 2014 lows in two weeks and there would still be
another month in the expected storage withdrawal season.
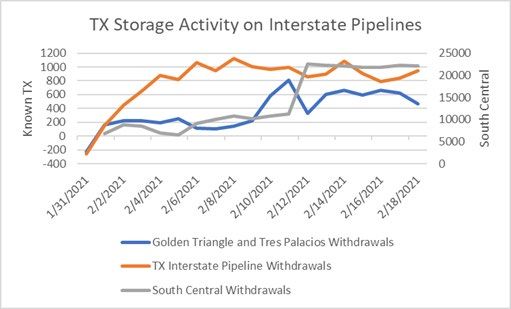
3 @Copyright ICF 2021• Data is not yet available for storage withdrawals specifically for Texas. Texas storage capacity
comprises roughly one third of South Central storage capacity, and this would simplistically imply
that Texas withdrawals have increased to 5-6 Bcf/d. However, we do have initial data on storage
withdrawals in Texas from the interstate pipelines, which does not indicate a significant increase in
storage withdrawals in Texas.
Source: EIA Historical Inventory and OPIS PointLogic Estimated Daily Withdrawals
Overall, the decline in production in Texas has been offset in part by the significant drops in natural gas
exports from Texas (both pipeline and LNG), and the loss of regional supply outside of Texas appears to
have been offset by larger than normal regional storage withdrawals outside of Texas. With Texas and
regional gas supply at maximum possible output given the conditions, and with upward pressure on
demand, Texas is in for some continued high prices and stressed supply until production can ramp up.
Demand for natural gas, and deliveries of natural gas set records for winter natural gas delivery
One of our data sources, PointLogic, shows in its preliminary estimated power generation gas demand in
Texas that February 14th set the record for winter gas demand in Texas. It may be revised when more
data becomes available, and it may or may not be accounting correctly for the gas power plant outages.
We do know, however, that February 14th set the record for the most deliveries from interstate pipelines
to power generation gas plants in Texas in any season with 2,325 MMcf of deliveries.
Deliveries to gas utilities (LDCs) from interstate pipelines also set a record on Feb 13 with 1,049 MMcf of
demand. The deliveries to the gas utilities and the gas power plants have been declining since the 14th,
however. Buildings with gas furnaces for heating may not have been able to operate them without
electricity, an interdependence that could have contributed to this decline in utility demand. Additionally,
given that the priority is to deliver gas to the utilities with critical needs, and even those deliveries have
declined since the 14th, it is not surprising that deliveries to the power plants have also declined. As
shown in the charts below, the estimated total deliveries to gas power plants fell from a record 7.6 Bcf on
February 14th to 4.9 Bcf on February 16th. There has been a small rebound since then. Note that the
demand shown is a preliminary estimate.
4 @Copyright ICF 2021Source: OPIS PointLogic Source: OPIS PointLogic
Power generator gas supply commitments
Generally, only a subset of the power generators has firm natural gas supply and transportation
arrangements that guarantee gas delivery under system design conditions. However, it does appear that
most of plants on the interstate pipelines (for which the contracts are public) do hold firm capacity. The
companies that have access to delivered gas under contract are making outsized profits this week.
However, this is a once in 10-year (or more) event.
Source: OPIS PointLogic
The gas plants on the interstate pipelines (about one third of gas plants in Texas) generally appear to
have firm transportation and/or firm storage contracts. The pipelines have been issuing operational flow
order (OFO) and Force Majeure notices over the past few days, however, and we are seeing a large
5 @Copyright ICF 2021decline in deliveries to the power generators on those pipelines. The pipelines are citing the drop in
production and lower system pressure due to the cold weather. Odessa-Ector power plant, for example,
saw deliveries from the El Paso Natural Gas pipeline drop from 159 MMcf on February 12th to 66 MMcf on
February 15th despite having a firm transportation contract from 100 MMcf of gas. To a degree, this is
consistent with the Texas Railroad Commission order to prioritize gas utilities serving critical needs
customers over gas power plants. 4
Prices
Prices in Texas have hit extreme highs in both West Texas and East Texas, hence the need for the
logarithmic scale in the chart below. Power generators are competing in the daily market for both natural
gas commodity and pipeline transportation.
As gas costs increase, the power price also increases (until it hits the ceiling). The impact of the natural
gas price on power generation natural gas demand is small in these cases, and gas prices can increase
incredibly fast. Additionally, most of the gas flowing is not being sold at these prices; most of the gas is
sold on monthly contracts and is flowing on firm pipeline capacity contracts. It is the buyers in the daily
market that are really suffering, although even the LDCs are scrambling to find supply to meet peak load.
They likely hold the necessary pipeline capacity but may not have all the supply that they need. Some of
the combined cycle gas power plants that run almost all the time like the Odessa-Ector power plant and
the Magic Valley Generating Station, however, took deliveries in excess of their firm transportation
contracts as recently as February 13th and 14th respectively, which would imply that were not buying
100% hedged gas.
The prices shown in the chart are the daily cash price and not necessarily reflective of what a customer
with a long-term supply agreement is paying.
Source: OPIS
4
https://www.rrc.state.tx.us/media/cw3ewubr/emergency-order-021221-final-signed.pdf
6 @Copyright ICF 2021One of the unusual aspects of the current crisis is the price spread between the Texas hubs and Henry
Hub in nearby Louisiana. This price spread – $140-$340/MMBtu since February 13th is extraordinarily high.
A more typical price spread for this time of year would be $0.05/MMBtu at Katy and about $0.70/MMBtu
at Waha. At the very least, this is telling us that there is some inefficiency in how Texas is sourcing its gas
and that it is paying a premium as a byproduct of having a cordoned off power market where record high
Texas power prices are driving gas demand from power generators.
Looking Forward
Storage levels in Texas and the region are being rapidly depleted and there is potential for production to
take a while to ramp up. Industrial customers in Texas and Mexico, along with the LNG export facilities, will
be eager to start receiving their regular gas deliveries, which will mean demand will keep pace with any
returning production. As a result, while prices will drop most of the way back as production returns, they
are likely to remain high relative to pre-vortex levels longer than the cold weather.
Visit us at About ICF
ICF (NASDAQ:ICFI) is a global consulting services
icf.com/energy
company with over 7,000 full- and part-time
employees, but we are not your typical
consultants. At ICF, business analysts and policy
For more information, contact: specialists work together with digital strategists,
data scientists and creatives. We combine
unmatched industry expertise with cutting-edge
Andrew Griffith engagement capabilities to help organizations
Andrew.Griffith@icf.com solve their most complex challenges. Since 1969,
public and private sector clients have worked
+1 703.272.6749 with ICF to navigate change and shape the future.
Learn more at icf.com.
Michael Sloan
Any views or opinions expressed in this white
Michael.Sloan@icf.com
paper are solely those of the author(s) and do not
+1 703.218.2758 have worked with ICF necessarily represent those of ICF. This white
to navigate change and shape the paper is provided for informational purposes only
future. Learn more at icf.com. and the contents are subject to change without
notice. No contractual obligations are formed
Any views or opinions expressed in this directly or indirectly by this document. ICF
MAKES NO WARRANTIES, EXPRESS, IMPLIED, OR
white paper are solely those of the
STATUTORY, AS TO THE INFORMATION IN THIS
author(s) and do not necessarily DOCUMENT.
represent those of ICF. This white paper
is provided for informational purposes No part of this document may be reproduced or
only and the contents are subject to transmitted in any form, or by any means
change without notice. No contractual (electronic, mechanical, or otherwise), for any
obligations are formed directly or purpose without prior written permission.
indirectly by this document. ICF MAKES
ICF and ICF INTERNATIONAL are registered
NO WARRANTIES, EXPRESS, trademarks of ICF and/or its affiliates. Other
IMPLIED, OR STATUTORY, AS TO names may be trademarks of their respective
THE INFORMATION IN THIS owners.t complex challenges. Since 1969, public
DOCUMENT d i t t li t h k d ith ICF t
7 @Copyright ICF 2021You can also read