Power-to-gas and Hydrogen Storage for Decentralized Energy Systems: Application at the Neighbourhood and District Scale - Portia Murray
←
→
Page content transcription
If your browser does not render page correctly, please read the page content below
Power-to-gas and Hydrogen Storage for Decentralized
Energy Systems: Application at the Neighbourhood and
District Scale
Portia Murraya,b
Dr. Kristina Orehounigb
Professor Dr. Jan Carmelieta

aETH   Zurich - Chair of Building Physics
bEmpa   - Urban Energy Systems Laboratory

                                              Portia Murray |   06.06.18   |   1
Agenda
1. Motivation: Why investigate Decentralized Power-to-Gas systems?

2. Optimization Methodology

3. Analysis for two case studies from 2015 to 2050

4. Conclusions and Future Work

                                                              Portia Murray |   06.06.18   |   2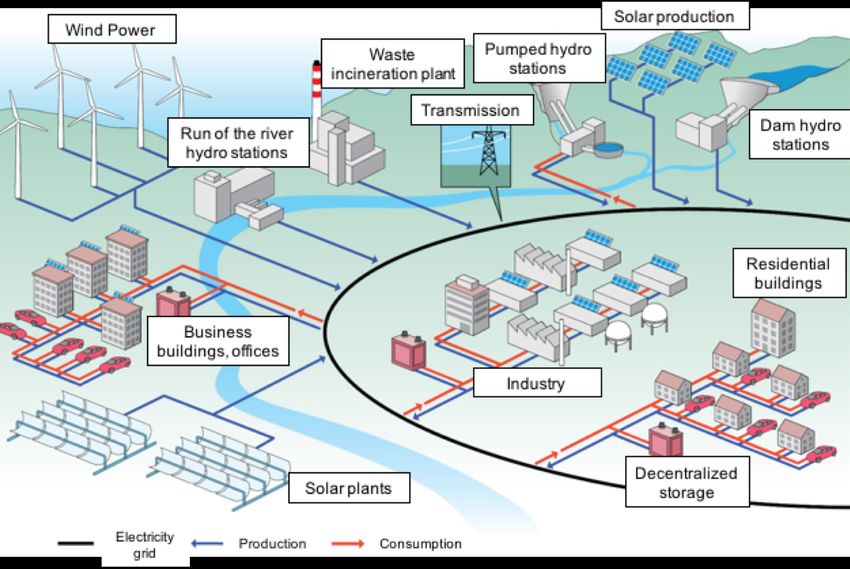
Motivation: Why investigate
Decentralized Power-to-Gas systems?

                                   Portia Murray |   06.06.18   |   3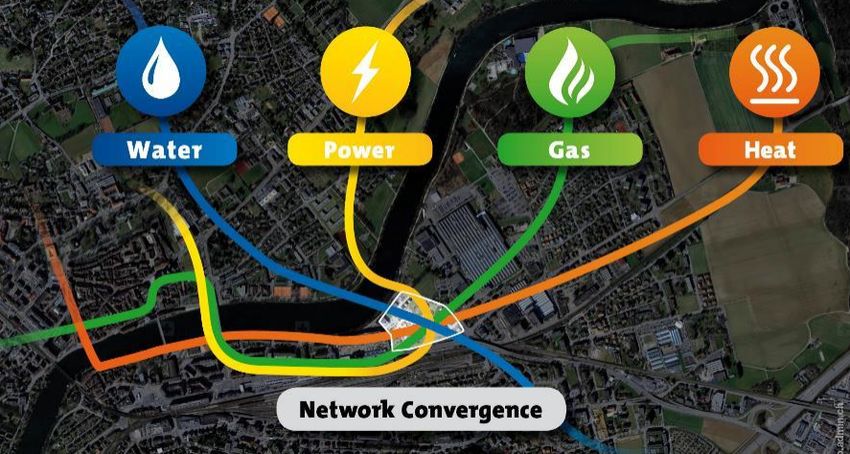
Current Energy Structure in Switzerland

               Source: IEA Switzerland – Energy System Overview

                                                                  Portia Murray |   06.06.18   |   4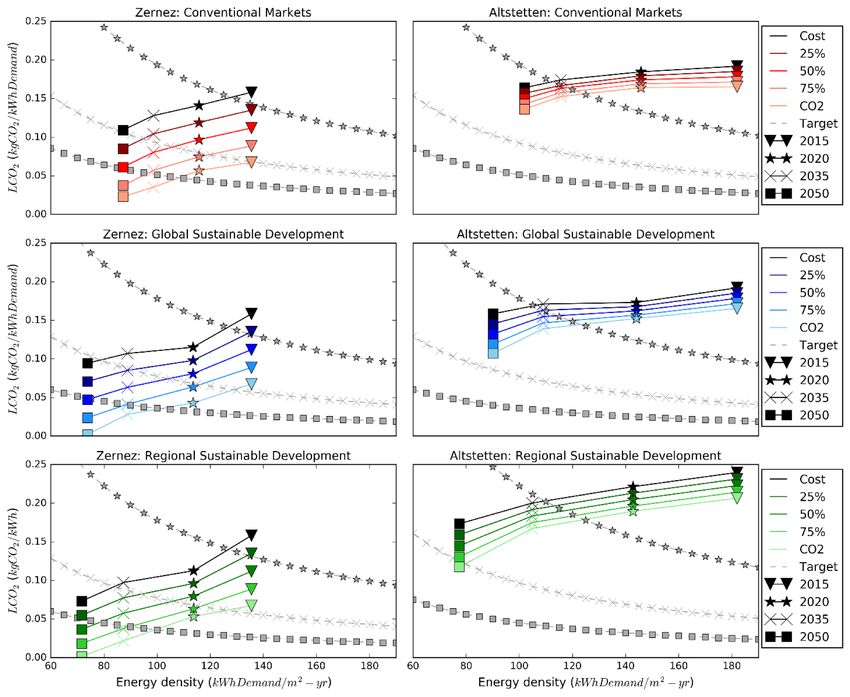
Nuclear replaced with renewable energy

             Source: Swiss Energy Strategy 2050

                                                  Portia Murray |   06.06.18   |   5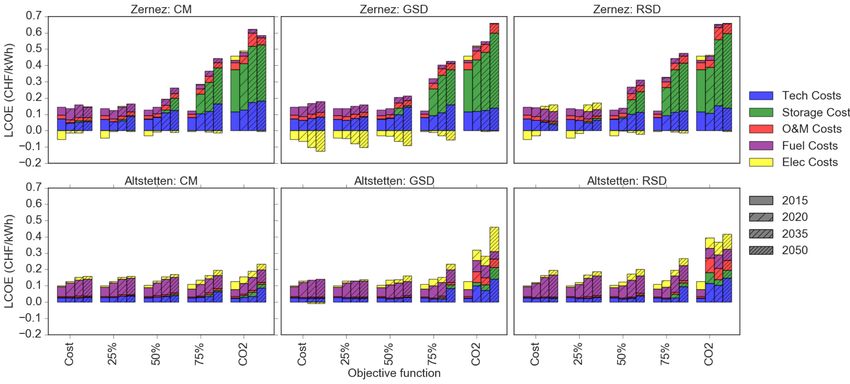
A similar trend with Germany

                               Portia Murray |   06.06.18   |   6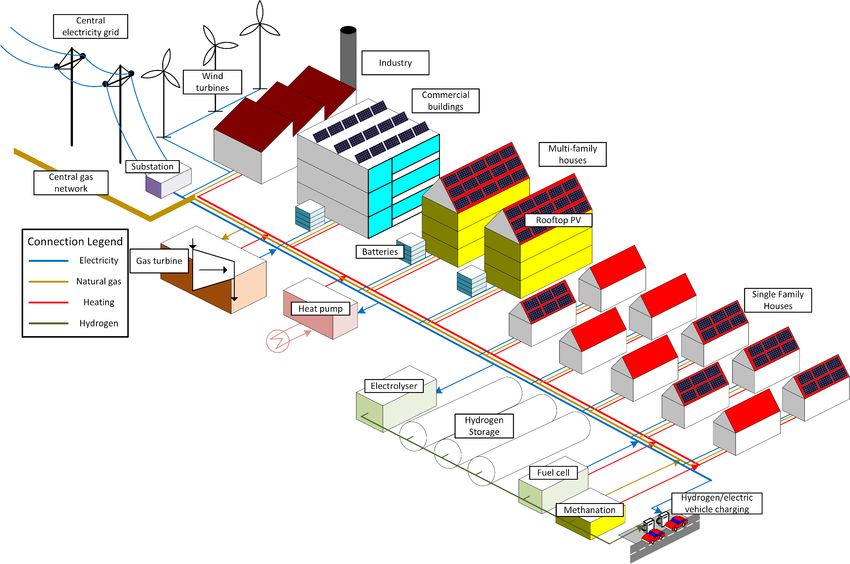
From centralized to decentralized energy
production

                                      Portia Murray |   06.06.18   |   7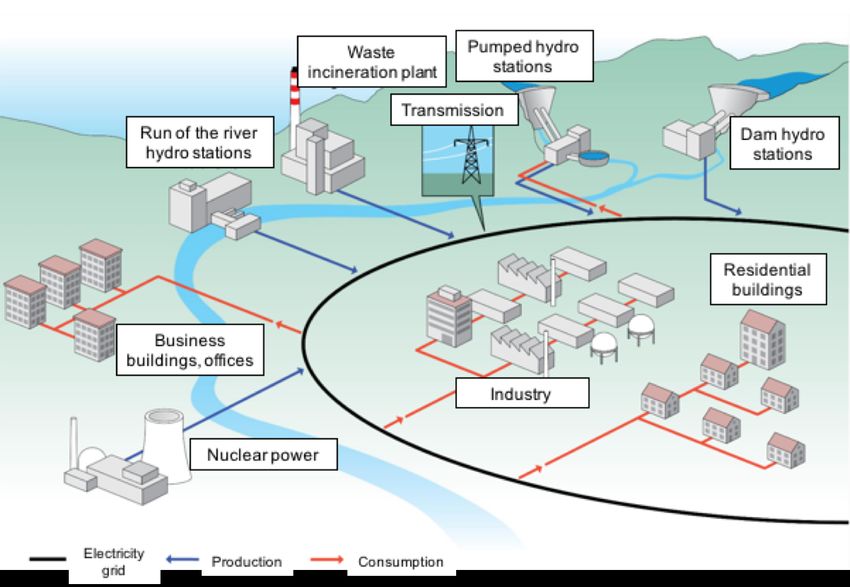
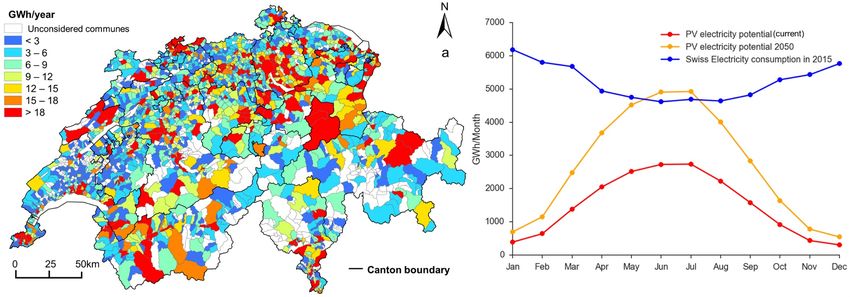
Distributed renewables can play a large role

      Left: Technical potential of rooftop PV electricity production (GWh/year) for each commune in
      Switzerland. Right: Comparison between current and forecasted monthly PV electricity production
      (GWh/month) for 1901 communes in Switzerland (current year marked in red; year 2050 marked
      in orange), and Swiss electricity consumption in 2015 in GWh/month (marked in blue).

             Source: Dan Assouline, Dr. Nahid Mohajeri, Prof. Jean-Louis
                                                                                      Portia Murray |   06.06.18   |   8
             Scartezzini, EPFL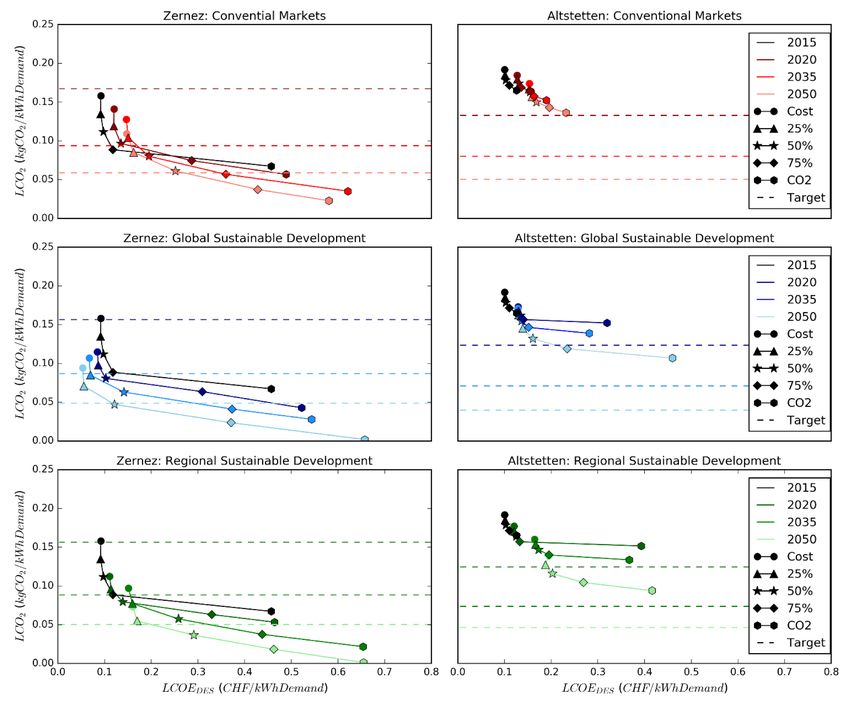
Decentralized Multi-Energy Systems (MES)

                                     Portia Murray |   06.06.18   |   9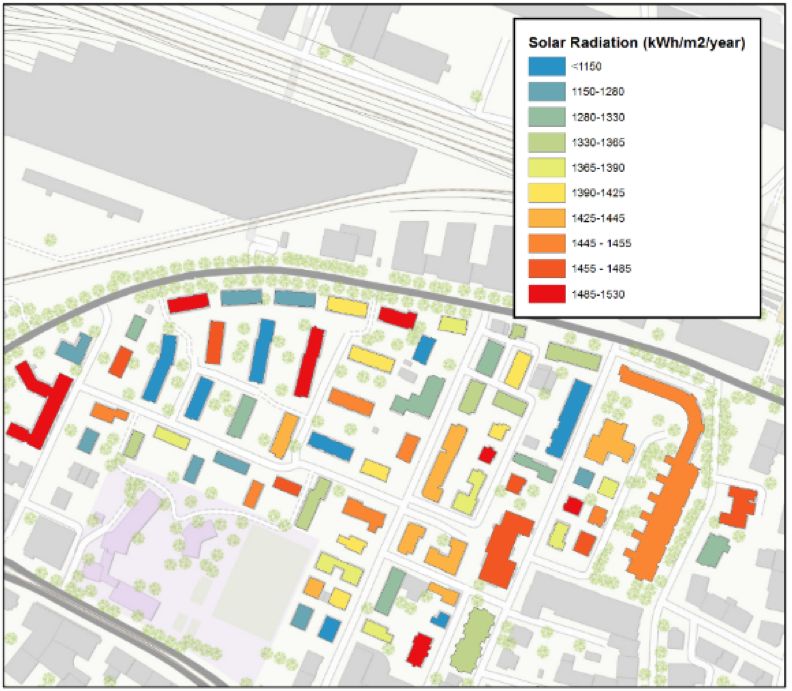
Short vs. Long Term Storage

                                                Losses over time
                                 120

                                 100
           Energy stored (kWh)

                                                                         Hydrogen
                                 80

                                 60
                                                                         Battery
                                 40

                                 20                                      TES

                                  0
                                       0   50             100      150
                                                  Hours
                                                                                    Portia Murray |   06.06.18   | 10
Power-to-Gas in MES
Portia Murray | 06.06.18 | 11Additional hydrogen pathways
Portia Murray | 06.06.18 | 12Comparison to other storage systems
• Hydrogen is one of the
few storage
technologies that has a
storage duration for
longer than one day
• Can also be installed in
very small or large
systems
• It is a form of chemical
energy storage,
therefore is not subject
to time dependent
losses
Source: Siemens AG 2012
Portia Murray | 06.06.18 | 13Duration of storage for Centralized and
Decentralized Systems
Decentralized Storage Centralized StoragePower-to-X
• Power-to-Gas: Water electrolysis to H2, CO2 methanation to form CH4
• Power-to-Heat: Storing of surplus electricity through electrical heating
devices (heat pumps, resistance heaters) and storing hot water
• Power-to-Liquid: From H2 and CO2 to produce liquid fuel (ethanol,
methanol, etc.) as fuels for mobility or as feedstocks for the chemical
industry
Power-to-X Process Efficiency
Power-to-hydrogen (Elec-H2) 0.7-0.8
Power-to-methane (Elec-H2-CH4) 0.48-0.6
Power-to-liquid (methanol) 0.42-0.52
Power-to-power (Elec-H2-Elec) via PEM fuel cell 0.34-0.44
Power-to-power (Elec-CH4-Elec) via combined cycle plant 0.3-0.38
Power-to-CHP (Elec-H2-Elec+Heat) via PEM fuel cell 0.48-0.62
Power-to-CHP (Elec-CH4-Elec+Heat) via combined cycle plant 0.43-0.54
Portia Murray | 06.06.18 | 15First Test Case: Zuchwil, Solothurn
Source: Regio Energie Solothurn
Portia Murray | 06.06.18 | 16First Test Case in Switzerland: Regio Energie
Solothurn
Source: Regio Energie Solothurn
Portia Murray | 06.06.18 | 17MES Design and Operation Optimization
Portia Murray | 06.06.18 | 18Multi-energy system optimization
The energy hub concept:
• Tool that optimizes the configuration,
design and operations of energy
systems
• Balances energy carriers (i.e.
electricity, heat, natural gas, or
hydrogen)
• Coupling matrix for conversion
efficiencies
• Constraints due to power flow,
maximum capacities, start-up
conditions, etc.
• Decision variables: both design,
operation, and scheduling
Source: Geidl et al. The Energy Hub – A Powerful Concept for Future Energy Systems. 2007
Portia Murray | 06.06.18 | 19Multi-energy system configuration
Energy Sources Energy Converters and Storage Energy Demand
Electrical Building
potential electricity
demand
PV PEMEC Battery
Storage
Hydro
Hydrogen PEMFC
storage
Elec.
Grid Thermal Building
Storage Heat grid heat
demand
Ground GSHP
Natural Gas-
gas boilers
Electricity Heat H2 Natural gas
Portia Murray | 06.06.18 | 20Demand Modelling
Geometry (2.5D) Climate Data (SIA 2028)
Building envelope Schedule files (SIA 2024)
(Construction database
based on age)*
Model from Wang et al. “CESAR: A bottom-up housing stock model for Switzerland to address
sustainable energy trans-formation strategies' submitted to Energy and Buildings”
Portia Murray | 06.06.18 | 21Retrofit Modeling Demand
models
Retrofit const. (SIA 380/1)
(Windows, façade, roof, floor, Efficiency of Lighting
whole building) & Appliances
Retrofit rate (Swiss Retrofit costs and
Energy Strategy 2050, embodied energy
WWB and NEP cases)
IDF’s updated
Portia Murray | 06.06.18 | 22Renewable Potential Assessment
-./! − 20 767
PV: !"#$$ %, ' = !)*+ ' +
800
456$ (%, ')
=#>
:;< (%, ') = :;< 1 − @=#> !"#$$ (%, ') − 25
Small-hydro: 4 = :BCDE
Small-wind:
Portia Murray | 06.06.18 | 23Multi-Objective Optimization Methodology
§ Mixed integer linear problem using a CPLEX solver
§ 8760 hour horizon
§ Multi-objective approach:
§ Annual costs and CO2 emissions minimized
§ Epsilon-constraint method
Pareto optimal cases:
Case 1: Minimize Cost Years of analysis:
Min Cost …Min
… 1) 2015 (baseline)
CO2
Case n: Minimize cost 2) 2020
$%2()*+ − $%2-./
!" : $%2" ≤ 3) 2035
0−1 4) 2050
…
Case 10: Minimize CO2
Portia Murray | 06.06.18 | 24Constraints
Constraint Description Equations
Performance Piecewise affine linear (fuel cells,
curves electrolysers), linear approximations
for part-load efficiency curves
Hydrogen system Mass balance on the hydrogen
storage including direct injection
Hydrogen Compression of hydrogen to storage
compression at 90 bar
Battery and Capacity, charging, and discharging
thermal storages efficiencies of battery and thermal
storages
Ramp up/down Constraints controlling the start-up,
constraints shut-down, ramp-up and ramp-down
of technologies
Energy balances Conservation of energy for all
energy carriers
Portia Murray | 06.06.18 | 25Future scenario investigation from 2015-2050
Portia Murray | 06.06.18 | 26Case Studies in different municipal
contexts
Zernez Altstetten
Type Rural (alps) Suburban/commercial
Renewable Solar, hydro, and wind Solar
Potentials
Demand data 308 buildings 78 buildings
(2015-2050)
Portia Murray | 06.06.18 | 27Decentralized P2H System Schematic
Portia Murray | 06.06.18 | 28Model Workflow
Future
economic,
performance,
and Environ-
mental
parameters
Renewable energy
potential modeling
IPCC SRES
Simulation
Scenarios Future Weather data
Optimisation
2015
2050 Building demand
Building geometry and retrofit energy
Simulation Year
and data calculation Multi-objective analysis
Portia Murray | 06.06.18 | 29Future scenario development is based on the two
axes of the well-established IPCC SRES scenarios
§ IPCC’s Special Report on Emissions Scenarios (SRES) from 2000 is the key
reference in scenario development/analysis with more than 5000 citations
§ The scenarios are based on four narrative storylines (A1, A2, B1, B2) that
had a lasting impact on the subsequent literature of scenario analysis
More Economic
Scenario 1:
Conventional Markets
More More
Globalization Global Regional
Scenario 2: Scenario 3:
Global Sustainable Regional Sustainable
Development Development
More Environmental
Sustainability
Portia Murray | 06.06.18 | 30
Source: Takle (2006) adapted from IPCC (2000)Future scenario development is based on the two
axes of the well-established IPCC SRES scenarios
§ IPCC’s Special Report on Emissions Scenarios (SRES) from 2000 is the key
reference in scenario development/analysis with more than 5000 citations
§ The scenarios are based on four narrative storylines (A1, A2, B1, B2) that
had a lasting impact on the subsequent literature of scenario analysis
More Economic
1
«Conventional
markets» «Baseline»
More More
Globalization Global
0
Regional
«Global Sustainable «Regional Sustainable
Development» Development»
2 3
More Environmental
Sustainability
Portia Murray | 06.06.18 | 31
Source: Takle (2006) adapted from IPCC (2000)Three scenario profiles were defined to describe the
potential developments to 2020, 2035 and 2050
0 1 2 3
2015 2020 – 2035 – 2050 2020 – 2035 – 2050 2020 – 2035 – 2050
Name «Baseline» «Conventional markets» «Global Sustainable «Regional Sustainable
Development» Development»
Logic 2015 levels Global markets that are Global markets that are well Local/decentralized systems
(as-is) well connected, RES connected, fossil phase-out, with high RES share, fossil
deployment remains on a high RES deployment in phase-out
low-level. centralized settings
(cf. «business as usual»)
Variables
- excerpt -
Energy prices as-is low medium high
(e.g. electricity,
gas, oil)
Feed-in tariff as-is low (fast phase-out) high medium (slow phase-out)
CO2 tax as-is low (as-is) high high
Demand reduction none low/none (as-is) medium-high (efficiency) medium-high (efficiency)
Technology cost as-is, RES high, fossil-fueled low, RES low, fossil-fueled medium RES low, fossil-fueled medium
medium others medium (as-is), others medium (as-is), others medium
Tech. performance as-is, RES as-is, fossil-fueled high, RES high, fossil-fueled as-is, RES high, fossil-fueled as-is,
medium others medium others medium others medium
Portia Murray | 06.06.18 | 32Major Parameters for the Optimization
Portia Murray | 06.06.18 | 33Temperature Change for Scenarios
Source: IPCC Third Assessment Report "Climate Change 2001”;
Weather files from Meteonorm Portia Murray | 06.06.18 | 34Future Demand: 2015 - 2050
Retrofit rates:
WWB: Business as usual
(~1% buildings)
NEP: New energy policy
(~2% buildings)
Weather files:
A1B: Business as usual emissions
(temperature increase 3°C)
B1: Temperature increase limited to
2°C
B2: Temperature increase 2.5°C
Conventional Markets: WWB – A1B
Global Sustainable Development:
NEP – B1
Regional Sustainable Development
NEP – B2
Portia Murray | 06.06.18 | 35Input Data
• Energy demand predicted to decrease over time, but renewable potential
will remain approximately the same
• Renewable surpluses will increase over time
Portia Murray | 06.06.18 | 36Swiss Energy Strategy Targets
!#
!= $
#$
! is the carbon emission target 300.00
for buildings kg CO2 20
2050
Energy consumption (kWh/m2)
250.00 10
# is the energy demand (kWh) Building retrofit
$ is the building ?loor area (m2) 200.00 Renewable
energy
system
150.00 integration
Carbon emissions targets and 100.00
floor area are fixed in the
energy strategy for the years of 50.00
2020, 2030, 2040, and 2050, 0.00
@ A 0 50 100 150 200 250
therefore and must be Carbon intensity (gCO2/kWh)
A B
reduced to meet the targets
Emissions Target Source: Mavromatidis, Georgios, Kristina Orehounig, Peter Richner, and Jan Carmeliet. 2016. “A Strategy for Reducing CO2
Emissions from Buildings with the Kaya Identity – A Swiss Energy System Analysis and a Case Study.” Energy Policy 88: 343–54.
Portia Murray | 06.06.18 | 37Comparison with 2050 Emissions Targets
2020 2015
2035
2015
2020
2035
2050
2050
2015
2015 2035 2020
2050
2020
2050 2035
2015 2015
2020
2020 2035
2035
2050 2050
Portia Murray | 06.06.18 | 38Pareto Fronts
Portia Murray | 06.06.18 | 39Storage Sizing
Portia Murray | 06.06.18 | 40Conversion Technology Sizing
Portia Murray | 06.06.18 | 41Cost objective
Portia Murray | 06.06.18 | 42Decentralized System Evolution
Portia Murray | 06.06.18 | 43Use of Storage Systems
Portia Murray | 06.06.18 | 44Conclusions and Future Work
Portia Murray | 06.06.18 | 45Conclusions
§ P2G can be a useful technology in the future, particularly in
in scenarios where:
1. There is a large renewable surplus compared to the local demand. For
districts with low amounts of renewable potential, short-term storage is
sufficient
2. The FIT in the future is very low or phased out (i.e. the Conventional
Markets or the Renewable Sustainable Development scenarios). In these
cases, it is no longer profitable to sell excess renewable electricity back
to the grid. In order to obtain the value of this generation, it must be
stored or lost.
3. Buildings are retrofitted to lower high heating demand
§ Estimated that the technology will likely become more
economically feasible by 2035
Portia Murray | 06.06.18 | 46Future Work: Methanation
Portia Murray | 06.06.18 | 47Future Work: Transport demands
Portia Murray | 06.06.18 | 48Publications
Journal Articles:
P. Murray, K. Orehounig, D. Grosspietsch, J. Carmeliet, “A Comparison of Storage Systems in
Neighbourhood Decentralized Energy System Applications from 2015 to 2050,” Applied Energy. In
press.
Conference Papers:
P. Murray, K. Orehounig, J. Carmeliet, “Optimal Design of Multi-Energy Systems at Different Degrees of
Decentralization.” submitted to ICAE 2018, Hong Kong, China.
P. Murray, K. Orehounig, A. Omu, J. Carmeliet, “Impact of Renewable Energy Potential on the Feasibility
of Power to Hydrogen in Different Municipal Contexts.” presented at ECOS 2018, Guimares, Portugal,
2018.
P. Murray, A. Omu, K. Orehounig, and J. Carmeliet, “Power-to-gas for Decentralized Energy Systems:
Development of an Energy Hub Model for Hydrogen Storage,” presented at the Building Simulation
2017, San Francisco, USA.
Portia Murray | 06.06.18 | 49Acknowledgements
§ I would like to thank my supervisors (Kristina Orehounig
and Professor Jan Carmeliet) as well as all of my IMES
project Partners partners for their contributions to this
work
§ This work was supported by the Swiss National Science
Foundation (SNF) under the Energy Turnaround National
Research Programme NRP70
Portia Murray | 06.06.18 | 50You can also read