When Will COVID-19 End? Data-Driven Prediction - persi
←
→
Page content transcription
If your browser does not render page correctly, please read the page content below
When Will COVID-19 End? Data-Driven Prediction
                                        Jianxi Luo
                   Data-Driven Innovation Lab (http://ddi.sutd.edu.sg)
         Singapore University of Technology and Design (http://www.sutd.edu.sg)

                                  Updated on April 30, 2020

On April 18, 2020, DDI lab (Data-Driven Innovation Lab) launched a webpage
(https://ddi.sutd.edu.sg/when-will-covid-19-end/) (screenshot in Figure 1) on model-based
and data-driven predictions of the trajectories and end dates of COVID-19 in different
countries and has been continually updating the predictions daily with the latest data. For
each country, a figure is provided to visualize the estimated pandemic life cycle together
with actual data to date, which further reveals the predicted inflection point and ending
phase. Only predictions with satisfactory model-data fits and statistical significance are
reported. The prediction was started purely for self-curiosity regarding when COVID 19
might end in Singapore where we live and then has been expanded to cover other countries
in response to requests of site visitors. This paper explains the motivation, theory, method,
data and cautions for the data-driven prediction and monitoring.

                       Figure 1. Screenshot of the website and predictions

                                               1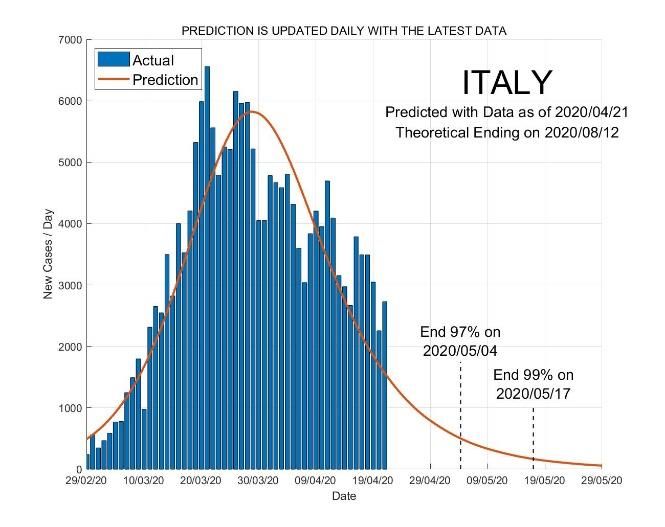
Motivation

All of us around the world today naturally want to know when the COVID-19 pandemic will
end. Estimating the end dates has been subconscious for most people as it is mentally
needed and essential part of planning during the COVID-19 pandemic, but also naturally
difficult to be done well due the uncertainty of future as a result of the complex, dynamic
and heterogenous nature of the world. Meanwhile, our existing knowledge of historical
pandemic process patterns and the continually accumulating data of the current pandemic
make it possible to take a model-based and data-driven approach to objective predictions of
the end dates of COVID-19 and also continually update the predictions as it evolves and
generates more data. Such “predictive monitoring”, i.e., the continual monitoring of
predicted likely future events, such as the ending of the ongoing pandemic, using the latest
data generated daily, might be able to reduce the anxiety from the blindness of future,
gauge over-pessimism or over-optimism, stimulate pre-cautionary or pro-active actions, and
make our planning, decisions, behaviours and mentality at the present moment more
“future-informed”. In contrast, most monitoring practices today focus on reporting actual
cases of infection, recovery and death every day, which guides reactive and passive policies
and actions, such as locking down a city only when many infections have been reported.

Theory and Methodology

The evolution of COVID-19 is not completely random. Like other pandemics, it follows a life
cycle pattern from the outbreak to the acceleration phase, inflection point, deacceleration
phase and eventual ending. Such a life cycle is the result of the adaptive and countering
behaviours of agents including individuals (avoiding physical contact) and governments
(locking down cities) as well as the natural limitations of the virus and our ecosystem.
However, the pandemic life cycles vary by countries, and different countries might be in
different phases of the life cycles at a same point in time. For instance, on April 21, in
Singapore, Prime Minister Hsien-Loong Lee announced the extension of circuit breaker to
June 1 in response to the spikes of COVID-19 cases, on the same day when Prime Minister
Giuseppe Conte announced Italy’s plan to reopen from May 4. Theoretically speaking, such
decisions and planning can be rationalized by well knowing where our own country
(together with other countries and the world as a whole) is in its own pandemic life cycle,
when the turning point is coming if it has yet come, and most importantly when the
pandemic will end. The basis for such actionable estimation is the pandemic’s life cycle.

The pandemic life cycle pattern is expected to appear as a S-shape curve when one plots the
accumulative count of infection cases over time or equivalently as a “bell-shape” curve of
the daily counts over time (see examples in Figure 2). Note that the bell here is not expected
to be symmetrical with no expectation of a normal distribution. Such patterns as well as the
underlying dynamics have been well studied in various domains including population

                                              2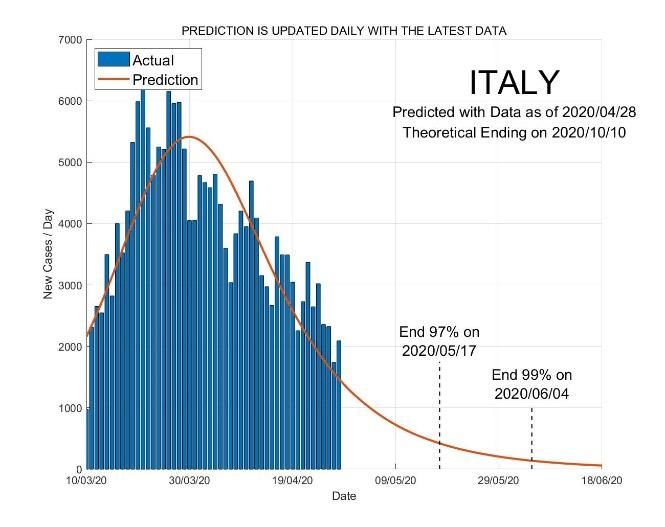
growth, diffusion of new technologies and infectious diseases, and have theoretically
established mathematical models, including the logistic model that describes a general life
cycle phenomenon (such as population growth) and the SIR (susceptible-infected-
recovered) model that describes the dynamic process of the spread of infectious diseases.
The context-specific and explainable SIR model is employed here. In this paper we will not
repeat giving the details of the SIR model, which can be easily found in many mathematics
textbooks and on internet. The model incorporates two main parameters, whose values
determine the shape of a specific life cycle curve. The model parameters for a country can
be regressed based on actual data from the country. In this case, only the regressions with
satisfactory goodness-of-fit as measured by R^2 greater than 0.8 and statistical significance
as measured by p-value lower than 0.001 are accepted and reported.

Figure 2. Model-Based Data-Driven Estimation of COVID-19 Life Cycle, Turning and Ending Dates for
                     Singapore and Italy as of April 21 versus April 28, 2020

To estimate the pandemic life cycle, daily updated COVID-19 data from Our World in Data 1
are used to regress the SIR model of COVID-19 using open-source codes from Milan Batista
2
  . Regression is run for individual countries and updated daily with the newest data. The

[1] Our World in Data. https://github.com/owid/covid-19-data/tree/master/public/data
[2] Milan Batista. https://www.mathworks.com/matlabcentral/fileexchange/74658-fitviruscovid19.

                                                    3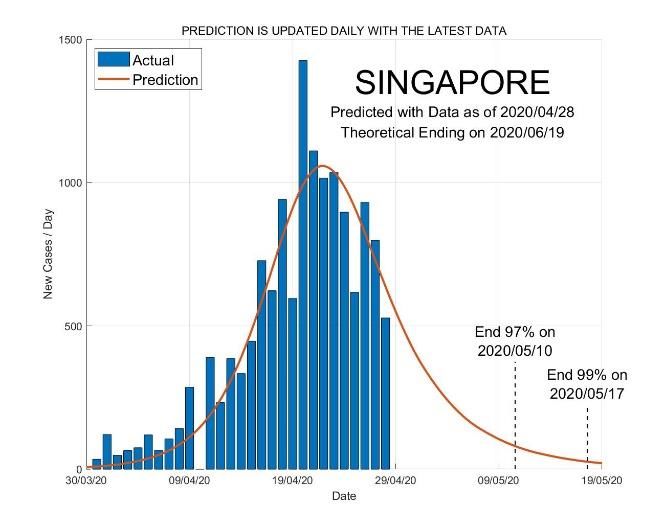
regressed model is used to estimate the full pandemic life cycle and plot the life cycle curve.
The initial segment of the curve is fitted with the data to date and the remaining segment of
the curve is predicted. With the estimated full life cycle curve (see examples in Figure 2),
one can easily observe which phase of the pandemic life cycle a specific country is in (with
actual data plotted together), when the inflection point (the peak in the bell-shape curve) is
coming (for the interests of the countries still in the accelerating phase), and when the
pandemic will end (for the interests of all countries).

The inflection point is specific and appears as the peak in the bell-shape curve. However,
estimating the “ending date” is not straight-forward and may be done differently for
different considerations. Most theoretically, one can define the end date as the day with the
last infection case of the pandemic, and thus operationalize the estimation of the end date
as the day with the last predicted infection at the right most end of the estimated pandemic
life cycle curve. However, practically, estimation of the theoretical ending might not be
useful to provide guidance for the planning of activities of governments, companies and
individuals. One might consider an early date when predominately most predicted
infections (indicated by the regressed pandemic life cycle curve) have been actualized and
only a small portion of the total predicted epidemic population is left. The total predicted
infection population size is the area under the curve. Our current predictions provide the
following three alternative estimates of end dates in the order of conservativeness.
     - The date to reach the last expected case;
     - The date to reach 99% of the total expected cases;
     - The date to reach 97% of the total expected cases.
In any case, specifying an end date is arbitrary in nature. With uncertainty and flexibility in
mind, one may simply just exploit the estimated life cycle curve, especially its right most tail
segment, to screen and sense when the pandemic gradually vanishes to which extent.

It is noteworthy that the bell-shape curve is chosen to visualize the life cycle because it
allows easy detection of the inflection point as the peak of the curve to distinguish countries
in acceleration and deacceleration phases. For instance, Figure 2 visually reveals on April 21
Singapore was still in its acceleration phase, whereas Italy has passed its inflection point.
And the estimated turning date for Singapore would be May 1. However, as of April 28,
Singapore has already past its inflection point, earlier than the turning date predicted on 21
April. In contrast, from April 21 to 28, the curve of Italy is slightly lifted, and the updated
predictions for Italy suggest consistently later 97%, 99% and 100% ending dates

Such changes shown in the monitored predictions may reveal the effects of the recently
strengthened measures of the Singapore government and more cautions of the local citizen
from PM Lee’s announcement of circuit breaker extension on 21 April, and may result from
the slightly relaxed government control measures and human behaviours in Italy in the past
week. These examples here show the importance of predictive monitoring or continually

                                               4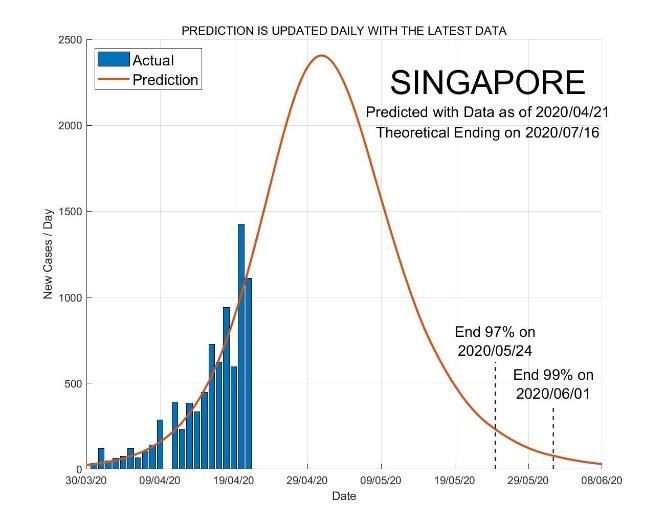
monitoring predictions to reflect and evaluate the dynamic real-world scenarios in real time.
It also allows estimation of the uncertainty or stability of the predictions themselves as a
result of the underlying real-world scenarios. Predictive monitoring differs from making a
one-shot prediction and then waiting to later see if it is correct (and thus better addresses
uncertainty) and differs from the monitoring of actual cases every day.

Caution

Predictive monitoring for each country should be read together with what are happening in
the real world and government policy changes. For instance, Singapore government’s
strengthened restrictions in April may have bended its curve earlier than the previously
predicted ones, and the early relaxation of social distancing and lockdown in Italy and
Germany might increase infection rates and thus delay the pandemic ending as predicted
now. Also, the predictive monitoring of a country should not be read in isolation, but
together with the predictions and real time situations of other countries. No country is in
isolation in the world today. The monitoring and control of one country must be coupled
with the monitoring and control of other countries.

For example, while the predictive monitoring shows the pandemic has “theoretically” ended
in China, South Korea and Australia (despite a small number of domestic cases reported
daily), it also shows the world will still suffer till the end of 2020 if we remain in our present
trajectories of government policies and individual behaviours and without medical cures and
vaccines for COVID-19. Therefore, the government of China, South Korea and Australia may
not want to open their international ports so soon and lift the domestic restrictions so
quickly, until the pandemic nears its end in the world as whole. Although it is the time for all
of us to isolate and distance physically from each other, it is also the time that needs more
sharing of data, information and knowledge and more close coordination. This is part of the
motivation for the DDI COVID-19 prediction site.

Because of the complex, dynamic and heterogenous realities in different countries, the
curve, inflection and end dates must be continuously re-estimated with the newest data
from official channels every day. That is, the predictions themselves are also needed to be
monitored over time, in addition to monitoring the actual cases. Especially, for countries
that are still early in their own pandemic life cycles, the prediction of the rest of the curve,
inflection point and ending dates will be more teasing and potentially valuable if done
properly, but also less relevant to the “real future” to come given that the actual data only
cover a smaller and early portion of the total life cycle. By contrast, for countries that have
passed their inflection points and been approaching ending phases, prediction is expected
to be more accurate because it is based on data covering more different phases of the life
cycle, but also less useful. In such cases, the estimations are more about explaining the
history and less about predicting the future. For those countries, a new epidemic wave

                                                5
might come if the governments and individuals lift controls and disciplines too early,
especially when the pandemic is still prevalent in other countries.
Summary (tentative, to be updated)
The model-based and data-driven estimation of pandemic life cycle, inflection and end
dates, if properly done, may reduce anxiety and over-optimism and prepare the mentality of
all of us for the next phases of the epidemic evolution, no matter it is going to improve or
worsen. Data-driven Predictive monitoring will allow the decisions and planning of the
governments and companies that must be made now for the future to be more “future-
informed”. Our site complements with the widely available online dashboards and monitors
of daily confirmed, death and recovery cases, and makes a difference from discreate
predictions. We continually fine tune the prediction, monitoring and visualization
methodology with the latest data and provide daily updates on our research lab website
(https://ddi.sutd.edu.sg/when-will-covid-19-end/). This document will be updated
continually with more learning and reflection down the road.
In the meantime, readers must take any prediction, regardless of the model and data, with
caution. Over-optimism based on some predicted end dates is dangerous because it may
loosen our disciplines and controls and cause the turnaround of the virus and infection.
Although prediction based on science and data is aimed to be objective, it is uncertain by
nature. One thing that is certain is that the model, data and prediction are inaccurate and
insufficient to fully represent the complex, evolving, and heterogeneous realities of our
world. The model is only theoretically suitable for one stage or wave of the epidemic
evolution, and relatively more meaningful when applied to data for each single stage if the
country has experienced multiple stages (such as Singapore). The prediction is also
conditioned by the quality of the data. The data publicly available today is based on tests,
which are done differently in different countries and over time periods.
Future is always uncertain. We must keep this in mind when doing and reading any
prediction. No one predicted the COVID-19 outbreak beforehand. With acknowledging the
uncertain nature of the ongoing COVID-19 pandemic and our growing inter-connected and
complex world, what are eventually and fundamentally needed are the flexibility,
robustness and resilience of people, organizations and governments, as well as sharing and
coordination, to deal with unpredictable and unwanted future events.
6You can also read