ANALYZING USER BEHAVIOR AT PLENTYOFFISH: DATA SCIENCE IN THE WILD - THOMAS LEVI (@TSLEVI ON TWITTER) DATA SCIENTIST AT PLENTYOFFISH
←
→
Page content transcription
If your browser does not render page correctly, please read the page content below
Analyzing User Behavior at PlentyOfFish:
        Data Science in the Wild

      Thomas Levi (@tslevi on Twitter)
       Data Scientist at PlentyOfFish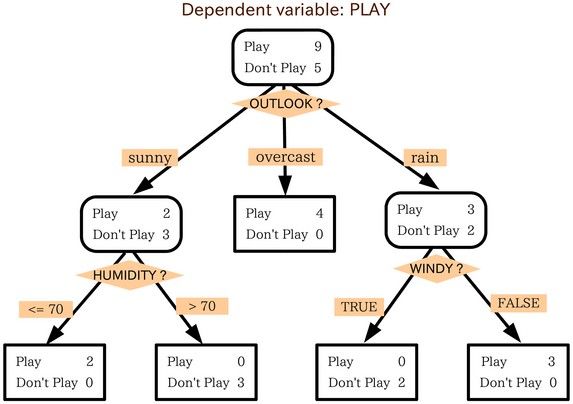
My background
 ●   Started life as a string theorist and cosmologist
           ●   PhD from UPenn (2006)
           ●   Postdoc at NYU (2006-2009)
           ●   Postdoc at UBC (2009-2012)
           ●   19 papers and ~600 citations in topics spanning
                black hole physics, particle physics and Big
                Bang cosmology

 ●   Currently a Data Scientist at PlentyofFish

06/27/13                Thomas Levi © 2013 Plentyoffish Media Inc.
My current company: PlentyofFish
● World's largest online dating site: 3.3 million
users log in per day, 55 million registered users
● In 10 years grown from a one man operation to
~75 employees
● Web and native apps for iPhone, iPad and
Android
● 5 man research team with PhDs (and one BS)
in physics, CS, and machine learning
● Work with CUDA clusters, R clusters, ...
06/27/13 Thomas Levi © 2013 Plentyoffish Media Inc.Outline of talk
● The data
● What does the raw data look like?
● Can we process the data for fast reads for this problem?
● Data wrangling
● Even processed we can't really learn or analyze
● How can we summarize the data?
06/27/13 Thomas Levi © 2013 Plentyoffish Media Inc.Outline (part 2)
● Data Wrangling (optimizing or welcome to the cluster!)
● Can we do this in parallel?
● Building out a distributed cluster for analytics in R
● doRedis
● Custom package development
● Feature and data exploration
● Exploratory CART trees for feature selection
● Regression techniques
● CART trees for user insights
● Conclusions and questions
06/27/13 Thomas Levi © 2013 Plentyoffish Media Inc.The problem (the data)
● PoF is currently building out its own real time
analytics platform
● Part of that is recording user pagehits on the
site which allows for much deeper analysis than
Google analytics
● The raw data is simply stored as a postgresql
table like so
eventid userid eventtime pagehit
1050 56 1370555569 inbox.aspx
1051 23 1370555571 homepage.aspx
06/27/13 Thomas Levi © 2013 Plentyoffish Media Inc.The problem (the data)
● Now imagine we want to get entire tracks, grouped by user:
– select userid, eventtime, pagehit from raw.data where userid in (56,...)
order by userid asc, eventtime asc;
eventid userid eventtime pagehit
1050 56 1370555569 inbox.aspx
1051 23 1370555571 homepage.aspx
...
2032 56 1370555623 matches.aspx
● This filter is O(N), the sort is O(m log m) (where m elements are
left after the filter)
● This is slow for millions of rows, and we have billions. Is there a
faster way?
06/27/13 Thomas Levi © 2013 Plentyoffish Media Inc.The solution (data)
● What if we can eliminate the filter... and the
sort?
● Let's look at how the data is structured:
● Right now it's by eventid/time
● What we want is something indexed and
ordered by userid, ideally with as few
rows/user as possible
● What can we do with Postgresql to accomplish
this?
06/27/13 Thomas Levi © 2013 Plentyoffish Media Inc.The processed table
(with a lot of help from Nisan Haramati)
● Enter: Native arrays in Postgresql
● We can store the events in a time series array, new
events are simply appended as they arrive
● This leaves a table with one array per dimension, per
user, and a single row per user
select userid, dataarray from array.table where
userid in (56,...)
● This is O(1) to choose a row, add elements and read
the array (no complex filter, no sort because data is
stored contiguously and in order on the file system)
06/27/13 Thomas Levi © 2013 Plentyoffish Media Inc.Bonuses
● We can slice arrays
● We can get metadata such as length, histogram
of array elements...
● Significantly more efficient in memory and
storage
● Native set operations
06/27/13 Thomas Levi © 2013 Plentyoffish Media Inc.Data Wrangling
● Ok, so we can get data out at a reasonable clip now (later
on we'll do even better)
● The data still isn't really in the form we can really play with
and start learning on, so what can we do?
● A few options:
● We can try and keep the entire path and do some form
of graph analysis: the downside to this is that there's a
lot of pages and the paths quickly get exponentially
complicated. Not a good call for an initial foray
● We could try and summarize the data in a nice way and
work off the summary/aggregates: This is a good first
step
06/27/13 Thomas Levi © 2013 Plentyoffish Media Inc.Data Wrangling
● The obvious (to me) is to summarize by counts/page or
counts/pagetype
● We also may want to only look at the first session, first x
hours, or break up by idle time periods → write a routine to
handle all these and spit out required data only
● Take into account the distribution of a user session spent
on each part of the site (e.g. 13% on their inbox) and total
time spent on the site in the period
● Finally, there's lots of other metadata such as messaging,
demographic information etc. contained in a separate
MSSQL database. We need to pull this in too.
06/27/13 Thomas Levi © 2013 Plentyoffish Media Inc.More data wrangling
● I used R for this (including direct database extraction)
● Packages used:
● RpostgreSQL, RODBC, reshape2, plyr, foreach, sampling...
● My code for a set of users:
● Opens up connections to SQL and PostgreSQL
● Pulls metadata and usertracks per user from SQL and the polarized table
● Finds the first session or x hours
● Processes and aggregates the data
● Returns a summarized data frame like
userid inbox matches perc_inbox ... Messages Total
sent Time
25 13 5 0.23 6 456
06/27/13 Thomas Levi © 2013 Plentyoffish Media Inc.Parallel Computing (enter the cluster)
● So far, all the computations and even queries we've done are by user, there
are no interactions
● This can be done in an embarrassingly parallel fashion → We can use a
cluster
● There are lots of options in R for parallel computation ( see the CRAN
taskview on high performance computing)
● We wanted something that satisfied:
● Easy and generic to write code for many tasks → fast development time
and quick iteration
● Mature and supported
● Fault tolerant
● Scales
● Nodes can be heterogeneous
06/27/13 Thomas Levi © 2013 Plentyoffish Media Inc.R Cluster
● The packages foreach and iterators allow for a generic and
“simple” programming model → Not much different than
writing a loop, except you specify how to iterate (map),
process and combine (reduce)
● You can do most anything in the loops you want, even
things like database calls
● foreach requires a parallel backend to be registered,
otherwise it will operate sequentially. There are a lot of
options here from utilizing multiple cores on your local
machine, SOCK clusters, etc.
● The foreach code works with any backend → no rewriting
06/27/13 Thomas Levi © 2013 Plentyoffish Media Inc.R Cluster (the parallel backend)
● rredis and doRedis provide a very good option
for a parallel backend
● doRedis uses a Redis server as a job queue, it
is
● Fault tolerant
● Allows for heterogeneous nodes
● Allows for spawning nodes during a
computation
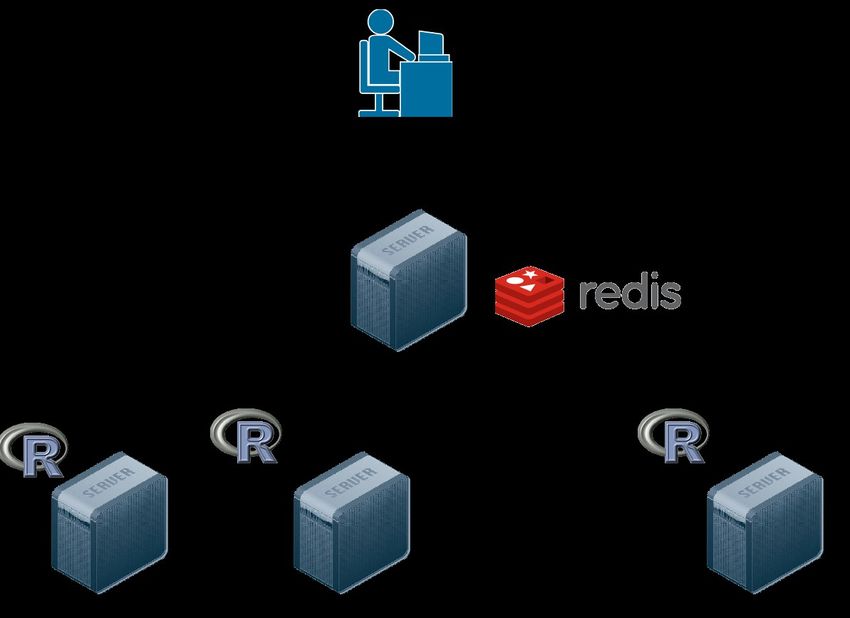
06/27/13 Thomas Levi © 2013 Plentyoffish Media Inc.Cluster Architecture
(with a lot of help from Nisan Haramati)
06/27/13 Thomas Levi © 2013 Plentyoffish Media Inc.Cluster design
● doRedis is an excellent package, but we needed some additional
functionality on the nodes:
● DB connectivity functions
● The ability to spawn nodes, connect to queues and flush memory
from bash scripts or from the client side
● Administrative functionality
● Integration across multiple servers
● Code deployment via SVN
● This led to me developing two custom packages (and several scripts
and settings files):
● databaseConnections (extends RODBC and RpostgresSQL)
● redisCluster (extends rredis and doRedis)
06/27/13 Thomas Levi © 2013 Plentyoffish Media Inc.Challenges for redisCluster
● Very early on in development, basic functionality
● Features that would be great to add:
● Ability to spawn nodes remotely from within a client R session
● Better control and ability to flush memory on queues
● Redis has a hard limit of 512 MB for strings → doRedis can
choke with larger sets at times. Would be great to have a
way to chunk up the message string to start the jobs and
return the data
● A robust job manager
● a la Hadoop → Ability to store data on nodes so it doesn't
have to be passed
06/27/13 Thomas Levi © 2013 Plentyoffish Media Inc.Upshot for data wrangling
● We've gone from a large single query on the
raw table to many cluster based queries on a
polarized, structured table and optimized
aggregating/wrangling
● All of these changes reduced the timing
exponentially. A rough number is on about 50K
users' tracks (~50 million events) we reduced
the timing from several hours to roughly 90
seconds!
06/27/13 Thomas Levi © 2013 Plentyoffish Media Inc.Other (awesome) things you can do
with this
● Rapidly iterate through many machine learning algorithms and parameter
spaces (e.g. caret automatically uses foreach) with minimal dev time
(literally changing a line or two of code and iterate on large sets quickly), e.g.
● Neural nets
● Random forests
● A variety of boosted models
● Bayesian models
● C5.0
● ...
● Able to process on terabytes of data
● Can rapidly explore and orthogonalize large parameter spaces
● ….
06/27/13 Thomas Levi © 2013 Plentyoffish Media Inc.(Almost) done wrangling
● We're just about there, except we need to look at outliers
● There are small pockets of users who have either way
more/less total and individual page hits over a given time period
● Plot a histogram or distribution of these things, look for long
tails on either end
● This in fact gives an easy to implement routine in R for
excluding them
1)take attributes you want to eliminate outliers on
2)Build a histogram
3)Take any users that are in the very long tails and put them in the
outlier set → left with a more normalized population
● This is a bit of an open question, include or not? I chose to do
both and performed analysis on the whole set, the normalized
population and sometimes just the outliers
06/27/13 Thomas Levi © 2013 Plentyoffish Media Inc.(Almost, almost) done wrangling
●Lastly, there are some holes in the data itself when the system
was down or not recording properly. We can filter these out in two
ways:
● Look at first eventtime and compare to known creation time
(in other DB)
● Look at density of events overall, and filter around holes
06/27/13 Thomas Levi © 2013 Plentyoffish Media Inc.Data Exploration
● Whew! Finally have data we can iterate quickly
on and into a reasonable form
● Lots of things we can do with it:
● Examine various averages and distributions
● Build classifiers
● We could go the highly accurate route (e.g.
SVMs, neural nets, random forests etc.)
● At this stage though, we're more interested in
what are the important events and features our
users experience → regression, trees etc., i.e.
models that are easily interpretable
06/27/13 Thomas Levi © 2013 Plentyoffish Media Inc.CART Trees
● In our case we want to predict whether
or not a user will have deleted their
profile at some time in the future based
on their initial actions
● Use the trees to explore which features
are most important for a given subset
of users (e.g. m/f)
● I mostly used rpart
● What splits give the highest information
gain
● What subset of attributes are most
predictive?
● Test, prune, feature select, test, prune,
feature select,...
06/27/13 Thomas Levi © 2013 Plentyoffish Media Inc.Regressions
● We can use the information from the trees to
start filtering out variables, which are most
important?
● For example, some analysis showed that the
more time users spend online in their first day,
the more likely they are to become engaged
and happy (not exactly earth shattering)
● We can then examine which other attributes are
good predictors of that using a linear regression
or stepwise routine like LARS
06/27/13 Thomas Levi © 2013 Plentyoffish Media Inc.LARS (Least Angle Regression)
● Lars is form of linear regression
● We are trying to predict a result y with
the formula
1
̂y =β0+β1 x +...
● We do this stepwise, at each step we
choose the predictor most correlated
with y
●
Increase the new β in the direction of
its correlation with y.
●
Move in equiangular direction until
● This gives a series of steps that rank
another variable is as correlated
attributes in order of importance so we
●
Continue till all predictors are in the can see what the best predictors are
model
06/27/13 Thomas Levi © 2013 Plentyoffish Media Inc.Results
● This... I can't actually tell you, you'll just have to
come work with me if you want to hear about it
06/27/13 Thomas Levi © 2013 Plentyoffish Media Inc.Wrapup
● I (hope) I've shown you what it's like to be a Data Scientist at POF for a
couple of weeks
● As you can see, this project involves many steps, calls that have to be made
and diverse skillset and tools → That's pretty much being a Data Scientist
● This is one project, some others I've been involved in:
● Scam detection
● Bot detection
● Matching algorithm
● Lexical processing
● …
● If you want to chat more: Add me on LinkedIn or Twitter: @tslevi
● Thanks for listening! (now let's go get a beer)
06/27/13 Thomas Levi © 2013 Plentyoffish Media Inc.You can also read