Algorithm of automated annotation of areas of roads with increased accidents
←
→
Page content transcription
If your browser does not render page correctly, please read the page content below
MATEC Web of Conferences 334, 01007 (2021) https://doi.org/10.1051/matecconf/202133401007
ITMTS 2020

 Algorithm of automated annotation of areas of
 roads with increased accidents
 Michail Eliseev1, Alexandr Blinov1, and Alexandr Lipenkov1*
 1Nizhny Novgorod State Technical University named after R.E. Alekseev, 603155 Nizhny Novgorod,
 Russia

 Abstract. The paper describes the methodology of annotating of road
 accidents centres of interactive accidents map. Based on the statistical
 analysis of the traffic accidents database the range of accident risk zones of
 a roadmap of the city are allocated as well as cause of accidents. These
 information in the form of text messages is applied to a vector map of a
 geographical area, in this paper – the map of Nizhny Novgorod. The
 annotation algorithm also takes into account the data of the road
 infrastructure, the weather, the driver (the user of the interactive crash map).
 The method was tested during the creation of e-cards of Nizhny Novgorod.

 1 Introduction
 Before the driver leaves the line, the motor company must inform him about the weather and
 traffic conditions in accordance with the law No. 196-FZ of December 10, 1995. Such
 information is believed to increase the safety of traffic for professional drivers. Why not
 apply similar information to drivers of personal transport?
 The paper considers an algorithm for the formation of text or sound messages that warn
 of the danger when driving a specific section of the road or approaching it. The initial data is
 information on road accidents (RA), weather data, and road infrastructure data. This
 algorithm is the core of the auto-annotation subsystem of the program complex Interactive
 Map of Accident (IMoA). For analysis, the apparatus of mathematical statistics is used, it is
 the standard approach for studying the patterns of accident rate ([1-4]). This software package
 designed for comprehensive analysis of RA and organization of feedback with all participants
 of the road process. The IMoA considered in detail in the previous works of the authors (for
 example [5]). Other researchers also are developing systems aimed at improving road safety
 ([6-11]).

 2 Material and methods
 The purpose of the autocannon subsystem is to provide drivers with information about
 potentially dangerous areas of the road in the form of messages.
 Preliminary processing of available information takes place:

 * Corresponding author: _alexl_@mail.ru

© The Authors, published by EDP Sciences. This is an open access article distributed under the terms of the Creative Commons
Attribution License 4.0 (http://creativecommons.org/licenses/by/4.0/).
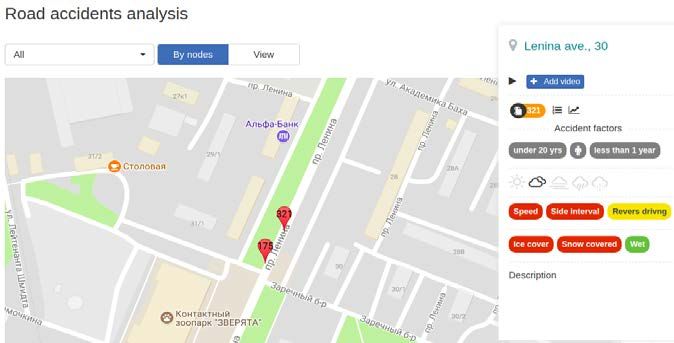
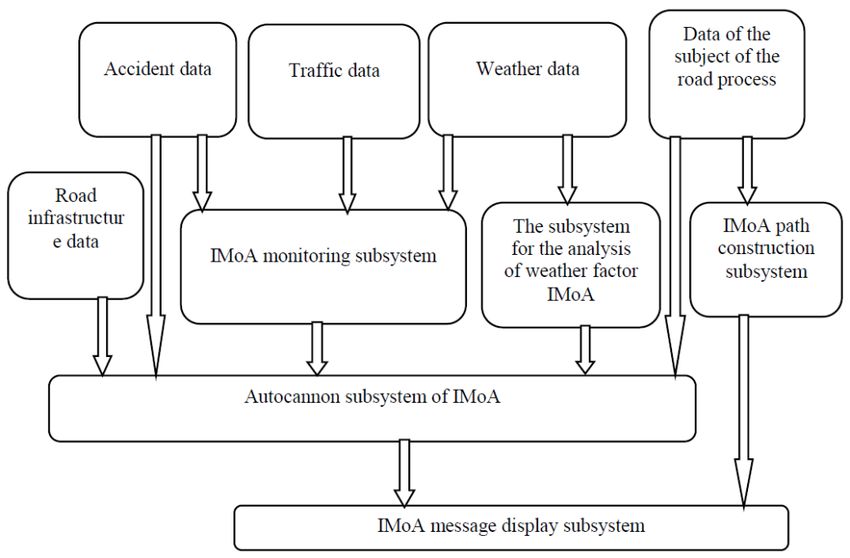
MATEC Web of Conferences 334, 01007 (2021) https://doi.org/10.1051/matecconf/202133401007
ITMTS 2020

 • data on accidents and traffic flows comes to the IMoA monitoring subsystem that
 determines the factors on which greatly exceed the average rates of accident. At the output -
 a set of factors A 1 , A 2 ,...A n and the corresponding coefficients K 1 , K 2 ,...K n , reflecting the
 degree of danger and expert comments, if any. The work of this subsystem will be described
 in detail in the following publications of the authors.
 • the weather data goes both to the monitoring system as well as to the subsystem for
 analyzing the weather factors of the IMoA, which verifies, according to the available criteria
 table, whether this combination of weather factors is an emergency. In the case of a positive
 response, this subsystem will indicate the types of danger as output data: ice cover, snow roll,
 fog, etc.
 Thus, the subsystem of IMoA annotation receives information on the road infrastructure
 (road works, not working traffic lights, changes in driving modes, etc.), information from the
 annotation subsystem in the form of factors A 1 , A 2 , ... A and the corresponding coefficients
 K 1 , K 2 , ... K n , as well as expert comments, weather data and driver data (driving experience,
 gender and age). The algorithm, described in detail below, compares the annotation (text or
 sound message) to each node of an accident.
 Initially, the driver enters the starting and ending point of the route and the route is
 constructed by path construction subsystem (several options can be proposed, from which
 the driver chooses the suitable one). Before constructing a route, the user can specify his data
 about the gender, driving experience and age, then the IMoA system will accept this data for
 processing and will take it into account in constructing the path and further annotating. Also,
 it is possible to log in to the IMoA system and add this information to the profile, then the
 system will save it and will use it for subsequent requests to build the path. After the
 construction of the path, it is determined which nodes of the RA lie on the route and displays
 the annotations for them.
 The logic of the IMoA subsystem auto-nomination operation is presented in the following
 scheme (Figure 1).

 Fig. 1. The logic of the autoconfiguration subsystem of the IMoA.
 Annotation can be displayed in several ways:
 • on building a path and clicking on the node icon on the site (Figure 2);

 2
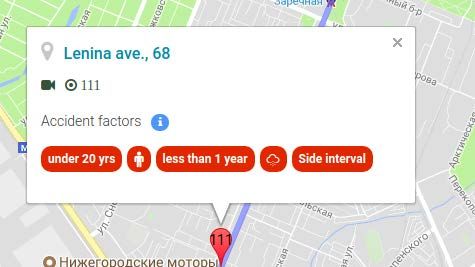
MATEC Web of Conferences 334, 01007 (2021) https://doi.org/10.1051/matecconf/202133401007
ITMTS 2020

 • on viewing detailed information on the node of RA (Figure 3);
 • on the information display installed on the relevant road infrastructure site;
 • using the navigator or navigation software downloaded to a smartphone (is in
 development).
 The first two ways of displaying are shown in the pictures below.

 Fig. 2. Displaying annotation when building a path.

 Fig. 3. Display annotation when viewing detailed information on nodes.
 An annotated message is calculated from the following initial data:
 • node RA;
 • output parameters obtained after processing the source data (see the diagram in Figure
 1).
 The formation of an annotated message for a specific node is carried out as follows (Table
 1).
 1. If there is an expert comment, then it automatically has the highest priority:
 • on audio annotation plays only it, or this message is played first of all;
 • during video annotation, the expert's comment is displayed in a conspicuous place.
 2. Executing analysis of weather data.
 The links between the number and nature of accidents and weather data are considered in
 a number of studies [12-15]. The author's technique is described in the work [16], short

 3
MATEC Web of Conferences 334, 01007 (2021) https://doi.org/10.1051/matecconf/202133401007
ITMTS 2020

 explanation: according to the table of criteria, it is checked whether the existing combination
 of weather factors meets at least one of the criteria, if yes, then this criterion will be included
 in the processing, if not, the weather data are not taken into account when forming the
 annotation.
 3. The road infrastructure data tables are checked: road works, not working traffic lights,
 etc., if they contain the node data, then the relevant information is added to the message.
 4. The data of the monitoring subsystem are checked, if f a sharp growth of accidents of
 certain categories is noticed in this node, then at the annotation this data has the following
 priority level.
 5. If the last week and the month of a sharp increase in the number of accidents is not
 observed, then on annotation uses data for the last 3 years: the accident rate factors and
 categories of drivers are determined, for which the average accident rate has been
 significantly exceeded and a message is being built according on them.
 Table 1. Table of possible values of accident factors.
 № Data Value
 1 Expert’s comment text
 2 Weather criteria 1 0 or 1
 3 Weather criteria 2 0 or 1
 4 Weather criteria 3 0 or 1
 5 Weather criteria 4 0 or 1
 6 Weather criteria 5 0 or 1
 7 Road infrastructure 0-4 (the digit corresponds to the factor: 0 - factors are absent, 1 -
 road works, 2 - not working traffic light and etc.)
 8 Monitoring data 0-9 (the digit corresponds to the factor: 0 - factors are absent, 1 -
 factor distance, 2 - priority and etc.)
 9 Monitoring data 0-10 (0 - not allocated categories, 1 - male, 2 - female, 3 - driving
 driver category experience 0 full years and etc.)
 10 General data factor 0-9 (the digit corresponds to the factor: 0 - factors are absent, 1 -
 distance, 2 - priority and etc.)
 11 General data driver 0-10 (0 - not allocated categories, 1 - male, 2 - female, 3 - driving
 category experience 0 full years and etc.)

 3 Theory
 Let us dwell in more detail on the technique of calculations. The marker of the cause of the
 accident rate was calculated. This is a row matrix, the elements of which are the portions:
 nio ⋅ N
 Ki = , (1)
 N o ⋅ ni

 where – total number of RA, – the number of RA with the i factor, – total number
 of RA in the node, – the number of RA in the node with the i factor. List of factors-
 conditions associated with RA or types of RA, is set in advance. When annotating the largest
 coefficients in groups are taken into account: driving experience, gender, driver age,
 concomitant factor, weather factor. In this case, weather factors are displayed only when the
 conditions of clause 2 are fulfilled, other factors only if their value is not less than the
 specified threshold, the latter is proposed to be taken equal to 1.2, i.e. the average accident
 rate is exceeded by 20%.
 The following list of accompanying factors and types of RA was considered: "Distance",
 "Priority", "Speed", "Side interval", "Snowy road", "Ice", "Snow roll", "Snowfall", "Accident
 on the pedestrian".

 4
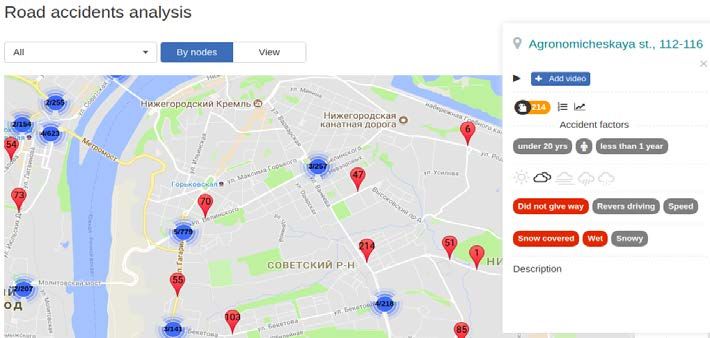
MATEC Web of Conferences 334, 01007 (2021) https://doi.org/10.1051/matecconf/202133401007
ITMTS 2020

 The meaning of the items is clear enough, so "Distance" means that an accident occurred
 because of a small distance between the cars, "Priority" - priority is not met when crossing
 the intersection, etc., "Speed" - selected speed mode, which not appropriate of situation on
 the road, etc. This list is not final and its composition is the topic of a separate study.
 For the formation of visual annotated messages, the information window of the node is
 currently used (Figure. 4).
 Each of the icons is active if the factor affects the accident. When creating audio
 messages, it is planned to use correspondence tables: for each combination of factors, a
 message is created. These tables are currently being developed by the authors. We give an
 example of such a correspondence (Table 2).
 It follows from the table that criterion 5 has been fulfilled - an increase in the number of
 RA is predicted due to the formation of snow roll and ice. Since the accident in this center is
 associated with a violation of priority in icy conditions, i.e. predictable and potentially
 dangerous factors coincide, then when approaching this node, drivers of all categories should
 receive an annotated message:
 • drivers following the main road: "When approaching the intersection with a street ____
 slow down and be careful: the ice is possible";
 • drivers following a secondary road: "When driving to the street ____ make sure in the
 safety of the maneuver, at the crossroads is possible ice".

 Fig. 4. Information window of the detailed information of a node.
 Table 2. Example accident factors matching table.
 № Data Value
 1 Expert's comment ''
 2 Weather criteria 1 0
 3 Weather criteria 2 0
 4 Weather criteria 3 0
 5 Weather criteria 4 0
 6 Weather criteria 5 1
 7 Road infrastructure 0
 8 Monitoring data factor 0
 9 Monitoring data driver category 0
 10 General data factor 2 (priority), 6 (ice)
 11 General data driver category 1 (male), 4 (driving experience 1-2 full
 years)

 5
MATEC Web of Conferences 334, 01007 (2021) https://doi.org/10.1051/matecconf/202133401007
ITMTS 2020

 4 Results
 The algorithm of automated annotation of areas of roads with increased accidents is
 developed.

 5 Discussion
 The algorithm considered in this paper creates messages about safe driving for drivers.
 Messages are dynamically generated depending on the traffic situation, weather, time of the
 day and the driver's personality. The algorithm can be used in navigators or similar devices,
 as well as for machines with an autonomous control system. It is understood that this
 algorithm will be included in the traffic safety subsystem of the information and control
 transport system of a city. The transport system should also be integrated into the global
 information space - the "Smart City" and be its subsystem.

 6 Conclusion
 In the paper, an algorithm is considered that allows, on the basis of a road process information
 analysis, which dynamically loads to the database, to form text or sound messages for the
 participants of the road process.
 The algorithm of automated annotation is tested on the web resource "Interactive map of
 the accident rate of Nizhny Novgorod". In the future it is planned to use it in navigation
 applications for smartphones, with the function of informing the driver about accidents
 factors while driving along the route.

 References
 1. K. Duivenvoorden, The relationship between traffic volume and road safety on the
 secondary road network, A literature review. D-2010-2.SWOV Institute for Road
 Safety Research, Leidschendam (2010)
 2. T.F. Golob, W. Recker, & Y. Pavlis, Probabilistic models of freeway safety
 performance using traffic flow data as predictors. In: Safety Science, 46 (9), p. 1306-
 1333 (2008)
 3. L.Y. Chang, W.C. Chen, Data mining of tree-based models to analyze freeway
 accident frequency, Journal of Safety Research, 36, p. 365–375 (2005).
 4. T. Brijs, D. Karlis, G. Wets, Studying the effect of weather conditions on daily crash
 counts using a discrete time series model, Accident Analysis and Prevention, 40 (3),
 1180–1190 (2008)
 5. Michael Eliseev, Tatyana Tomchinskaya, Alexandr Lipenkov, Alexandr Blinov, Using
 3D-modeling Technologies to Increase Road Safety, Transportation Research Procedia,
 Volume 20, Pages 1-756 (2017)
 6. Daito Kodama, and Ozawa, Real Time Accident Risk Information Provision on a
 Urban Expressway Network: Prediction Model Analysis and Development of a
 Provision System, Proceedings of the 51st Spring Conference of the Committee of
 Infrastructure Planning and Management, (2015)
 7. B. H. DeLucia, and R. A. Scopatz, E-Crash: The Model Electronic Crash Data
 Collection System, Report DOT HS 811 326, National Highway Traffic Safety
 Administration (NHTSA), Washington, DC. (2010)

 6
MATEC Web of Conferences 334, 01007 (2021) https://doi.org/10.1051/matecconf/202133401007
ITMTS 2020

 8. A. Graettinger, J. K. Lindly, and G. J. Mistry, Display and Analysis of Crash Data.
 Report 03102, University Transportation Center for Alabama (UTCA), Tuscaloosa,
 AL. (2005)
 9. G. Khan, K. R. Santiago-Chaparro, X. Qin, and D. A. Noyce, Application and
 Integration of Lattice Data Analysis, Network K-Functions, and Geographic
 Information System Software to Study Ice-Related Crashes, Transportation Research
 Record: Journal of the Transportation Research Board, 2136, pp. 67-76. (2009)
 10. Alexander Paz, Naveen Veeramisti, Romesh Khaddar, Hanns de la Fuente-Mella, and
 LuizaModorcea, Traffic and Driving Simulator Based on Architecture of Interactive
 Motion, The Scientific World Journal, 2015, Article ID 340576, 9 pages, (2015).
 11. S. Espie, D. Gattuso, F. Galante, A hybrid traffic model coupling macro and
 behavioural micro simulation, Proceedings of the 85th Annual Meeting Transportation
 Research Board; Washington, DC, USA (2006)
 12. P. Songchitruksa, K.N. Balke, Assessing weather, environment, and loop data for real-
 time freeway incident prediction, Transport Research Record 1959, pp. 105–113.
 (2006)
 13. M. Kilpeläinen, & H. Summala, Effects of weather and weather forecasts on driver
 behaviour, Transportation Research Part F 10, pp. 288–299 (2007)
 14. K. Keay, I. Simmonds, Road accidents and rainfall in a large Australian city, Accident
 Analysis and Prevention, 38 (3), pp. 445-454 (2006)
 15. L. Fridström, J. Ifver, S. Ingebrigtsen, R. Kulmala, L.K. Thomsen, Measuring the
 contribution of randomness, exposure, weather, and daylight to the variation in road
 accident counts, Accident Analysis and Prevention, 27 (1), pp. 1-20 (1995)
 16. M.E. Eliseev, N.A. Kuzmin, A.A. Repnikov, Analyzing weather factors of an
 interactive map for accident subsystem, Intellekt. Innovacii. Investicii., 2, pp. 124-127
 (2016)

 7
You can also read