USING THE NOVEL MORTALITY-PREVALENCE RATIO TO EVALUATE POTENTIALLY UNDOCUMENTED SARS-COV-2 INFECTION: CORRELATIONAL STUDY
←
→
Page content transcription
If your browser does not render page correctly, please read the page content below
JMIR PUBLIC HEALTH AND SURVEILLANCE                                                                                                               Lin et al

     Original Paper

     Using the Novel Mortality-Prevalence Ratio to Evaluate Potentially
     Undocumented SARS-CoV-2 Infection: Correlational Study

     Sheng-Hsuan Lin, ScM, MD, ScD; Shih-Chen Fu, PhD; Chu-Lan Michael Kao, PhD
     Institute of Statistics, National Chiao Tung University, Hsinchu, Taiwan

     Corresponding Author:
     Chu-Lan Michael Kao, PhD
     Institute of Statistics
     National Chiao Tung University
     Assembly Building I, 4th Floor
     1001 University Road
     Hsinchu, 30010
     Taiwan
     Phone: 886 35712121 ext 56822
     Email: chulankao@gmail.com

     Abstract
     Background: The high prevalence of COVID-19 has resulted in 200,000 deaths as of early 2020. The corresponding mortality
     rate among different countries and times varies.
     Objective: This study aims to investigate the relationship between the mortality rate and prevalence of COVID-19 within a
     country.
     Methods: We collected data from the Johns Hopkins Coronavirus Resource Center. These data included the daily cumulative
     death count, recovered count, and confirmed count for each country. This study focused on a total of 36 countries with over
     10,000 confirmed COVID-19 cases. Mortality was the main outcome and dependent variable, and it was computed by dividing
     the number of COVID-19 deaths by the number of confirmed cases.
     Results: The results of our global panel regression analysis showed that there was a highly significant correlation between
     prevalence and mortality (ρ=0.8304; P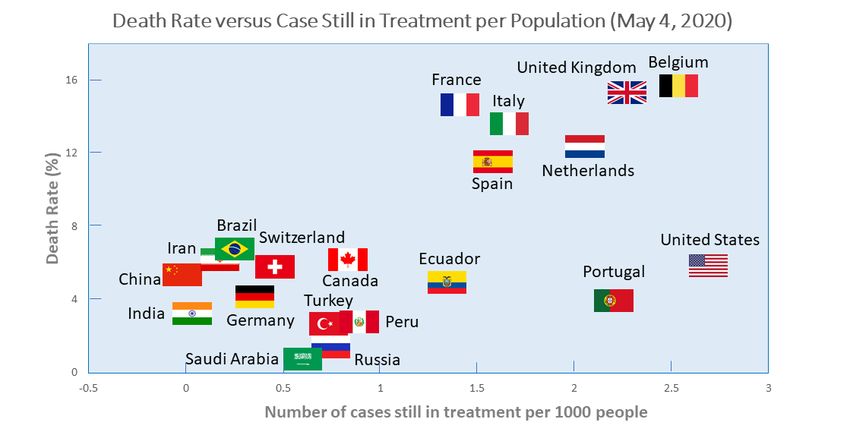
JMIR PUBLIC HEALTH AND SURVEILLANCE                                                                                                          Lin et al

     Most results have been derived from traditional epidemiological     To investigate the association between mortality and prevalence
     models, wherein both COVID-19 mortality (ie, the “case fatality     after adjusting for the baseline mortality in each country and
     rate” in some literature) and recovery rates were assumed to be     the effect of regular fluctuation over time, we built the following
     constants. However, in a study conducted by Bialek et al [7],       panel regression model (ie, Model 1):
     heterogeneity in mortality rates was found among countries and
                                                                              Mit = βcountry + βt + γPit + εit .....(4)
     cities, but this has been attributed to the assumed underlying
     medical conditions within an area [8-10]. The trend in mortality    In this model, βcountry represents the country-specific baseline
     over time is also controversial [11-13]. Although results from      mortality; βt is the time-fixed effect on the mortality; γ represents
     an exponential growth model have shown an overall exponential       the global association between Pit and Mit, which we referred
     decay in mortality within China since the disease outbreak [13],    to as the global mortality-prevalence ratio; and εit is the residual.
     there has been evidence that shows disease prevalence influences    To meet the assumption that the mortality-prevalence ratio
     disease mortality to a considerable extent. The rapid increase      varies in each country, we built a panel regression model (ie,
     in the number of infections may result in the collapse of the       Model 2), in which the global mortality-prevalence ratio was
     health care system, leading to a sharp rise of mortality [11,12].   replaced with the country-specific mortality-prevalence ratio,
     Despite the inconsistencies in mortality characteristics between    γcountry. Model 2 is described as follows:
     studies, previous analyses have been performed with data that
     were collected before March, 2020. Up until then, only a few             Mit = βcountry + βt + γcountryPit + εit .....(5)
     countries reported the number of COVID-19 deaths, whereas
                                                                         In this model, γcountry is the country-specific association between
     most areas were not majorly affected by COVID-19.
                                                                         Pit and Mit, which we referred to as the country-specific
     This study aims to sophisticatedly quantify the relationship        mortality-prevalence ratio. Furthermore, we tested whether
     between COVID-19 prevalence and mortality, by using data            γcountry differed between each country with an analysis of
     that have been updated up until May 2, 2020. A linear               variance test. We also tested whether the difference could be
     relationship between prevalence and mortality was observed,         treated as the random effect of a normal population with the
     and this was referred to as the mortality-prevalence ratio. The     Shapiro-Wilk normality test. All analyses were conducted with
     global mortality-prevalence ratio was estimated after adjusting     R version 3.5.2. The approval of an institutional review board
     for country-specific baseline mortality and time-fixed effects.     was not required because no individual-level/personal data were
     Country-specific mortality-prevalence ratio values can be used      used.
     as a powerful index for identifying countries with a substantial
     number undocumented infections or overburdened health care          Results
     systems.
                                                                         Table 1 shows the population and the total number of confirmed
     Methods                                                             cases, death cases, and recovered cases for countries that
                                                                         reported at least 10,000 confirmed cases by May 2, 2020. Figure
     COVID-19–related data [14] was downloaded from the Johns            1 shows the association between COVID-19 prevalence and
     Hopkins Coronavirus Resource Center. These data included the        mortality among these countries. The Spearman correlation
     cumulative number of confirmed cases (Cit), death cases (Dit),      coefficient was 0.8304 (P
JMIR PUBLIC HEALTH AND SURVEILLANCE Lin et al
Table 1. Total population and the total number of confirmed cases, death cases, and recovered cases for countries that reported at least 10,000 confirmed
cases by May 2, 2020.
Country Total population, N Confirmed cases, n Deaths, n Recovered cases, n
Austria 9,006,398 15,558 596 13,180
Belarus 9,449,323 15,828 97 3117
Belgium 11,589,623 49,517 7765 12,211
Brazil 212,559,417 97,100 6761 40,937
Canada 37,742,154 57,926 3684 23,814
Chile 19,116,201 18,435 247 9572
China 1,439,323,776 83,959 4637 78,586
Ecuador 17,643,054 27,464 1371 2132
France 65,273,511 168,518 24,763 50,663
Germany 83,783,942 164,967 6812 129,000
India 1,380,004,385 39,699 1323 10,819
Indonesia 273,523,615 10,843 831 1665
Iran 83,992,949 96,448 6156 77,350
Ireland 4,937,786 21,176 1286 13,386
Israel 8,655,535 16,185 229 9593
Italy 60,461,826 209,328 28,710 79,914
Japan 126,476,461 14,571 474 3205
Mexico 128,932,753 22,088 2061 12,377
Netherlands 17,134,872 40,434 5003 138
Pakistan 220,892,340 19,103 440 4817
Peru 32,971,854 42,534 1200 12,434
Poland 37,846,611 13,375 664 3762
Portugal 10,196,709 25,190 1023 1671
Qatar 2,881,053 14,872 12 1534
Romania 19,237,691 12,732 771 4547
Russia 145,934,462 124,054 1222 15,013
Saudi Arabia 34,813,871 25,459 176 3765
Singapore 5,850,342 17,548 17 1347
Spain 46,754,778 216,582 25,100 117,248
Sweden 10,099,265 22,082 2669 1005
Switzerland 8,654,622 29,817 1762 24,200
Turkey 84,339,067 124,375 3336 58,259
Ukraine 43,733,762 11,411 279 1498
United Arab Emirates 9,890,402 13,599 119 2664
United Kingdom 67,886,011 183,500 28,205 896
United States 331,002,651 1,132,539 66,369 175,382
http://publichealth.jmir.org/2021/1/e23034/ JMIR Public Health Surveill 2021 | vol. 7 | iss. 1 | e23034 | p. 3
(page number not for citation purposes)
XSL• FO
RenderXJMIR PUBLIC HEALTH AND SURVEILLANCE Lin et al
Figure 1. COVID-19 mortality and prevalence of all countries (ρ=0.8304; PJMIR PUBLIC HEALTH AND SURVEILLANCE Lin et al
Table 2. Estimation of all coefficients for Model 1 and Model 2.
Model Estimation P value Partial R2
Model 1a
Mortality-prevalence ratio (ie, γ) 12.9268JMIR PUBLIC HEALTH AND SURVEILLANCE Lin et al
Model Estimation P value Partial R2
All data excluding those collected from China after February 17, 2020
Austria –18.4144JMIR PUBLIC HEALTH AND SURVEILLANCE Lin et al
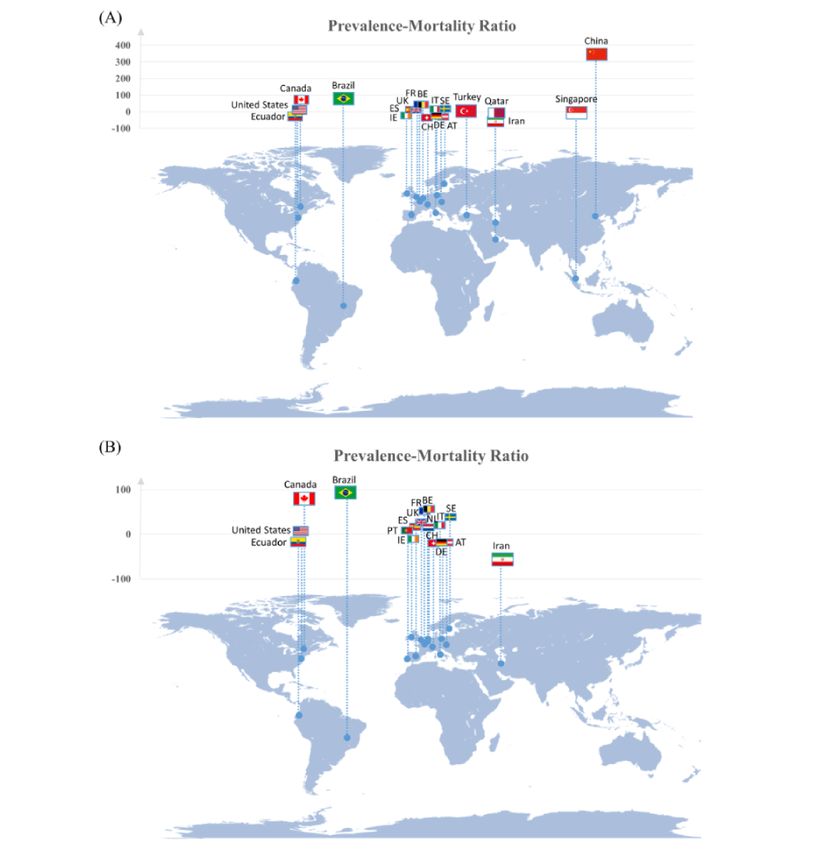
the hypothesis that all significant country-specific correlation had turned from positive to negative after February
mortality-prevalence ratios came from a normal distribution 17, 2020 (Figure 4). This disparity was not observed if the data
(PJMIR PUBLIC HEALTH AND SURVEILLANCE Lin et al
Figure 4. COVID-19 prevalence and mortality reported by China over time.
distancing, restricting travel, encouraging the wearing of facial
Discussion masks and hand washing, and cancelling large events. Although
This is the first study to assess the correlation between the mortality rate of a certain infectious disease is traditionally
COVID-19 prevalence and mortality after adjusting for assumed to be a constant in an infectious dynamic model [16],
time-fixed effects and country-specific baseline mortality. We it is conceivable that a highly infectious disease affects the
proposed the mortality-prevalence ratio as a novel characteristic quality and availability of a health care system. The fast
for an infectious disease pandemic because of the high consumption of ventilation machines and the decline of
association between disease mortality and prevalence. In nurse-to-patient ratios accelerate mortality. Prevention policies
addition, a disparity in the mortality-prevalence ratios of 5 not only lower the financial burden on COVID-19 diagnosis
countries was observed; China was the only country with a and treatment, but also reduce COVID-19 mortality. Therefore,
significant mortality-prevalence ratio (348; PJMIR PUBLIC HEALTH AND SURVEILLANCE Lin et al
disparities in mortality-prevalence ratios, a more direct index mortality-prevalence ratios. Our results highlight the benefit of
merits further study. constraining disease transmission to reduce mortality. Disparities
in mortality-prevalence ratios can also be a powerful tool to
In conclusion, we observed the relationship between COVID-19
detect, or even quantify, the proportion of undocumented
mortality and prevalence and quantified this relationship as
infections.
Acknowledgments
We thank Ms Kai-Fen Wong for editing the figures. This study was supported by the Ministry Of Science and Technology,
Taiwan (grant numbers 107-2118-M-009-003-MY2 and 108-2636-B-009-001).
Authors' Contributions
SHL and CLMK came up with the original idea. SHL and CLMK wrote the first version of manuscript. SCF edited the manuscript.
CLMK built the model, wrote all the software, and conducted the data analysis.
Conflicts of Interest
None declared.
References
1. Zhu N, Zhang D, Wang W, Li X, Yang B, Song J, China Novel Coronavirus Investigating and Research Team. A Novel
Coronavirus from Patients with Pneumonia in China, 2019. N Engl J Med 2020 Feb 20;382(8):727-733 [FREE Full text]
[doi: 10.1056/NEJMoa2001017] [Medline: 31978945]
2. Coronavirusdisease (COVID-19) Situation Report–105. World Health Organization. URL: https://www.who.int/docs/
default-source/coronaviruse/situation-reports/20200504-covid-19-sitrep-105.pdf?sfvrsn=4cdda8af_2 [accessed 2021-01-05]
3. Johns Hopkins Coronavirus Resource Center. Johns Hopkins University & Medicine. URL: https://coronavirus.jhu.edu/
[accessed 2021-01-05]
4. Li R, Pei S, Chen B, Song Y, Zhang T, Yang W, et al. Substantial undocumented infection facilitates the rapid dissemination
of novel coronavirus (SARS-CoV-2). Science 2020 May 01;368(6490):489-493 [FREE Full text] [doi:
10.1126/science.abb3221] [Medline: 32179701]
5. Weitz JS, Beckett SJ, Coenen AR, Demory D, Dominguez-Mirazo M, Dushoff J, et al. Modeling shield immunity to reduce
COVID-19 epidemic spread. Nat Med 2020 Jun;26(6):849-854. [doi: 10.1038/s41591-020-0895-3] [Medline: 32382154]
6. Prem K, Liu Y, Russell TW, Kucharski AJ, Eggo RM, Davies N, Centre for the Mathematical Modelling of Infectious
Diseases COVID-19 Working Group, et al. The effect of control strategies to reduce social mixing on outcomes of the
COVID-19 epidemic in Wuhan, China: a modelling study. Lancet Public Health 2020 May;5(5):e261-e270 [FREE Full
text] [doi: 10.1016/S2468-2667(20)30073-6] [Medline: 32220655]
7. CDC COVID-19 Response Team. Geographic Differences in COVID-19 Cases, Deaths, and Incidence - United States,
February 12-April 7, 2020. MMWR Morb Mortal Wkly Rep 2020 Apr 17;69(15):465-471 [FREE Full text] [doi:
10.15585/mmwr.mm6915e4] [Medline: 32298250]
8. Chen N, Zhou M, Dong X, Qu J, Gong F, Han Y, et al. Epidemiological and clinical characteristics of 99 cases of 2019
novel coronavirus pneumonia in Wuhan, China: a descriptive study. Lancet 2020 Feb 15;395(10223):507-513 [FREE Full
text] [doi: 10.1016/S0140-6736(20)30211-7] [Medline: 32007143]
9. Huang C, Wang Y, Li X, Ren L, Zhao J, Hu Y, et al. Clinical features of patients infected with 2019 novel coronavirus in
Wuhan, China. Lancet 2020 Feb 15;395(10223):497-506 [FREE Full text] [doi: 10.1016/S0140-6736(20)30183-5] [Medline:
31986264]
10. Lescure FX, Bouadma L, Nguyen D, Parisey M, Wicky PH, Behillil S, et al. Clinical and virological data of the first cases
of COVID-19 in Europe: a case series. Lancet Infect Dis 2020 Jun;20(6):697-706 [FREE Full text] [doi:
10.1016/S1473-3099(20)30200-0] [Medline: 32224310]
11. Lai CC, Wang CY, Wang YH, Hsueh SC, Ko WC, Hsueh PR. Global epidemiology of coronavirus disease 2019 (COVID-19):
disease incidence, daily cumulative index, mortality, and their association with country healthcare resources and economic
status. Int J Antimicrob Agents 2020 Apr;55(4):105946 [FREE Full text] [doi: 10.1016/j.ijantimicag.2020.105946] [Medline:
32199877]
12. Ji Y, Ma Z, Peppelenbosch MP, Pan Q. Potential association between COVID-19 mortality and health-care resource
availability. Lancet Glob Health 2020 Apr;8(4):e480 [FREE Full text] [doi: 10.1016/S2214-109X(20)30068-1] [Medline:
32109372]
13. Zhang Z, Yao W, Wang Y, Long C, Fu X. Wuhan and Hubei COVID-19 mortality analysis reveals the critical role of timely
supply of medical resources. J Infect 2020 Jul;81(1):147-178 [FREE Full text] [doi: 10.1016/j.jinf.2020.03.018] [Medline:
32209384]
http://publichealth.jmir.org/2021/1/e23034/ JMIR Public Health Surveill 2021 | vol. 7 | iss. 1 | e23034 | p. 9
(page number not for citation purposes)
XSL• FO
RenderXJMIR PUBLIC HEALTH AND SURVEILLANCE Lin et al
14. COVID-19/time_series_covid19_confirmed_global.csv. GitHub. URL: https://github.com/CSSEGISandData/COVID-19/
blob/master/csse_covid_19_data/csse_covid_19_time_series/time_series_covid19_confirmed_global.csv [accessed
2021-01-06]
15. Countries by Density 2020. World Population Review. URL: https://worldpopulationreview.com/countries/
countries-by-density/ [accessed 2021-01-06]
16. Wang XS, Wu J, Yang Y. Richards model revisited: validation by and application to infection dynamics. J Theor Biol 2012
Nov 21;313:12-19. [doi: 10.1016/j.jtbi.2012.07.024] [Medline: 22889641]
17. Rothman KJ. Modern epidemiology. Boston, MA: Little Brown & Co; 1986.
Abbreviations
SARS: severe acute respiratory syndrome
Edited by G Eysenbach; submitted 31.07.20; peer-reviewed by LA Lee, W Zhang; comments to author 20.11.20; revised version
received 26.11.20; accepted 14.12.20; published 27.01.21
Please cite as:
Lin SH, Fu SC, Kao CLM
Using the Novel Mortality-Prevalence Ratio to Evaluate Potentially Undocumented SARS-CoV-2 Infection: Correlational Study
JMIR Public Health Surveill 2021;7(1):e23034
URL: http://publichealth.jmir.org/2021/1/e23034/
doi: 10.2196/23034
PMID:
©Sheng-Hsuan Lin, Shih-Chen Fu, Chu-Lan Michael Kao. Originally published in JMIR Public Health and Surveillance
(http://publichealth.jmir.org), 27.01.2021. This is an open-access article distributed under the terms of the Creative Commons
Attribution License (https://creativecommons.org/licenses/by/4.0/), which permits unrestricted use, distribution, and reproduction
in any medium, provided the original work, first published in JMIR Public Health and Surveillance, is properly cited. The complete
bibliographic information, a link to the original publication on http://publichealth.jmir.org, as well as this copyright and license
information must be included.
http://publichealth.jmir.org/2021/1/e23034/ JMIR Public Health Surveill 2021 | vol. 7 | iss. 1 | e23034 | p. 10
(page number not for citation purposes)
XSL• FO
RenderXYou can also read