The global research system 2. The pandemic and international student mobility 3. Asia-Pacific geopolitics and national politics - Global ...
←
→
Page content transcription
If your browser does not render page correctly, please read the page content below
Global, national and local higher education in 2021
JCU, 26 Nov 2020
Simon Marginson / University of Oxford

1. The global research system
2. The pandemic and international
   student mobility
3. Asia-Pacific geopolitics and national
   politics
1. GLOBAL RESEARCH SYSTEM
Since the 1990s a global science system has formed, based on the common
pool of papers, and held together by extensive and growing cross-border
citation and collaboration (joint papers) –
- the global science system is based on grass roots collaboration and has significant autonomy
from national governments and national science systems – but the global system is ultimately
supported by national and institutional funding and infrastructure
- many leading scientists wear two hats, (1) institutional/national and (2) disciplinary/global
- the longer-term future of the global science system is by no means certain
The global science system is very dynamic

• Growth: Rapid increases in many countries in R&D spending and growth of
  published science papers at 5 per cent a year from 2000-2018
• Diversification: Science no longer an oligopoly of North America, Europe
  and Japan. Spread of national science capacity to many more countries
• Networked cooperation: Rapid growth of co-authorship in science at both
  global and national levels, everywhere. International collaboration the
  main form of activity in leading research universities
• Pluralisation: Widening of group of leading science countries, rise of semi-
  independent systems in China, South Korea, India, Iran, Brazil etc (though
  US science remains very strong and globally central)
• Global integration: Increase in the weight and role of the global science
  system vis a vis national science systems. But geo-political tensions now
  threaten the autonomy of global scientific cooperation
Number of science papers in Scopus
             by large world region: 1996-2018

3,000,000

2,500,000                                                     India
                                                    Japan

                                                                                 Rest of the world
2,000,000

1,500,000
                                                                                            China

1,000,000
                                                                                 European Union
 500,000

                                                                                     United States
       0

               United States   EU   China   Japan     India     Rest of world

                                                                      US National Science Board
Fastest growing national science systems
Average annual growth (%) in science papers: 2000-2018
Countries with growth rate above the world average of 4.95% per year and
producing more than 5000 papers in 2018
30
26.4
White bars indicate that national GDP PPP per capita in
25
2018 was BELOW the world average of US $17,912
21.0
20
17.4
15.5
15.0
15 13.6
12.7
11.9
11.4
10.7
10.3
9.8
10 9.3 9.2 9.0 8.8 8.4 8.4 8.3
6.9
6.1 5.8 5.7 5.3 5.3 5.0 5.0 4.7
5
2.3
1.8 1.6 1.3
0.1
0
US National Science Board, 2020Growth in internationally co-authored
science papers, all countries: 1996-2018
25.00
22.5
21.7 22.0 600,000
21.2
20.5
19.8
20.00 19.0
17.5 17.7
18.1 500,000
16.7 17.0 17.1
16.4 16.5 16.3
15.00 13.8 400,000
13.3 13.5 13.6 12.9
12.4 12.8
300,000
10.00
200,000
5.00
100,000
0.00 0
Internationally co-authored papers Internationally co-authored papers as proportion (%) of all papers
US National Science Board, 2020Rise of science in East Asia
Growth in R&D in higher education, 1996-2018
12.00 600,000.00
China 10.24
10.00 500,000.00
8.00 400,000.00
6.00 300,000.00
4.00 200,000.00
South Korea 3.11
2.00 100,000.00
Japan 1.03
1.00
0.00 0.00
China total papers (right hand axis) Japan South Korea China Singapore Taiwan
OECD, US National Science BoardTop universities in STEM research
(1) physical sciences and engineering, and (2) mathematics and complex computing,
papers in top 5 per cent of their field by citation rate, World: 2015-2018
University System Physical sciences University System Maths &
& engineering computing
Tsinghua U CHINA 830 Tsinghua U CHINA 300
Massachusetts IT USA 687 Harbin IT CHINA 252
Zhejiang U CHINA 569 U Electronic S&T CHINA 217
Stanford U USA 563 Xidian U CHINA 201
Nanyang TU SINGAPORE 533 Beihang U CHINA 197
Harvard U USA 532 Zhejiang U CHINA 197
U Calif., Berkeley USA 531 Huazhong U S&T CHINA 195
U Science & T. CHINA 500 Nanyang TU SINGAPORE 181
Harbin IT CHINA 455 Massachusetts IT USA 180
Xi’an Jiaotong U CHINA 455 Shanghai JT U CHINA 153
Shanghai JT U CHINA 439 Stanford U USA 151
U Cambridge UK 424 Northwestern P. U CHINA 149
Huazhong U S&T CHINA 419 Southeastern U CHINA 148
ETH Zurich SWITZERLAND 417 NU Singapore SINGAPORE 140
Leiden rankingMaths and Computing Physical Sci and Engineering
Europe, 17
USA, 26 Europe, 16
Rest of USA, 28
Rest of
world, 9
world, 8
China, 45
Other East Other East
Asia, 3 Asia, 6 China , 42
Biomedical and
Health Sci
Top 100 universities
Europe, 35 USA, 44 on basis of number
of top 5% papers,
Rest of
2015-2018
world, 13
Other East Leiden ranking
China, 6
Asia, 2Australia’s position:
Shanghai ARWU top 10 countries, 2020
top 100 universities top 500 universities
United States 45 137
United Kingdom 8 36
Australia 7 23
China (mainland only) 6 71
France 5 17
Switzerland 5 8
Germany 4 30
Canada 4 19
Netherlands 4 12
Japan 3 14Universities in Shanghai ARWU top 500, 2020
position universities
1-100 Melbourne (35), Queensland (54), ANU (67), UNSW (74), Sydney
(74), Monash (85), Western Australia (85)
101-200 Adelaide (151-200)
201-300 Curtin, Deakin, Macquarie, Swinburne, Tasmania, UT Sydney,
Wollongong,
301-400 Griffith, James Cook, La Trobe, Queensland UT, RMIT, Newcastle,
Western Sydney
401-500 Flinders
A further 10 Australian universities are ranked between 501 and 1000, so that
33 are ranked altogether. The ARWU is an exclusively research-based rankingWhat a ‘failed business model’ has achieved :
Proportion of science papers in top 5% of their disciplinary field
on the basis of citations, Scopus
12.00
10.00
8.00
6.00
World average = 5.00%
4.00
2.00
5.96 5.92 6.21 6.28 6.10 6.40 6.72 6.69 7.01 6.79 7.30 7.37 7.83 8.30 8.26 8.78 8.74 8.98 9.28 9.56 9.65
0.00
Australia USA UK CanadaProportion (%) of papers in top 1% of their field, US,
China and Australia: 2016 (world average = 1.0)
4
3.5
3
2.5
2
1.5
1
0.5
0
National Science Board
United States China AustraliaJCU in the global research system • In world top 400 research universities in ARWU in 2020 • Special strength in ‘Life and Earth Sciences’ category in Leiden ranking. In high citation papers (top 5% in their field) JCU was fifth in this discipline category in Australia and 64th in the world, producing 101 such papers in 2015-18 • This compares to 118th position in the world nine years earlier in the first Leiden count, of 2006-2009 papers • In 2015-18, 8.8% of JCU’s papers in Earth and Life Sciences were in the top 5% by citations – highest rate of any Australian university using this quality measure • Of JCU’s 2827 papers in Life and Earth Sciences in 2015-18, 1810 of them (64.0%) involved international collaborations
2. THE PANDEMIC AND
INTERNATIONAL STUDENT MOBILITY
International/ foreign students in tertiary education,
            worldwide numbers, 1998-2018 (millions)
                                                 OECD data 2020

6.0
                                                                                                                       5.6
                                                                                                                 5.3
              TO OECD COUNTRIES      TO NON-OECD COUNTRIES         TOTAL
                                                                                                           5.1
5.0                                                                                                  4.7
                                                                                               4.4
                                                                                 3.9 3.9 4.0
4.0                                                                        3.6
                                                                    3.4
                                                             3.2
                                                      3.0
3.0                                         2.8 2.8
                                  2.6 2.6
                           2.4
              2.1 2.1
      1.9 2.0
2.0

1.0

0.0
      1998 1999 2000 2001 2002 2003 2004 2005 2006 2007 2008 2009 2010 2011 2012 2013 2014 2015 2016 2017 2018
International students, UK and Australia, 1998-2018
500,000
450,000
400,000
350,000
300,000
250,000
200,000
150,000
100,000
50,000
Australia UK
0
Data: UNESCO Institute of StatisticsInternational student mobility in 2020-21
compared to 2018 enrolment numbers
United States 987,000
United Kingdom 452,000
Australia 445,000
Germany 312,000
Russia 262,000
France 230,000
DARK BLUE – onshore enrolment
Canada 225,000 up in 2020-21
Japan 183,000 MEDIUM BLUE – onshore
enrolment down in 2020-21
China 178,000
WHITE – onshore enrolment low
Turkey 125,000
in 2020-21
Italy 107,000
Netherlands 105,000
0 200,000 400,000 600,000 800,000 1,000,000 1,200,000International student mobility affected
differently across the world
‘The crisis has affected the safety and legal status of international students in their host country, the continuity of
learning and the delivery of course material, and student perception of the value of their degree, all of which
could have dire consequences for international student mobility in the coming years’ - OECD, Education at a
Glance 2020
• UK (452,000 students in 2018): has never closed the border though
pandemic is rife, this year 2020-21 accepting 7% more non-European
international students, growth is in high prestige universities
• US (987,000 in 2018), 43% drop in new enrolments in 2020-21
• Inward plane travel is partly or largely blocked into Australia (445,000
students in 2018), Germany (312,000), Japan (183,000), Turkey (125,000)
• Germany international applications down 20%, Netherlands down more
• International enrolment impaired in many other countries including Canada,
New ZealandUS campuses are struggling • In the US more than 100,000 confirmed cases on campus since March including 3000 at the U Georgia, 2000 U Alabama, 2000 U South Carolina • The main problems are in student residences and student accommodation in university towns, and sudden local spikes in the pandemic are forcing lockdowns and switch to online only • 24 September figures suggest 2020-21 enrolment is down by 4% including a 16% drop in first-year enrolment; the decline is mostly in community colleges which have seen a drop of 9%, and 23% in first-year enrolment • International student mobility was down 14% in September and the most recent data report a 43% drop in new enrolments 2020-21
Covid-19 hit amid worsening geo-political rivalry, weakening of multilateral
institutions, implosion of national politics, and increasing state controls
1.   The pandemic shows that collaboration between nation-states is not
     solving global problems, but cooperation between research universities
     works well: they have more common values than do nations
2.   The impact of the pandemic in society/economy, and in higher
     education, is highly differentiated by state policies and political cultures.
     East Asia and Nordic countries have done well. The differentiating effects
     between systems will have long term effects. Higher education systems
     with a public good model of higher education have proven to be stronger
     in the crisis (Western Europe, East Asia).
3.   Financial sustainability of institutions is a major issue in the marketised
     systems (e.g. Anglophone) and emerging countries (e.g. India and Brazil)
4. The research intensive university, but not all institutional models, has
proven fairly robust. However its autonomy is under greater pressure
from governments in some countries
5. In higher education, unless there is system collapse, domestic student
demand will grow during and after the pandemic. But graduate under-
employment and social equity problems will intensify
6. Face to face and online higher education will become more
differentiated, emerging as distinct products and in some countries,
different tuition prices
7. International student mobility will take at least five years to recover; old
demand/supply patterns will prove resilient but with some modificationWhere will global student mobility recover best? • East Asia (China, South Korea, Taiwan, Singapore, Japan) and some European countries (e.g. Finland, Denmark, Germany) have managed the pandemic best and will spring back in higher education. Their universities have strong government support. All these countries can gain ground in the global student market if they want to increase recruitment • Despite high Covid-19 death tolls US and UK will remain high demand nations (numbers are essentially supply driven, and that will not change); UK will gain short term from low mobility into US but US will spring back after the pandemic, Biden will support international education but question-mark about China • Australia has a lower Covid-19 death toll, but is blocking inward flights. Weaker demand than US/UK, slow recovery to pre-pandemic levels, political tension with China, research decline in future may impact global reputation • Canada looks like a long-term winner. It is offering support measures targeted at students affected by the virus, including additional work rights, and access to unemployment benefits
3. ASIA-PACIFIC GEOPOLITICS AND
      AUSTRALIAN POLITICS
Changing global landscape • The world Gross Tertiary Enrolment ratio reached 38% prior to the pandemic and growth may now quicken (recession shelter effect) • Higher education is growing in all world regions, though graduate under- employment will be a massive issue in many countries • But global student mobility may take 3-5 years to recover from the pandemic • The United States remains the world-leading system, especially in research, but is under-funding its public universities and colleges • Globally the main change has been the spectacular rise of China, South Korea and Singapore in higher education and science, and they have been strengthened in comparative terms in the pandemic period • Universities and science in Western Europe are stronger than ten years ago • India, Iran and Brazil are emerging as large, important regional systems and sub- Saharan Africa is beginning to rise • Geopolitical conflict will increasingly affect higher education
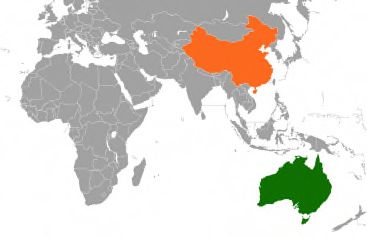
The New Cold War
Will China-US and China-Australia scientific
                collaboration survive?
• Scientific globalism versus technological nationalism (Lee and Haupt 2020)
• In 2018 scientists from China and the US collaborated on 55,382 jointly
  authored papers in Scopus. There were 26 times as many China-US papers in
  2018 as in 1996, and by far the largest nation-to-nation collaboration in
  world science (UK-US was second largest at 28,616)
• 2018 saw 13,939 Australia-US papers – and 13,138 Australia-China papers
• Measures taken by the US to retard exchange and cooperation in science
  (e.g. visa restrictions, border hostility to doctoral students, pressure to
  relinquish joint appointments and multiple projects) are strongly opposed by
  many scientists and university leaders in both countries.
• China, always prone to greater regulation, may start to close up its own
  scientific internationalisation
• University autonomy and academic freedom are crucial, if scientists and
  universities are to maintain cooperation amid these tensions
Australian higher education has challenges!
From international students as one third of all enrolled
students in higher education, to . . .
• In 2019 one third of higher education students were international, almost
500,000, mostly East, Southeast and South Asia, JCU is fortunate, its level of
dependence on international students is lower at 15% of all students
• In 2018 27% of income of higher education institutions was from
international students – and 60% of Australia’s research was funded from
universities’ own resources, mostly revenues from international education.
This above all has put seven Australian universities into the ARWU top 100
• Modest pandemic death toll in Australia. But international education has
been brought to a halt, with inward flights largely stopped. Massive loss in
revenues not compensated for. New government policy package reduces
funding rate for domestic students by an average of 6%, $1 billion for
research in budget helps but it is not enough especially if only one-off
• Government is in ongoing geo-political dispute with China, has imposed an
approval process in relation to universities’ China links, has banned selected
Chinese scholars, this may impact student market in futureThe problem in Australia
It is not primarily about international education, it is about
funding of research. Many governments are building world-
class science, no other government would leave science so
dependent on a market, no other would let it deteriorate
“An Australian government economist once told me that there was
not much value in doing research in in this country because, given
our size, we would always be an innovation importing country: we
could just buy-in whatever knowledge we needed, presumably
funding the purchase by digging resources out of the ground and
selling them."
- Michael Spence, farewell oration as Vice-Chancellor of University of Sydney, 19 November 2020You can also read