Characterization of Ottawa Sand and Application to Blast Simulations
←
→
Page content transcription
If your browser does not render page correctly, please read the page content below
EPJ Web of Conferences 250, 02009 (2021)                                  https://doi.org/10.1051/epjconf/202125002009
DYMAT 2021

       Characterization of Ottawa Sand and Application
       to Blast Simulations
       Sidney Chocron 1*, Alexander Carpenter 1, Arthur Nicholls1, James Walker 1, Ohad Elbaz2,
       Elisha Rejovitzky 2
       1 Southwest  Research Institute, 6220 Culebra Rd, San Antonio, TX 78238, USA
       2 Rafael   LTD, Haifa 3102102, Israel

                      Abstract. The present work aims at presenting consistent data both from
                      laboratory characterization and from blast tests to see how a computer model
                      performs when only data from mechanical tests are being fed to the
                      constitutive model. A sand (Ottawa 20-30) that meets ASTM C778
                      requirements, i.e., well characterized microscopically, was tested in triaxial
                      compression under confinement pressures ranging from 50 to 300 MPa and
                      moisture contents of 0 to 15% as well as high strain-rates. These tests
                      provided both the experimental equation of state (pressure vs. volume) and
                      compaction curves as well as the strength vs. pressure properties to build a
                      constitutive model both in LS-DYNA and CTH. Blast tests were
                      subsequently performed by burying explosive at three different depths inside
                      a sand pot with a rigid steel plate on top. During flight, the height of the steel
                      plate was tracked with Phantom high-speed cameras to determine the
                      impulse transmitted to the plate as well as the maximum jump height.
                      Simulations were performed with both an Eulerian code (CTH) and a
                      Lagrangian/ALE code (LS-DYNA) using the constitutive model determined
                      during the material characterization. The predictions of both codes are as
                      close as 7% and as far as 22%, depending on the test configuration.

       1 Introduction
       Finding well-characterized and well-controlled blast tests in the literature is extremely
       difficult (1–3). Many times expensive blast tests lack essential information like moisture
       content of the soil, density, and other important parameters. Consistent data with laboratory
       soil characterization (ambient and high pressures and low and high strain-rates) performed
       concurrently with blast tests is even more difficult to find. The present work by the team
       Southwest Research Institute (SwRI)/Rafael aims at presenting mechanical characterization
       data, in particular triaxial compression tests, and data from blast performed on a standard
       material to validate computer models of blast events.
           The sections below summarize the material characterization work, blast tests, and
       computer simulations performed on a standard sand called Ottawa 20-30, that meets ASTM
       C778.

       *
           Corresponding author email : sidney.chocron@swri.org

© The Authors, published by EDP Sciences. This is an open access article distributed under the terms of the Creative Commons
Attribution License 4.0 (http://creativecommons.org/licenses/by/4.0/).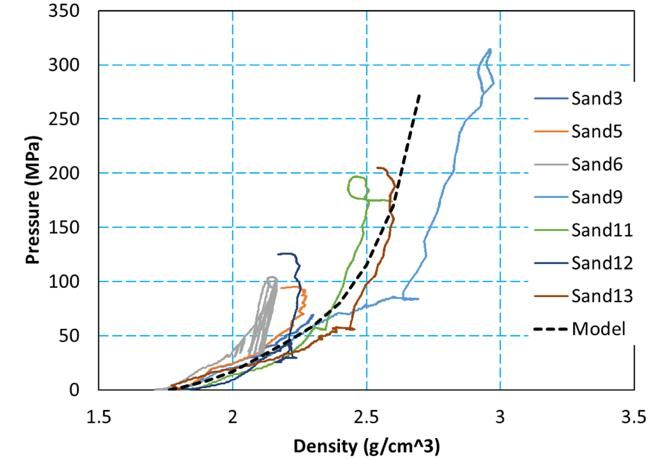
EPJ Web of Conferences 250, 02009 (2021) https://doi.org/10.1051/epjconf/202125002009
DYMAT 2021
2 Materials and summary of characterization tests
2.1 Materials
The first sand is a silica sand with brand name ASTM Ottawa 20-30 sand which meets the
ASTM C778 requirements. It is manufactured to pass No. 20 (850 m) sieve and be retained
on No. 30 (600 m). This specially graded sand for ASTM tests is made of naturally rounded
silica sands of nearly pure quartz, mined from the Ottawa, Illinois area. The sand was
purchased from https://www.certifiedmtp.com in bags of 50 lbs. The matrix density was
measured for Ottawa sand giving 2.685 g/cm3.
350 700
300 600 y = 1.1223x + 37.786
Max. Eq. Stress (MPa)
R² = 0.9983
Sand3
Pressure (MPa)
250 500
Sand5
200 400
Sand6
150 300
Sand9
Sand11 200
100
Sand12 100
50
Sand13
0
0 0 200 400
1.5 2 2.5 3 3.5 Hydrostatic Pressure (MPa)
Density (g/cm^3)
Figure 1. Ottawa Sand a) Compaction curves, b) Strength vs. Pressure.
ASTM sand is expensive so the project’s limited funding did not allow performing all the
tests with this sand. Five out of the eight blast tests performed used “washed play sand” with
brandname Quikrete n. 1113 that comes in 50-pound bags, purchased from a local vendor.
The density of the sand was not measured on-site but when the sand was poured in similar
conditions at SwRI, the density achieved was 1.50 g/cm3.
2.2 Quasistatic Tests
The Ottawa sand was tested in triaxial compression to find the compaction curves
(pressure vs. density) as well as the strength vs. hydrostatic pressure as a function of moisture
content. The results are summarized in Figure 1. Although mechanical tests were also
performed on wet sand, they are not summarized here because all blast tests were performed
with dry sand. The curves were implemented both in CTH and LS-DYNA models to compute
blast events.
2.3 High Strain-Rate Tests
The 10-mm length of the sand specimen was determined using LS-DYNA simulations to
ensure specimen equilibrium. Specimens were confined using a copper sleeve. Different
confinement pressures were achieved by varying the thickness of the sleeve.
The sand model (Equation of state and strength model) from the static tests shown above
was used for the numerical simulations of the dynamic tests and the results were compared
to the test data for the 0.4mm copper sleeve. The comparison of the transmitted signals is
presented in Figure 2a. The simulation shows a lower velocity transmitted signal in
comparison with the test. This may indicate rate dependency of the sand. A comparison of
the simulated Von-Misses stress in the sample compared to the calculated stress and strain
rate from the tests is presented in Figure 2b.
2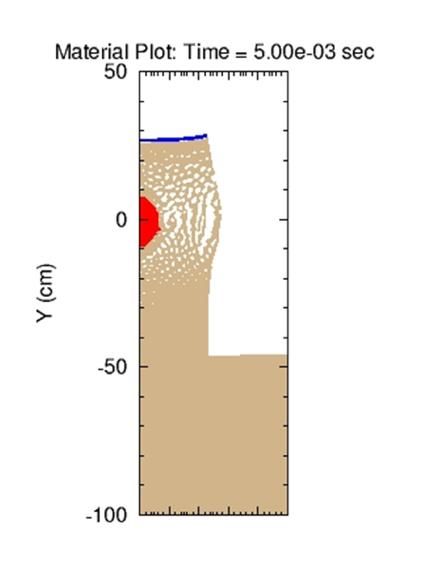
EPJ Web of Conferences 250, 02009 (2021) https://doi.org/10.1051/epjconf/202125002009
DYMAT 2021
Figure 2. Test comparison with simulations using quasistatic model a) Velocity vs. time, b) von Mises
stress vs. strain
The comparison shows lower stresses developing in the sand sample using the static
model. Figure 3 shows the test results and simulation for a very thick sleeve (5mm), i.e. rigid
confinement.
Figure 3. Test comparison with numerical calcs. using quasitatic model for rigid sleeve.
The simulation results using the quasistatic material model show again a lower velocity
transmitted signal than the test, indicating a possible rate dependency in the sand.
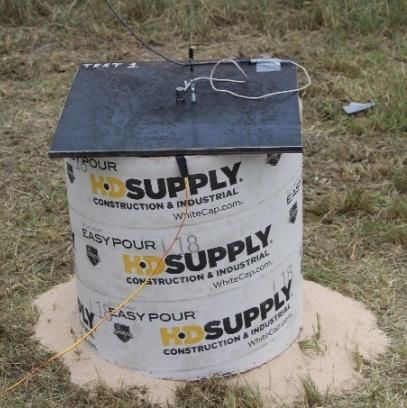
3 Summary of blast experiments and results
The tests consisted of the explosive loading of a steel plate placed onto the top of a sand pot
(Figure 4a), with a 100 gram C-4 explosive charge buried at different depths in the sand. The
steel plate behaved as rigid and had nominal dimensions of 45.7 cm×45.7 cm×1.27 cm (mass
of 20.5 kg). The main diagnostics were a high-speed video camera and a string potentiometer
attached to the plate. Accelerometers were also attached but data from the camera and string
pot were to provide reliable position vs. time data.
3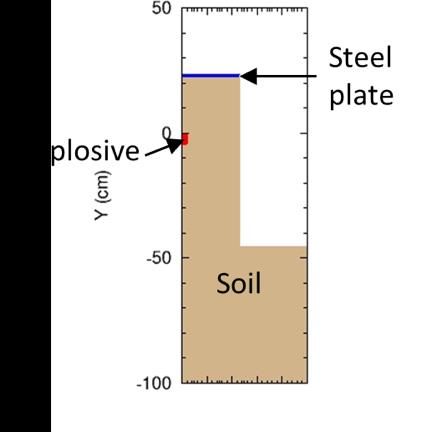
EPJ Web of Conferences 250, 02009 (2021)                           https://doi.org/10.1051/epjconf/202125002009
DYMAT 2021

          Figure 4b shows an example of the information provided by the diagnostics as well as by
      free-fall theory. The data obtained with the video camera are represented as the open squares,
      and the red continuous line is from the string potentiometer. They both match, although the
      string potentiometer “jumps” at the beginning of the blast due to the inertia of the device.
          The initial velocity imparted to the plate by the explosive was measured using the first
      frames from the event. The initial velocity was then used to predict the trajectory of the plate
      using free fall theory. Figure 4b shows that the predicted history matches well the camera
      and string pot data, i.e. provides additional validation of the data captured.

      Figure 4. a) Sand Pot with Steel Plate on Top. b) Data recorded during a test.
          Table 1 provides a summary of the test results for the jump height and initial plate
      velocities. The depth of burial (DOB) is measured to the center of the charge. The string pot
      jump is directly read from the string pot data. High-speed video (HSV) velocity is determined
      by fitting the initial slope of the HSV data to a free-fall theoretical equation. The “Theory
      Jump” columns uses the same equation and provides the maximum jump obtained with it.
      The three methods of estimating jump height provide similar answers. Only one test was
      performed with a DOB of 11.75 inches (29.8 cm) because the high-speed video clearly
      showed the lateral expansion of the sand was happening much earlier than impulse on the
      plate.
          Some of the tests were performed to be nominally identical to check for data scatter,
      which is a common issue when performing blast tests. Tests 3 and 4, with play sand, were
      both at DOB of 6.75 inches (17.1 cm) and identical. The jump height is 4.41 m for test 3 and
      4.5 m for test 4, i.e. the scatter is very small for this particular test (~2%). For the tests
      performed with the ASTM sand (number 5 and 7) at a DOB of 8.75 inches (22.2 cm), the
      jump height was, respectively, 2.83 m and 2.72 m, i.e. a scatter of ~4%. The largest scatter
      was seen when comparing tests 2 and 6, nominally identical sand and DOB of 8.75 in with a
      respective jump heigh of 2.09 m and 2.50 m. The scatter is ~16%, which is still acceptable
      and expected for this kind of tests.
          Finally, a comparison between the play sand and the ASTM sand is performed, even
      though only three tests were performed with the ASTM sand because of cost constraints. The
      average plate jump height for ASTM sand is systematically larger than for the play sand.
      Given than the ASTM sand is 4% denser than the play sand, it is expected to provide more
      momentum to the plate. It is interesting that the ratio stays somewhat consistent for the two
      DOBs tested. For a DOB of 6.75 inches, the jump with the ASTM sand is on average 24%
      larger than the play sand. For a DOB of 8.75 inches, it is 21% larger.

                                                        4
EPJ Web of Conferences 250, 02009 (2021) https://doi.org/10.1051/epjconf/202125002009
DYMAT 2021
Table 1. Test Results Summary
Test Sand DOB String Pot HSV Velocity HSV Jump Theory
No. Type (in//cm) Jump (m) (m/s) (m) Jump (m)
1 Play 11.75//29.8 1.27 5 1.16 1.27
2 Play 8.75//22.2 2.12 6.4 2.08 2.09
3 Play 6.75//17.1 NA 9.3 NA 4.41
4 Play 6.75//17.1 NA 9.4 NA 4.50
5 ASTM 8.75//22.2 2.93 7.5 2.82 2.83
6 Play 8.75//22.2 2.52 7 2.51 2.50
7 ASTM 8.75//22.2 2.71 7.3 2.71 2.72
8 ASTM 6.75//17.1 NA 10.4 NA 5.51
4 Computational methods
4.1 CTH COMPUTATIONS
4.1.1 Geometry and Mesh
The geometry of the blast tests was assumed to be 2D axisymmetric in the CTH simulations.
A 100 g C4 charge with a 4-cm diameter and 4.94-cm height was placed within a soil pot
with a diameter of 45.6 cm and length of 67.8 cm. An additional 55 cm of soil was placed
below the soil pot in the computations. Test data was obtained using the ASTM Ottawa sand
at two different depth of burials, 17.1 and 22.2 cm, so computations were performed for each
of these conditions. An example image of the initial material configuration is shown in
Figure 5. A mesh size of 5 mm was used in both the radial and axial directions.
Figure 5. a) CTH Material Setup (Initial Configuration) b) Pressure-Density relationship
implemented in CTH for Ottawa Sand
4.1.2 Material Models
Equivalent stresses measured from the soil compression tests can be plotted against the
corresponding pressures to obtain a pressure-dependent strength relationship. The maximum
equivalent stress from each Ottawa sand test is plotted against pressure in Figure 1b. A linear
relationship can be fit to the data. The slope and y-intercept of the best fit line can be input
as material constants for Drucker-Prager model in CTH. There is no evidence of the
5EPJ Web of Conferences 250, 02009 (2021) https://doi.org/10.1051/epjconf/202125002009
DYMAT 2021
equivalent stress-pressure relationship leveling off at the pressures tested, so the asymptotic
strength value was assumed to be very large (e.g. 1e30). In the absence of measurements, the
Poisson’s ratio was set to 0.364, while the melting temperature was set to 1740 K.
The equations of state for the soil materials can be defined using a pressure vs. density
relationship. CTH contains a FOAM equation of state that allows the relationship to be
defined in a piecewise manner using a table with pressure-density points. The relationships
used in the simulations are compared to the data from the various tests is in Figure 5b. The
initial and fully compressed densities of the Ottawa sand were defined as 1.764 and 2.6 g/cm3,
respectively. Load/unload tests were performed in CTH to insure proper implementation of
the material model. For this first set of blast simulations the strain-rate effects observed in
the materials section were ignored, but probably should be implemented in refined
computations.
The steel plate in the blast computations was simulated using the Johnson-Cook strength
model and a conventional equation of state. The detonation of the C4 explosive was simulated
using the Jones-Wilkins-Lee equation of state.
4.2 LS-DYNA COMPUTATIONS
4.2.1 Geometry and Meshes
The blast simulations were also performed in LS-DYNA. An arbitrary Lagrangian-Eulerian
(ALE) approach was used in these computations. The soil, explosive, and surrounding air
were all modeled using ALE multi-material elements, while the steel plate was modeled using
solid constant stress elements. The dimensions of the soil pot, explosive, and steel plate were
identical to those from the CTH simulations, but a 3D geometry with two planes of symmetry
were used instead of the 2D axisymmetric geometry from the CTH simulations.
4.2.2 Material Models
The LS-DYNA implementations of the soil models utilized the *MAT_PSEUDO_TENSOR
material model and the *EOS_TABULATED_COMPACTION equation of state. These
models allow for a material’s equivalent stress-pressure and pressure-volumetric strain
relationships to be defined, respectively, in a tabulated manner. Because volumetric strain is
directly related to a material’s density, the soil behavior can be defined in LS-DYNA in a
manner similar to that performed in CTH. The keywords used in the actual runs are included
in the Appendix.
Single element LS-DYNA simulations were used to confirm that the soil models behave
appropriately under both loading and unloading conditions. The single elements were
compressed and unloaded hydrostatically. As in CTH, the results indicate that the LS-DYNA
soil model was behaving as intended. Again, no strain-rate effects were incorporated in these
computations.
5 SIMULATION RESULTS AND COMPARISON TO EXPERIMENTS
5.1 CTH Computations
An example of how the material deforms in one of the CTH simulations is presented in Figure
6a. The blast launches the steel plate, shown in blue, vertically upwards. The momentum of
the plate in this direction can be queried as a function of time. The momentum eventually
6EPJ Web of Conferences 250, 02009 (2021) https://doi.org/10.1051/epjconf/202125002009
DYMAT 2021
reaches a steady-state value which is equal to the impulse imparted by the explosive and soil.
The values from the compuations are compared to the test measurements in Table 2.
Although the impulse values from the CTH simulations do not match the test data exactly,
they are close enough that the soil model is likely providing a reasonable approximation of
the material’s actual response.
Figure 6. a) Example CTH Results (22.2 cm depth of burial), b) Example LS-DYNA Results
(17.1 cm depth of burial).
Table 2. CTH Results Summary
DOB Test Impulse Sim Impulse Percent Diff.
(cm) (kg-m/s) (kg-m/s) (%)
17.1 212 195 -8.0
22.2 154 192 24.7
5.2 LS-DYNA
An example of how the ALE mesh deforms in the LS-DYNA blast simulations is presented
in Figure 6b. As with the CTH simulations, the vertical velocity of the plate reached a steady-
state value that was multiplied by the mass of the steel plate (×4 to account for the two planes
of symmetry) to determine the impulse imparted by the explosive and soil. Table 3 shows
how the LS-DYNA results compared to the test measurement. The LS-DYNA simulations
resulted in slightly more impulse than measured from the tests, but the results from the
simulations are still somewhat reasonable.
Table 3. LS-DYNA Results Summary
DOB Test Impulse Sim Impulse Percent Diff.
(cm) (kg-m/s) (kg-m/s) (%)
17.1 212 252 18.9
22.2 154 169 9.7
7EPJ Web of Conferences 250, 02009 (2021) https://doi.org/10.1051/epjconf/202125002009
DYMAT 2021
6 CONCLUSIONS
SwRI performed triaxial compression of the ASTM Ottawa and Yehu clay soils to obtain
pressure vs. density and strength vs. pressure curves. These curves were implemented as
material models in both CTH and LS-DYNA. Blast tests on a rigid steel plate were performed
using the ASTM sand and also local sand for two different explosive depths of burial. Impulse
predicted by the codes matched the experimental results within a 8 to 25% error.
References
1. Walker JD, Grosch DJ, Moore TZ, Grimm M, Chocron S. Statistical variations in blast loads from
buried explosives. In: Proceedings - 30th International Symposium on Ballistics, BALLISTICS
2017. 2017.
2. Anderson CE, Behner T, Weiss CE. Mine blast loading experiments. Int J Impact Eng [Internet].
2011 Aug [cited 2014 Dec 10];38(8–9):697–706. Available from:
http://linkinghub.elsevier.com/retrieve/pii/S0734743X11000662
3. Anderson Jr. C, Behner T, Weiss CE, Chocron S, Bigger RP. Mine Blast Loading: Experiments
and Simulations. 2010.
8You can also read