PSD-Based Features Extraction For EEG Signal During Typing Task - IOPscience
←
→
Page content transcription
If your browser does not render page correctly, please read the page content below

IOP Conference Series: Materials Science and Engineering

PAPER • OPEN ACCESS

PSD-Based Features Extraction For EEG Signal During Typing Task
To cite this article: Wei Bin Ng et al 2019 IOP Conf. Ser.: Mater. Sci. Eng. 557 012032

View the article online for updates and enhancements.

                                This content was downloaded from IP address 46.4.80.155 on 10/12/2020 at 18:25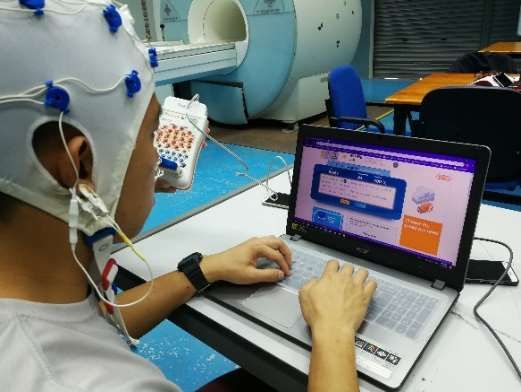
MEBSE 2018                                                                                 IOP Publishing
IOP Conf. Series: Materials Science and Engineering 557 (2019) 012032 doi:10.1088/1757-899X/557/1/012032

      PSD-Based Features Extraction For EEG Signal During
      Typing Task

                     Wei Bin Ng1, A Saidatul1, Chong Y.F1 and Z Ibrahim2
                     1
                        Biosignal Processing Research Group (BioSIM), School of Mechatronic Engineering, Universiti
                     Malaysia Perlis, Arau, Perlis, Malaysia
                      )DFXOW\RI7HFKQRORJ\8QLYHUVLW\RI6XQGHUODQG6W3HWHU V&DPSXV6XQGHUODQG65''

                     8QLWHG.LQJGRP

                         Abstract. Electroencephalograph (EEG) is an electrical field that generated by our brain
                         incessantly. The EEG signal released by the brain is different when a people is performing
                         different activities in their daily life. And such EEG signals consist complicated information that
                         can be interpreted. The aims of this study is to analyse the specific EEG channels of a user when
                         they are performing a typing task with laptop. Meanwhile, this research also aimed to verify the
                         performance of the different sub frequency band which is alpha and beta to recognize the
                         specified tasks. The frequency sampling was set at 1024 Hz and the impedance was kept below
                         5k ohm of each channels. The Truscan EEG (Deymed, Diagnostic, Czech Republic) device
                         consists of 19 channels and only selected channels which is F3 and F4 is filtered through
                         butterworth bandpass filter (1Hz-80Hz) in the pre-processing stage. Power Spectra Density was
                         calculated by using Welch and Burg Method to extract the features from filtered data. K-Nearest
                         Neighbour (KNN) classifier and Linear Discriminant Analysis (LDA) were used in
                         classification. It is found that the combination of channel F3 and F4 for Alpha frequency using
                         Welch method gives the highest accuracy which is 98.45%.

      1. Introduction
      Brain is an unique structure that is very essential to human being. The brain cells communicate to each
      other through electrical impulses and it can be measured by the electrode place on the human scalp. The
      EEG signals of a people is different when they are perform different kind of activity in life, and it is
      vary from one person to other person. In [1], the EEG is showing the different level of electrical activity
      in the different stage of sleep. Besides that, the anatomy of brain is also divided into 4 main lobes which
      is Frontal lobe, Temporal lobe, Parietal lobe and Occipital lobe and all these lobe are respective to
      different functions [2], [3].

             In this paper, the EEG signals of subjects are recorded during they are performing the typing
      tasks. Then, it is evaluated based on the use of different feature extraction method and classification.
      The structure of this paper is organized as few sections which are experiment protocol and methodology,
      result and discussion, and lastly the conclusion.

      2. Experiment Protocol and Methodology

      2.1. Data Set and Protocol
      Twenty subjects with right-handed and without mentally disorder or brain injury were enrolled from the
      undergraduates of UniMAP in this research. The Truscan EEG device that consists of 19 channels were

              Content from this work may be used under the terms of the Creative Commons Attribution 3.0 licence. Any further distribution
              of this work must maintain attribution to the author(s) and the title of the work, journal citation and DOI.
Published under licence by IOP Publishing Ltd                          1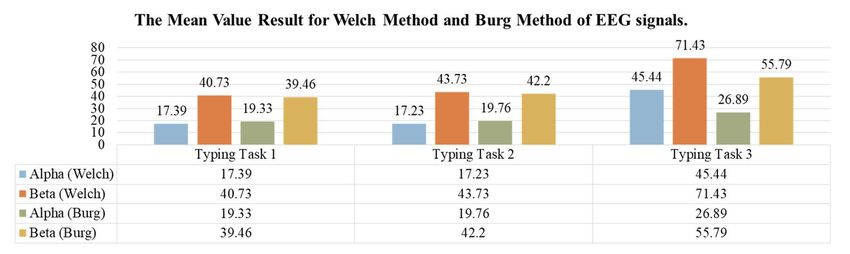
MEBSE 2018                                                                                 IOP Publishing
IOP Conf. Series: Materials Science and Engineering 557 (2019) 012032 doi:10.1088/1757-899X/557/1/012032

    used to collect the EEG signal of the subjects. The sampling rate during the data collection was set at
    1024 Hz and the sensitivity of the voltage was set at 70μV. The subjects were asked to perform the 3
    times of the typing task in this experiment. Figure 1 and Figure 2 show the photo during the data
    collection and the flow of the experiment. Then, EEG signal processing will be applied to extract most
    informative features from the raw data.

        Figure 1. Subject performing typing task.          Figure 2. The flowchart of experiment protocol.

    2.2. EEG Signal Processing
    The collected EEG signals were converted to the ASCII form which can be readable easily by the
    MATLAB software. Basically, the EEG signal processing consists of 3 stages which is pre-processing,
    feature extraction and classifier. In this research, the F3 and F4 channel is selected.

    2.2.1. Pre-processing
    The Butterworth bandpass filter was implemented during the pre-processing stage. The butterworth filter
    provides a response that is no ripple and maximally flat in the passband and stopband [4]. It provide
    good average transient characteristics and expense wide transition region from band pass to band stop
    thus enable a good compromise between amplitude response selectivity [5]. In fact, the collected EEG
    raw data consist of all frequency band such as Delta, theta, alpha, beta, and gamma. It is then pre-
    processing with the Butterworth bandpass filter to separate the signal accordingly. The frequency band
    chosen is the alpha which is 8 Hz to 13 Hz, beta that are from 13 Hz to 30 Hz. In this paper, the raw
    EEG signals from frontal channel F3 and F4 for typing task 1, typing task 2 and typing task 3 were
    extracted for EEG signal processing. The frontal channels F3 and F4 were selected because the frontal
    lobe of the brain is related with the voluntary action [2].

    2.2.2. Feature Extraction
    The power spectral density (PSD) was used as the feature extraction method in this study. PSD is a good
    tool for stationary signal processing and suitable for narrowband signal. It is a common signal processing
    technique that distributes the signal power over frequency and show the strength of the energy as
    function of frequency [6]. Under the PSD, the Welch method and Burg method were adopted in this
    study.

    A. Welch Method
    Welch method is a modified segmentation scheme and used to evaluate the average periodogram.
    Generally the Welch method of the PSD can be describe by the equations below, the power spectra
    density equation is defined first. Then Welch Power Spectrum that mean average of the periodogram
    for each interval is expressed.

                                     () =
                                                   ∑
                                                          ( ) ( )
                                                                                                          (1)

                                                         2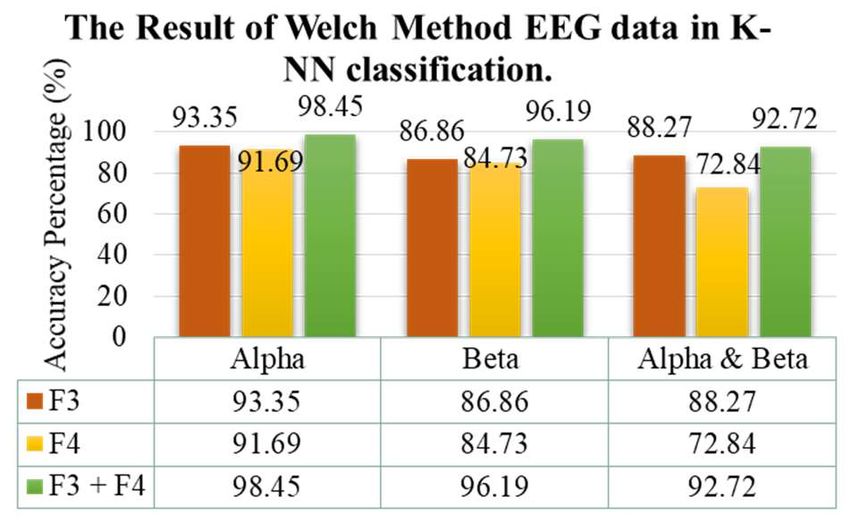
MEBSE 2018                                                                                 IOP Publishing
IOP Conf. Series: Materials Science and Engineering 557 (2019) 012032 doi:10.1088/1757-899X/557/1/012032


                                      () =        ∑
                                                            ()                                          (2)


    B. Burg Method
    Burg method is a method that diminishing the forward and backward prediction errors so it satisfy the
    Levinson-Durbin Recursion [7]. With higher order of Burg Model, the accuracy become lower, and false
    peaks will be inferred in the spectra. Which is that, the Burg method is highly suitable for short data
    records as it can generate accurate prediction and always produces a stable model [7]. Overall, the Burg
    method of PSD can be computed through following equation:
                                                                  #"
                                                                  !
                                      () =          "                     +                           (3)
                                                    $ ∑/01 %&" (') *+,-.

    2.2.3. Classifier

    a.   K-Nearest Neighbour (K-NN)

    K-Nearest Neighbour is known as non-parametric method and instant-learner because it does not make
    any assumptions on the input data and directly take the available data as training [8]. The principle of
    K-NN is classification through recognizing the nearby neighbour (data) by the mean of similarity or the
    distant between the distributed data [9]. The word “K” mean the number of the referred neighbour. K-
    NN is used by many researcher as its simplicity, fast, and able to achieve high recognition accuracy [9].

    b.   Linear Discriminant Analysis (LDA)

    It is a method to explain the distinctive nature of more than two classed of group by finding a linear
    combination of the extracted features [10], [11]. In the Linear Discriminant Analysis, it assumes that the
    conditional probability density functions of the classes are normally distributed with same covariance
    matrix [12]. The criteria of separability for class is done through the within-class and between-class
    scatter [13]. After that, the transformation of data is done to provide the definite boundaries to classify
    the data. The LDA draws the linear decision region between the given classes [14].

    3. Result and Discussion

             Figure 3.7KHPHDQYDOXHUHVXOWIRU:HOFKPHWKRGDQG%XUJ0HWKRGRI((*VLJQDOV

    The mean value obtain from after the feature extraction is displayed in Figure 3. After the
    feature extraction, the EEG signals exhibits a similar level in typing task 1 and typing task 2.
    However, a significant increase is observed in mean value of typing task 3.The value of beta is
    greater as the frequency band is domain to the human active state and motor movement. The Alpha
    frequency band exhibit the best accuracy 98.45% for classification in the combination of F3 and F4
    channels. The graph of performance for Welch Method EEG data is shown in Figure 4. Whereas for
    the Burg Method EEG

                                                              3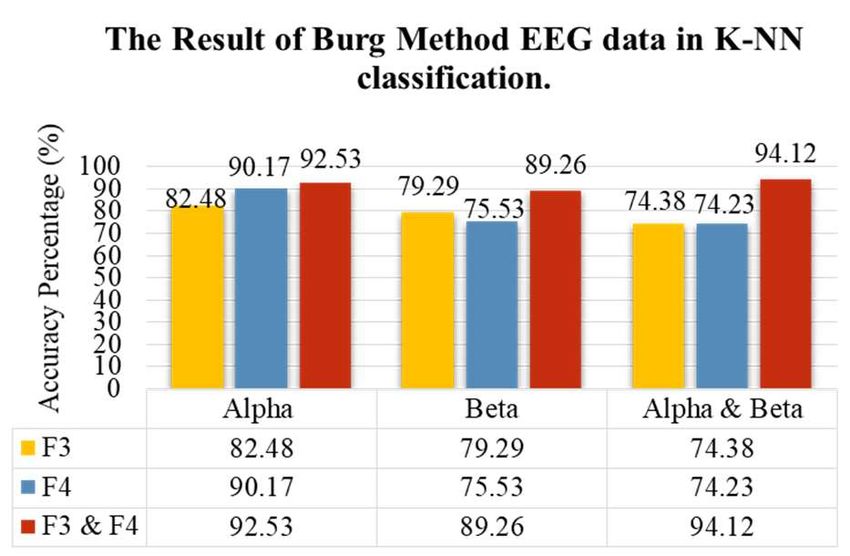
MEBSE 2018                                                                                 IOP Publishing
IOP Conf. Series: Materials Science and Engineering 557 (2019) 012032 doi:10.1088/1757-899X/557/1/012032

    data, the combination of the Alpha and Beta frequency band exhibit the best accuracy 94.12% for
    classification in the combination of F3 and F4 channels as shown in Figure 5 below.

           In an overview, the classification of the signal is better when combination of channels F3 and F4
    is used. The Welch method feature extraction is suitable use for classification because it give higher in
    percentage in general. Meanwhile, the LDA classification has been carried out. However, the obtained
    result isn’t as good as the K-NN classification. It can be said that the classifier LDA is generally not
    good with few category variables though it performs very well with linear data [15]. A summary of the
    result is shown in the Table 1. Based on the Table 1, it can be shown that highest result is 98.45% by
    the combination of F3 and F4 channels in the Welch Method Alpha frequency Band in K-NN classifier.
    While the highest result of Burg Method EEG data in K-NN classifier is 94.12% by the combination of
    F3 and F4 channels for combination of Alpha and Beta frequency Band.

      Figure 4. Result of Welch Method EEG data.            Figure 5. Result of Burg Method EEG data.

          Table 1. Classification result for Welch method and Burg method EEG signals.

                Frequency Band                   Channel               KNN                    LDA
                 Alpha (Welch)                      F3                 93.35                  52.16
                                                    F4                 91.69                  45.58
                                                 F3 & F4               98.45                  37.26
                  Beta (Welch)                      F3                 86.86                  53.37
                                                    F4                 84.73                  50.01
                                                 F3 & F4               96.19                  34.18
            Alpha & Beta (Welch)                   F3                  88.27                  57.81
                                                    F4                 72.84                  36.83
                                                 F3 & F4               92.72                  31.07
                  Alpha (Burg)                      F3                 82.48                  44.77
                                                    F4                 90.17                  49.06
                                                 F3 & F4               92.53                  51.49
                    Beta (Burg)                     F3                 79.29                  44.59
                                                    F4                 75.53                  50.67
                                                 F3 & F4               89.26                  53.21
             Alpha & Beta (Burg)                    F3                 74.38                  47.81
                                                    F4                 74.23                  46.35
                                                 F3 & F4               94.12                  30.08

    4. Conclusion

    In this study, the PSD is used as feature extraction and the Welch method and Burg method is used. The
    average value in the first time user and second time user is low and almost similar. However, it is

                                                        4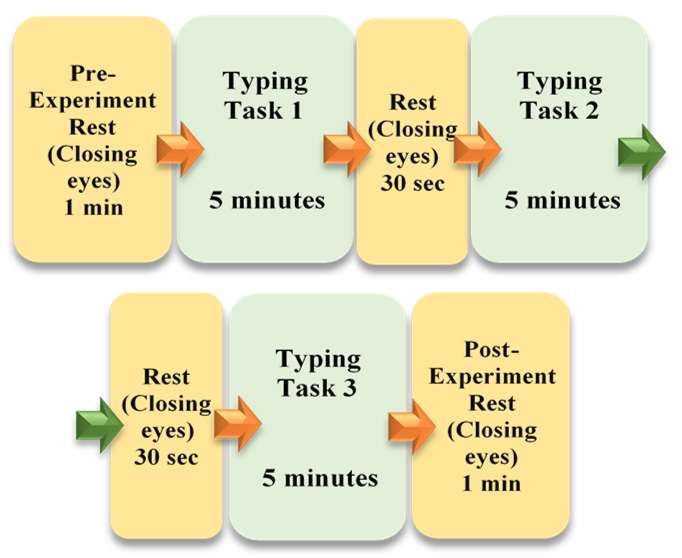
MEBSE 2018                                                                                 IOP Publishing
IOP Conf. Series: Materials Science and Engineering 557 (2019) 012032 doi:10.1088/1757-899X/557/1/012032

    observed that the average mean value has been lifted significantly in third time repeated user. In general,
    the combination of both frontal channels F3 and F4 give better result in KNN classification. The highest
    accuracy can go up to 98.45% for the combination of F3 and F4 channels in the alpha frequency band.
    The Welch method feature extraction is more suitable as it can give better classification result than Burg
    method in this case. For the performance of sub frequency band, the combination of Alpha and Beta
    frequency band exhibit better result in the Burg Method feature extraction in K-NN classifier than single
    frequency band is used.

    Acknowledgments
    We would like to thank Universiti Malaysia Perlis (UniMAP) for supporting our research works.

    References
    [1]   Larry R.Squire, Floyd E. Bloom, Nicholas C. Spitzer, Sascha du Lac, Anirvan Ghosh, and
          Darwin Berg, Fundamental Neuroscience Third Edition, 3rd ed. ELSEVIER, 2008.
    [2]   Maris A Patestas and Leslie P. Gartner, A Textbook of Neuroanatomy. Blackwell Publising Ltd,
          2006.
    [3]   L.-E. Notevarp Bjørge and T. Hübertz Emaus, “Identification of EEG-based signature produced
          by visual exposure to the primary colors RGB,” no. July, 2017.
    [4]   K. A. I. Aboalayon, W. S. Almuhammadi, and M. Faezipour, “A comparison of different
          machine learning algorithms using single channel EEG signal for classifying human sleep
          stages,” in 2015 Long Island Systems, Applications and Technology, 2015, pp. 1–6.
    [5]   M. Lewandowski and J. Walczak, “Comparison of single-level and multi-level filtering systems
          of EEG signal,” in 2015 Signal Processing: Algorithms, Architectures, Arrangements, and
          Applications (SPA), 2015, pp. 34–37.
    [6]   Z. Y. Ong and Z. Ibrahim, “Power Spectral Density Analysis for Human EEG- based Biometric
          Identification,” in 2018 International Conference on Computational Approach in Smart Systems
          Design and Applications (ICASSDA), 2018, pp. 1–6.
    [7]   A. Saidatul, M. P. Paulraj, S. Yaacob, and M. A. Yusnita, “Analysis of EEG signals during
          relaxation and mental stress condition using AR modeling techniques,” Proc. - 2011 IEEE Int.
          Conf. Control Syst. Comput. Eng. ICCSCE 2011, pp. 477–481, 2011.
    [8]   M. Manjusha and R. Harikumar, “Performance analysis of KNN classifier and K-means
          clustering for robust classification of epilepsy from EEG signals,” in 2016 International
          Conference on Wireless Communications, Signal Processing and Networking (WiSPNET), 2016,
          pp. 2412–2416.
    [9]   R. M. Isa et al., “EEG brainwave behaviour due to RF Exposure using kNN classification,” in
          2013 IEEE 3rd International Conference on System Engineering and Technology, 2013, pp.
          385–388.
    [10] J. Ye and Q. Li, “A two-stage linear discriminant analysis via QR-decomposition,” IEEE Trans.
          Pattern Anal. Mach. Intell., 2005.
    [11] R. Masoomi and A. Khadem, “Enhancing LDA-based discrimination of left and right hand motor
          imagery: Outperforming the winner of BCI Competition II,” in 2015 2nd International
          Conference on Knowledge-Based Engineering and Innovation (KBEI), 2015, pp. 392–398.
    [12] S. Yang and F. Deravi, “On the Usability of Electroencephalographic Signals for Biometric
          Recognition: A Survey,” IEEE Trans. Human-Machine Syst., vol. 47, no. 6, pp. 958–969, 2017.
    [13] S. Balakrishnama and a Ganapathiraju, “Linear Discriminant Analysis - a Brief Tutorial,”
          Compute, 1998.
    [14] A. Ishfaque, A. J. Awan, N. Rashid, and J. Iqbal, “Evaluation of ANN, LDA and Decision trees
          for EEG based Brain Computer Interface,” in ICET 2013 - 2013 IEEE 9th International
          Conference on Emerging Technologies, 2013.
    [15] A. Bhardwaj, A. Gupta, P. Jain, A. Rani, and J. Yadav, “Classification of human emotions from
          EEG signals using SVM and LDA Classifiers,” in 2015 2nd International Conference on Signal
          Processing and Integrated Networks (SPIN), 2015, pp. 180–185.

                                                         5
You can also read