Exploiting ensemble members: forecaster-driven EPS applications at the met office
←
→
Page content transcription
If your browser does not render page correctly, please read the page content below
Exploiting ensemble members:
     forecaster-driven EPS applications
     at the met office

Introduction
Ensemble Prediction Systems (EPSs) have assumed a central role in the forecast process in recent
years. The challenge is to allow forecasters to exploit fully the rapidly growing quantity of EPS data
within the timescales of an operational environment.

As part of an ongoing review of usage of NWP products within the Met Office, new presentational tech-
niques and automated analysis methods are being developed for use with model data. There is also a
need to rationalise and unify EPS products used in the Met Office, thus simplifying usage and empower-
ing the forecaster and other customers.

Uses of ECMWF data
Operations Centre Forecasters routinely access standard ECMWF EPS products such as ‘postage
stamps’ and the Extreme Forecast Index (EFI) via the ECMWF website. Additionally, forecasters may
make use of the ‘in-house’ suite of ensemble products derived from raw ECMWF data (accessed via a
system known as PREVIN). Products from PREVIN include alternative clustering methods,
meteograms, and a wide-range of probability charts for specific weather events affecting the UK. For
example, an invaluable element of PREVIN is the First Guess Early Warning (FGEW) system, which
uses the ECMWF EPS to automatically alert forecasters of upcoming potentially severe weather affect-
ing the UK.

MOGREPS
In the last year, extensive trials have taken place using an EPS developed within the Met Office, known
as MOGREPS (Met Office Global and Regional Ensemble Prediction System). MOGREPS uses an
Ensemble Transform Kalman Filter (ETKF) to generate perturbations in initial conditions. Model
physics perturbations are also introduced via random variation over time of key parameters within each
EPS member.

                         MOGREPS-G                    MOGREPS-R
 Model                   UM6.1 (G38)                  UM6.1 (E11)
 Resolution              N144 (90km), 38 levels       24km, 38 levels
 Run Times               00 and 12 UTC                06 and 18 UTC
 Run Length              72 hrs                       54 hrs
 Availability Times      07:30 and 19:30 UTC          13:00 and 01:00 UTC           Table 1:
 Ensemble Size           24 (CNTRL+23 perturbed)      24 (CNTRL+23 perturbed)       MOGREPS
                                                                                    configurations

                                                                             The European Forecaster   23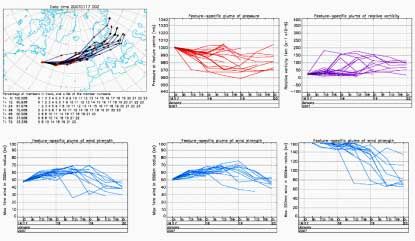
MOGREPS runs in two main configurations (Table 1) based on the Met Office Global (GM) and North
Atlantic & European (NAE) model domains respectively. An additional version of MOGREPS-G is run
out to 15-days at ECMWF as a component of the THORPEX multi-model ensemble, TIGGE.

A wide variety of products are routinely generated using the MOGREPS output. As with PREVIN, these
are accessed via the Met Office intranet. The website makes full use of web technology developed since
PREVIN was originally implemented, displaying clickable and animated sequences of each EPS
member, or products derived from them such as event probabilities and clusters.

Close liaison between forecasters and developers has resulted in a system with a high degree of flexibi-
lity: certain products or combinations of model fields have been requested depending on the synoptic
situation, and developers can respond quickly to these requests. More formally, forecasters have been
asked to evaluate the usefulness of each MOGREPS product via questionnaires, enabling developers to
ascertain product priorities and to alter product generation schedules accordingly. Further surveys will
be conducted, and continuous feedback encouraged, until an optimum set of forecast products is
achieved.

New EPS applications
The Cyclone Database

PREVIN includes facilities for the tracking of extra-tropical cyclones based on matching and tracking
MSLP minima. However these systems are often of limited use in identifying and tracking the precur-
sors of cyclogenesis, prior to formation of well-defined low centres.

The Met Office Cyclone Database, CDB, (Hewson, 2007) has been running in real time on UK Global
Model data for several years. This attempts to identify and display features using automated, objective
techniques based on standard conceptual models of fronts and of cyclone development (Figure 1).

Having identified objective features at a given time, an attempt can be made to automatically identify
the same features at later times. An important aspect of this tracking scheme is the consideration that
an object may evolve into another type of object. For this type of transition, the probabilities have been
derived empirically from historical data. Hence, for example, the natural development of a minor baro-
clinic feature into a frontal wave and finally a barotropic low can be tracked throughout its lifecycle
using this system.

                                                                       This formulation proves to be an
                                                                       excellent means of analysing
                                                                       large EPS datasets. The
                                                                       MOGREPS version of the CDB
                                                                       (adapted for THORPEX by Helen
                                                                       Watkin, Met Office) matches
                                                                       features in the MOGREPS-G
                                                                       CNTRL member at T+0 with the
                                                                       other ensemble members. Once
                                                                       common objects are identified,
                                                                       their tracks can be plotted, along
                                                                       with various other useful proper-
                                                                       ties such as minimum MSLP and
                                                                       maximum wind at certain heights
                                                                       (Figure 2). Tracking plots for
Figure 1: Example CDB analysis of UKMO Global Model T+0.               each object are displayed by
Labelled features are Diminutive Waves (Green), Frontal Waves          clicking on the appropriate
(Amber), and Barotropic Lows (Black) along with Warm (Red) and         object in the T+0 CNTRL analysis
Cold (Blue) Fronts.                                                    (as in Figure 1).

 24 The European Forecaster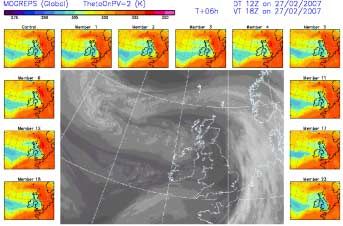
Figure 2: MOGREPS CDB plumes displayed by clicking on a given object identified in the
CNTRL member at T+0
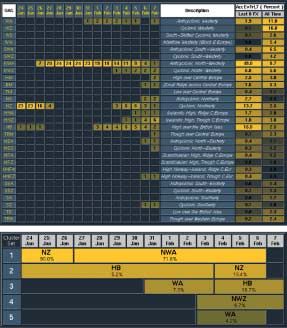
Objective-GWL: Synoptic Regime Analysis
As part of the THORPEX project, Paul James (of the Met Office’s Hadley Centre) has developed applica-
tions to classify EPS members by synoptic type. Members of a MOGREPS-THORPEX dataset on a given
day are clustered according to Grosswetterlagen (GWL) synoptic types over northwest Europe. The
results are displayed in order to indicate quickly to the forecaster the dominant regimes in the medium-
range period (see Figure 3 and
Figure 4).
The analysis can also be
performed on either ECMWF or
GFS ensemble data. Additionally,
the data can also be classified by
Lamb Synoptic Type, which is
perhaps more familiar to UK fore-
casters.
Figure 3: MOGREPS-THORPEX
Objective-GWL output
displaying the number of EPS
members of each GWL
synoptic type on a given day.
Figure 4: Objective GWL clustering.
Cluster 1 represents the most
probable GWL regime sequence.
Cluster 2 is the next most probable
sequence, having removed
the first set of regimes, and so on.
The European Forecaster 25These products have recently become widely used by the Medium Range forecasters in the Met Office. In the past, forecasters have derived similar results subjectively, usually by inspection ‘by eye’ of EPS ‘postage stamps’. Anecdotal evidence already suggests that such automated output is extremely useful, and is already saving considerable time and effort. Future Projects Though ensembles are in continuous use by forecasters, the recent survey of their usage has highlighted a need for consistent methodology and for standard working practices. At present, each forecaster relies on the particular products with which they have become familiar, and the very large amount of data available can make it difficult to assimilate additional information on the timescales required operationally. The amount of available EPS data has increased substantially in recent years. Clearly it is advantageous to have access to a wide range of products, and also a range of different models, each with known character- istics. However, this profusion of data from different sources (often in different formats and available at different times) makes objective and quantitative comparison difficult for the operational forecaster. At present, much of this evaluation is made subjectively after examination of a combination of screen- displayed and printed charts. It is hoped that, by developing standardised products and procedures, the comparison of data may be made more rigourous and more objective, and considerable time and effort can be saved during the forecast process. There is already work underway within the Met Office to attempt to standardise the presentation of ‘in-house’ EPS output: PREVIN products are soon to be accessed via the MOGREPS webpages and displayed in a similar format. New products, such as those described above, show the merits of developing automated analysis and comparison techniques, and will be absorbed by the unified display system. In addition, EPS products will be incorporated into the new Met Office forecaster workstation, SWIFT, further enabling detailed analysis of Ensemble data. Having established standardised display formats, the next logical step is to enable quantitative comparison between the different models themselves. For example, the behaviour of an EPS relative to its ‘parent’ deterministic model can be an important indicator of forecast confidence if correctly interpreted. Work at ECMWF (the ‘Combined Prediction System’) suggests that statistically, the ECMWF operational determinis- tic model has very high average weighting at short lead-times, if considered as a member of its own ensem- ble. It is expected that these results can be generalised, enabling forecasters to quantitatively assess the most probable solution via comparison of all the models. Some PREVIN and MOGREPS products (such as meteograms) are generated on demand, and as comput- ing power increases, it is anticipated that many other EPS products may be created in this way. The devel- opment of an interactive EPS system would also allow the forecaster to specify key parameters for various analysis techniques. At present, the full power of clustering is rarely demonstrated. However, by letting the forecaster specify the domain, time and fields over which to cluster the data according to the synoptic situ- ation, a powerful tool could be generated. This flexibility is far more important than the actual clustering methods used, which can be made as simple as possible in order to minimise computing time. Best member selection A standard method of model verification is by subjective comparison of appropriate fields with observa- tional data, most notably with IR or WV satellite imagery. Evaluation of a model’s handling of upstream features at, say, T+6 (see Fig 5) provides a key measure of confidence in its later performance. We can also use this idea to assess performance of each EPS member, thus identifying the current ‘Best’ and ‘Worst’ performers in the ensemble. As with the products above, it is essential to automate the process of comparison in order to examine the large EPS datasets on operational timescales. Comparison techniques in this case will be similar to those used in the CDB matching algorithms. 26 The European Forecaster
Initial efforts will focus on identifying ‘Worst Members’ – poor performers – which may be discarded
from the ensemble. This is a much simpler process, as often model deviations from reality are clear
from comparison of single model fields with imagery. The Best Member could then be obtained by
process of elimination, or a set of updated probabilities could be calculated based on the remaining
members. Though lacking the statistical rigour of the probabilities derived from the full sample, these
recalculated probabilities would help forecasters assess weightings of particular members or clusters
given recent observations.

                                                                                 Figure 5:
                                                                                 Example comparison
                                                                                 between MSG WV
                                                                                 imagery and
                                                                                 MOGREPS fields.
                                                                                 Comparison can
                                                                                 be automated,
                                                                                 and used in Best/Worst
                                                                                 Member
                                                                                 selection scheme.

In the future, it is anticipated that the configuration (eg. resolution and physics schemes) of EPS
members will be equivalent to their ‘deterministic’ parent model. This may open up a scenario whereby
a Best Member could be chosen to drive products further down the forecast chain if deemed likely to
perform better than the parent model run. This option is being considered as an alternative to complex
field modification techniques that are currently being used when larger-scale errors are anticipated in
the parent model run.

Summary
The proliferation of EPS data requires that new presentation and analysis techniques are developed in
order to keep full data comparison viable on operational timescales.

The Met Office is moving to standardise its EPS output as new ensemble products become operational.

It is hoped that these developments will be the first steps towards a unified and interactive system for
quantitative comparison between observations and both EPS and deterministic model data. This will
allow EPS data to play an increasingly pivotal role in the everyday forecast process.

References

Hewson, T. 2007. "Objective Identification of Cyclonic Features, from Initiation Through to Decay". To
be submitted to Meteorological Applications.

                                                                                             Will Lang
                                                                           Operations Centre-Met Office

                                                                              The European Forecaster   27
You can also read