Permafrost monitoring at Mölltaler Glacier and Magnetköpfl
←
→
Page content transcription
If your browser does not render page correctly, please read the page content below
Berichte Geol. B.-A., 93, ISSN 1017‐8880 – Applications in CO2 Monitoring

          Permafrost monitoring at Mölltaler Glacier and
                         Magnetköpfl

             DAVID OTTOWITZ1, BIRGIT JOCHUM1, ROBERT SUPPER1, ALEXANDER RÖMER1,
                         STEFAN PFEILER1 and MARKUS KEUSCHNIG2, 3

1
  Department of Geophysics, Geological Survey of Austria, Neulinggasse 38, 1030 Wien.
2
  University of Salzburg / Department of Geography and Geology / Research Group
Geomorphology and Environmental Systems.
3
  AlpS - Centre for Climate Change Adaptation Technologies, Innsbruck, Austria.

david.ottowitz@geologie.ac.at

Introduction
Changes of climate parameters due to global warming generate increased permafrost warming
and deglaciation in alpine regions. These processes are mainly responsible for an increasing rock
fall activity and decreasing slope stability in these areas. Consequently permafrost thawing will
produce serious environmental and engineering problems, which can also affect regions below
the permafrost (e.g. large rock falls). As details about the underlying processes are still not fully
understood it seems to be an interesting field of research. Especially geoelectric monitoring could
be a promising method to analyse melting and freezing processes of the shallow subsurface and
the status of the permafrost at deeper areas, because of the large resistivity contrast between
frozen and melted soil or rock.
The application of the geoelectric method for permafrost investigations is reported by many
authors, e.g. HAUCK, 2002; HAUCK and VONDER MÜHLL, 2003; KNEISEL, 2004; MARESCOT et al., 2003.
The activities in permafrost regions of the Department of Geophysics of the Geological Survey of
Austria started in the year 2006 with the installation of a first geoelectric test profile equipped
with the GEOMON4D (SUPPER and RÖMER, 2003) on the summit of the Sonnblick Mountain (3106 m
a.m.s.l.). The very special conditions at this location lead to several problems in data acquisition
which result in a discontinuous data set. Additionally the quality of the collected data was
unsatisfying due to the impact of various steel installations in the summit area of the mountain.
Nevertheless the gain in experience for the operation of a monitoring system at these high alpine
conditions was invaluable. All further improvements of the monitoring system for permafrost
measurements are based on this knowledge.

Technological developments
The resistivity of frozen soil can reach values of several hundred kOhmm. Commercial geoelectric
systems and also our GEOMON4D system are not constructed to deal with these high resistivities.
The main problem is the unrestricted current injection which leads to potential differences that
are out of the system range (+/- 10 V for the GEOMON4D system). Theoretical calculations of the
potential difference for a specific injection current in a high resistivity environment
(homogeneous halfspace) using a simple Wenner configuration show the importance of the input
current reduction. Fig. 1 shows calculated potential differences related to subsurface resistivity
for a constant input current of 10 mA.

                                                 57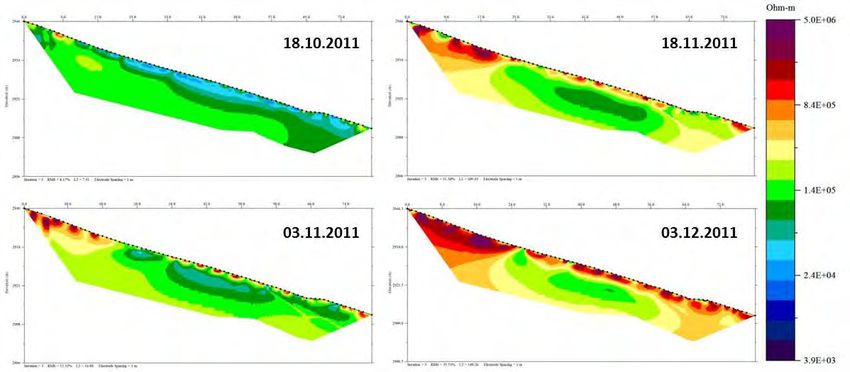
Berichte Geol. B.-A., 93, ISSN 1017‐8880 – Applications in CO2 Monitoring

Fig. 1: Theoretical calculation of potential differences for a constant input current using a Wenner
configuration with different electrode spacing.

The purple line represents the maximum input voltage of our monitoring system so that the
intersection with the calculated potential differences defines the highest subsurface resistivity at
which a reliable measurement can be achieved. Fig. 1 shows clearly that with the given input
current, which is already quite low, it could be even for the largest considered electrode spacing
difficult to perform measurements at permafrost conditions, where we expect resistivities higher
than 50 kΩm. Based on these theoretical considerations we adapted the power supply of the
GEOMON4D to this special demand, changing it from a constant output voltage (48 – 391 V for
common applications) to a constant output current (2 – 20 mA) balanced at a level which takes
into account the maximum input voltage of +/- 10 V. This adaption ensures reliable
measurements at subsurface resistivities up to several hundred kOhmm. Although it is a feasible
solution to force the potential differences within the measuring range of the system, it should be
considered to enlarge this range in future to improve the data quality, which is in most cases
directly dependent on the amount of injected current.
Our experience from the test measurements on the Sonnblick showed that it is essential to use a
lightning protection to fuse the device from overvoltage occurring along the monitoring profile.
The sources for the appearance of this overvoltage are still not completely clear but the fact that
damages to the system occurred especially during summertime indicates a clear correlation to
thunderstorms. The used lightning protection cannot resist voltages which would occur in the
very unlikely case of direct lightning strike to the monitoring profile, but it is very effective for the
more likely case of a lightning event in the surrounding area with corresponding high potential
differences in the subsurface. However, the implementation of the lightning protection results in
clear reduction of maintenance work involving damages of electronic components of the device.
The areas of interest for permafrost monitoring are placed in high alpine areas, so in most cases
there is no connection to the power grid. Even though we had this opportunity at the test site on

                                                   58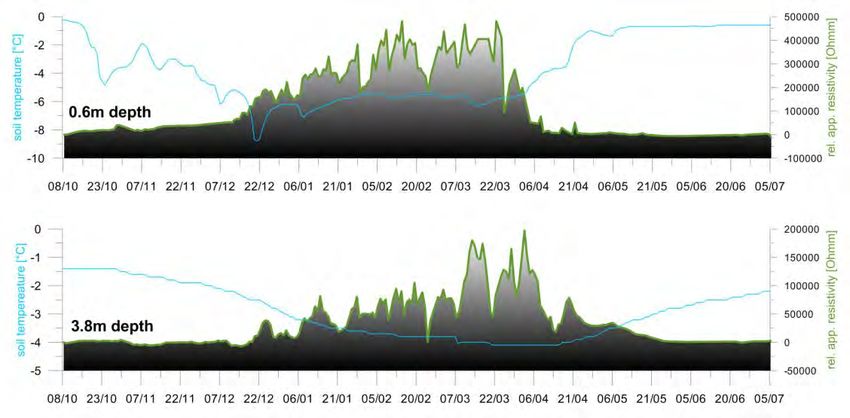
Berichte Geol. B.-A., 93, ISSN 1017‐8880 – Applications in CO2 Monitoring

the Sonnblick (connection to the power grid of the meteorological observatory) it turned out as a
disadvantage, because the measurements were disturbed by various installations in the
surrounding of the building. Consequently it is necessary to use an independent power supply.
We solved this problem with a fuel cell system (Fig. 2), consisting of the fuel cell SFC Efoy Pro©
600 with a charging capacity of 600 Wh/day and a current of 1 A, which is connected to 72 Ah
batteries. The system includes two methanol canisters with a total capacity of 56 l and a GSM
modem for remote control.

                         Methanol canisters

            GSM modem
                                       Batteries
                                       (below
                                       the plate)

                           Fuel cell

Fig. 2: The used fuel cell system.

Our experience at the monitoring site Mölltaler Glacier (2750 m a.m.s.l.) showed that it is very
reliable even at extreme conditions during wintertime. The low fuel consumption (depending on
the measurement activity and temperature conditions) allowed a maintenance free operation for
about 8 months.

Monitoring site Mölltaler Glacier
This monitoring site is placed within the Mölltaller Glacier skiing area (Carinthia) on a plateau at
an altitude of about 2750 m a.m.s.l. close to the mountain station of the “Eissee” cable car (see
Fig. 3). There were several reasons why we chose this area for our investigations. First of all it is
very easy accessible due to the well-developed infrastructure of the skiing area and secondly it is
near to the Sonnblick mountain (about 5 km linear distance), where we have access to soil
temperature data.

                                                    59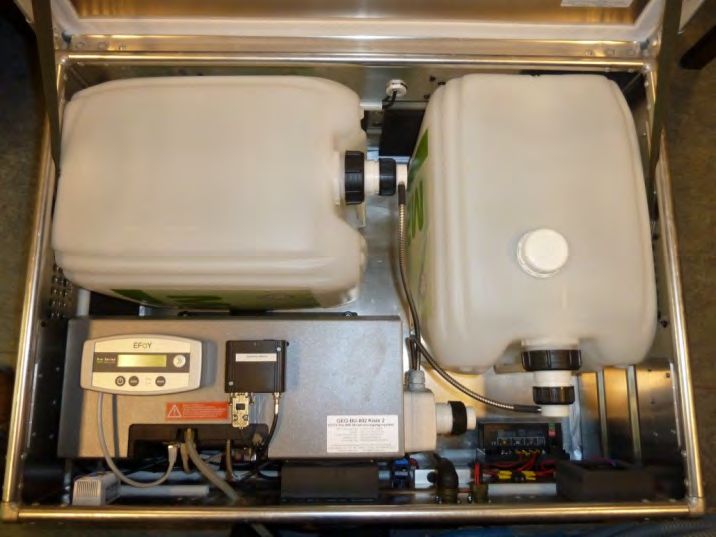
Berichte Geol. B.-A., 93, ISSN 1017‐8880 – Applications in CO2 Monitoring

                                           Fig. 3: Location of the monitoring site (indicated by a red circle).

The geoelectric profile was installed in NW – SE direction and it was equipped with the adapted
GEOMON4D powered by a fuel cell system (see previous section). The profile consists of 81
electrodes with a spacing of 1 m. The maximum depth of investigation for this configuration is
about 15 m. The system started its operation on the 28th of September 2010. The measurement, a
gradient array containing 2590 data points, is executed automatically once a day and the data is
sent the following day by e-mail to the office in Vienna. The data processing which is partly
performed automatically is split in two different parts. The output of the first part is a large
number of apparent resistivity time series of different electrode combinations. This data is plotted
and compared to the soil temperature data from the Sonnblick observatory. The second part of
the data processing consists of the data inversion and produces 2D resistivity models of the
subsurface.
Fig. 4 shows two examples for the comparison between time series of soil temperature and
relative apparent resistivity for electrode combinations which are related to different depths of
penetration.

Fig. 4: Comparison between relative apparent resistivity and soil temperature for two different depths.

                                                    60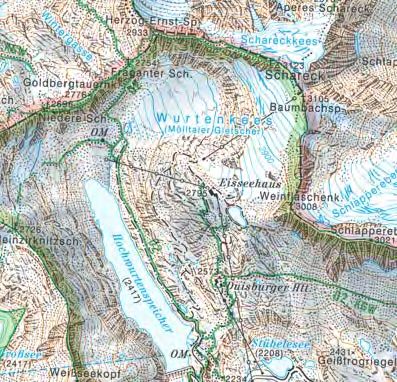
Berichte Geol. B.-A., 93, ISSN 1017‐8880 – Applications in CO2 Monitoring
In both examples there is a clear correlation between low soil temperatures and very high
apparent resistivities. Apart from the fact that we have different ranges of soil temperature at
these two depths there is a clear time shift in areas with lowest temperatures and highest
resistivities as well. This is caused by the behaviour of the temperature wave travelling through
the subsurface. Although this example shows a nice correlation between soil temperature and
apparent resistivity the interpretation has to stay on a quantitative level, because of the strong
dependence of soil temperature on local conditions (e.g. lithology, slope position and angle,
elevation). This shows the importance that additional measurements (especially soil temperature)
should be performed on site, to enable a detailed and verified interpretation of geoelectric data.
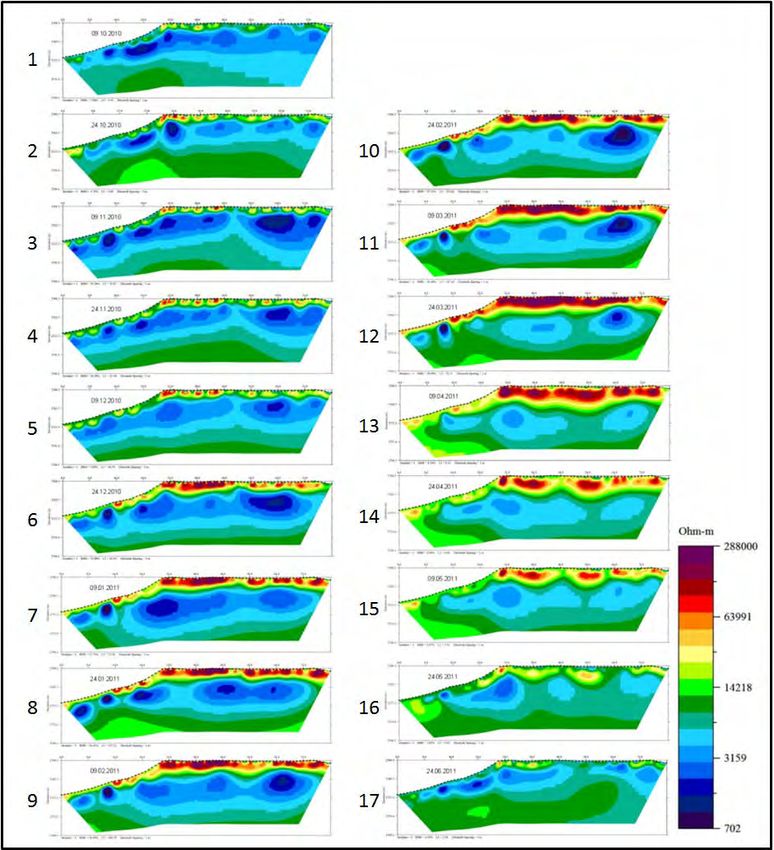
Fig. 5 shows inversion results calculated with the AGI Earthimager 2D software of the whole
monitoring period. It starts with the 9th of October 2010 and ends with the inversion result of the
24th of June 2011 with an interval of about 15 days.
The shallow part of the subsurface (the first 3 m) shows strong temporal changes of the resistivity.
This behaviour is correlated with the freezing and melting process of the topmost layer. A
continuous increase of resistivity in this part is seen for the results 1-12. Result 12 which
corresponds to the end of March shows the largest extension of the high resistivity (frozen) zone.
In result 13 (9th of April) there is already a decrease of resistivity (especially on the surface) visible.
The following resistivity models illustrate the melting process till the end of June. At this time we
reach more or less the initial resistivity distribution in the shallow part of the subsurface (9th of
October 2010).
At deeper parts of the depth section hardly any resistivity changes took place and due to the
relatively low values of 1000 to 15000 Ωm we conclude that there is no indication for permafrost
at this location. This could be explained by the fact that our profile is placed on a southwest facing
slope, where permafrost is very unlikely at this altitude.
61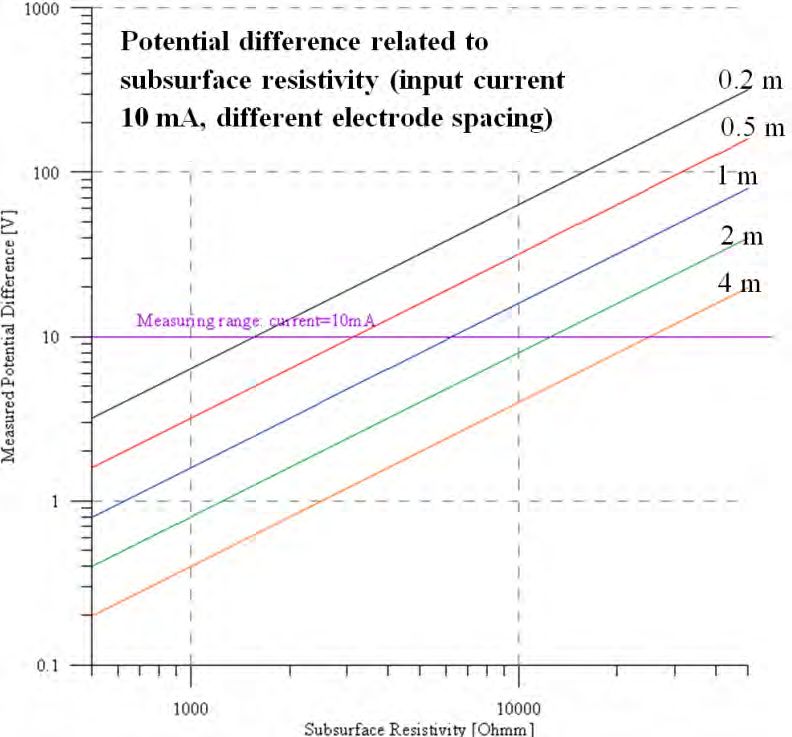
Berichte Geol. B.-A., 93, ISSN 1017‐8880 – Applications in CO2 Monitoring

Fig. 5: Selected inversion results covering the whole monitoring period.

Altogether the operation of the monitoring system was very successful and we produced a high
quality geoelectric dataset for almost a whole seasonal period. As there was no expectation for
new information if we continue our measurements at this location, we decided to search for a
new monitoring site where additional measurements (e.g. soil temperature) should be available
on site.

Monitoring site Magnetköpfl
This monitoring site where our measurements started in October 2011 is placed on the
Magnetköpfl (2957 m a.m.s.l.) which is a peak below the Kitzsteinhorn (Salzburg). A major
advantage of this location is the availability of additional data (e.g. soil temperature, ERT), which
is collected in the framework of the MOREXPERT project (alpS – Centre for Climate Change
Adaptation Technologies, Innsbruck, Austria). In addition to several measuring points of near
surface rock temperature in the surrounding area we have also two measuring points (near

                                                     62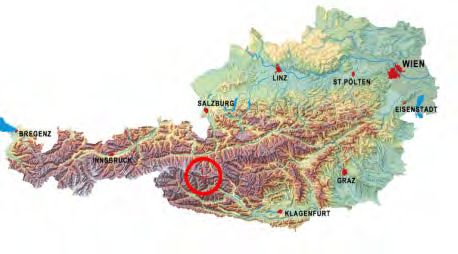
Berichte Geol. B.-A., 93, ISSN 1017‐8880 – Applications in CO2 Monitoring

surface rock temperature) directly on the geoelectric profile. Soil temperature data from two
boreholes (30 m depth) is also available. We used the same monitoring system as on the Mölltaler
Glacier working with same settings. As the investigations are still going on we can present at this
time only preliminary results. Unfortunately soil temperature data of our monitoring period is not
available yet.
Fig. 6 shows inversion results of the freezing process in late autumn 2011. Especially in the
shallow part there is a significant increase of resistivity visible. In deeper areas in comparison the
changes are much smaller and considering the displayed colour bar we see that the resistivities
are in the range of 100 to 150 kΩm. These high values and the negligible change during the
freezing process indicate the presence of permafrost at depth. In the left part of the depth section
we have the strongest influence of the freezing process to the measured resistivities. This could
be explained by the fact that we have solid rock at this part, where low temperatures penetrate
much faster than at weathered conditions with rock waste what we observed along the rest of the
profile. We are confident that with additional information of soil temperature data we will be able
to verify these assumptions.

Fig. 6: Inversion results covering the freezing process.

We plan to continue our geoelectric monitoring at the Magnetköpfl at least to summer 2012 to
cover an entire seasonal period.

Conclusions
With our monitoring measurements we showed that resistivity is a very useful parameter for the
detection of permafrost as well as for the investigation of freezing and melting processes in the
topmost layer. Nevertheless there is still the need of some improvements to ensure a detailed
and verified interpretation of geoelectric data.

Acknowledgements
The soil temperature data from the Sonnblick was kindly provided by the Central Institute of
Meteorology and Geodynamics, Vienna (ZAMG). The geoelectric monitoring is funded by the
Austrian Science Fund (FWF) – project TEMPEL (TRP 175).

                                                       63
Berichte Geol. B.-A., 93, ISSN 1017‐8880 – Applications in CO2 Monitoring
References
HAUCK, C., 2002: Frozen ground monitoring using DC resistivity tomography. – Geophysical
research letters, 29(21): 2016, doi:10.1029/2002GL014995.
HAUCK, C. and VONDER MÜHLL, D., 2003: Permafrost monitoring using time lapse resistivity
tomography. – Proceedings of the 8th International Conference on Permafrost, Zürich,
Switzerland, 361-366.
KNEISEL, C., 2004: New insights into mountain permafrost occurrence and characteristics in glacier
forefields at high altitude through the application of 2D resistivity imaging. – Permafrost and
Periglacial Processes, 15, 221-227.
MARESCOT, L., LOKE, M.H., CHAPELLIER, D., DELALOYE, R., LAMBIEL, C. and REYNARD, E., 2003: Assessing
reliability of 2D resistivity imaging in mountain permafrost studies using the depth of
investigation index method. – Near Surface Geophysics, 1, 57-67.
SUPPER, R. and RÖMER, A., 2003: New Achievements in Developing a High Speed Geoelectrical
Monitoring System for Landslide Monitoring. – Proceedings of the Environmental and
Engineering Geophysical Society, 9th Meeting Prag.
64You can also read