Modeling Quarterback Passer Rating - Texas Instruments Calculators
←
→
Page content transcription
If your browser does not render page correctly, please read the page content below
Modeling Quarterback Passer Rating
 TEACHER NOTES

Lesson Overview

One common use of modeling is the creation of a single numerical rating Learning Goals
that incorporates multiple measures for the purposes of ranking products
 Students will be able to:
or people. This activity uses the measures commonly collected for football
quarterbacks and provides an opportunity for students to create their own 1. model a contextual
quarterback rating models. These can be compared to the formula in situation mathematically
actual use by the National Football League (NFL) and to other formulas, and use the model to
such as that used by the National Collegiate Athletic Association (NCAA). answer a question.

 2. represent data on two
 quantitative variables on a
About the Lesson and Possible Course Connections: scatter plot, and describe
The activity can be used with introductory algebra students, and lends how the variables are
itself to a group project assignment. There are nice connections to related.
averages and ratios as a tool for analyzing information, in particular for 3. find and interpret linear
accounting for the difference in the units associated with the data. The equations to model
rating formula is a good example of a multivariable function, and its relationships between two
structure is easily analyzed. The activity could also be adapted for middle quantitative variables.
school students by using a smaller subset of the list of players.
 4. use proportional
 relationships to solve real-
 world and mathematical
 problems.
CCSS Standards

Algebra Standards:
 • A-SSE.B, A-SSE.B.1
 • A-SSE.A, A-SSE.A.1
 • A-CED.A, A-CED.A.2
 • A-SSE.A.3

Interpreting Data Standards:
 • S-ID.B, S-ID.B.6
Ratio and Proportional Relationships Standards:
 • 7.RP.A, 7.RP.A.1
Mathematical Practice Standards
 • SMP.4

©2020 Texas Instruments Incorporated 1 education.ti.com
Modeling Quarterback Passer Rating
 TEACHER NOTES

Lesson Materials

• Compatible TI Technologies:

 TI-Nspire CX Handhelds, TI-Nspire Apps for iPad®, TI-Nspire Software

• Modeling QB Passer Rating_Student.pdf

• Modeling QB Passer Rating_Student.doc

• Modeling QB Passer Rating.tns

• Modeling QB Passing Rating_Teacher Notes

Background

Who is the GOAT (greatest of all time) among past and current NFL quarterbacks? Many passing
statistics are gathered for quarterbacks, including numbers of passing attempts, completed passes, yards
gained, touchdown passes, and on the negative side, interceptions. How can all this information be
combined in a way that allows us to give each quarterback a single numerical rating that could be used to
compare and rank different quarterbacks? Students will use the data provided in the Appendix or in the
calculator file, which can be provided directly to them containing the data.

 Teacher Tip: Students should open the .tns file with the data. If they enter the data
 by hand, they are likely to make errors. Younger students might work with a subset,
 for example the current players. Students do not need a background in regression or
 multiple regression; they can think about different ways to combine the numbers in
 order to create a model for rating each quarterback based on the data. If they do
 have a background in regression, encourage them to think about other alternatives
 as well. Students do not really have to have a background in football (although it
 might make the task more interesting). Knowing that they are looking for a way to
 rank the players from best down, they can just play with the numbers. They may
 choose to use part or all of the information but should have some reason for their
 decision.

©2020 Texas Instruments Incorporated 2 education.ti.com
Modeling Quarterback Passer Rating
 TEACHER NOTES

 Facilitating the Lesson

Introduction: Present the class with the data – either projected or paper copies (See Appendix). Begin the
discussion by having each student write down the answers to the following questions.
 1. What do you notice? (Some made a lot of touchdowns and some not so many; Aaron Rodgers has
 very few interceptions; Tom Brady, Drew Brees, Brett Favre and Peyton Manning made more
 yards passing compared to all of the others; Favre had a lot of interceptions compared to the
 others, …)
 2. What do you wonder about? (If the interceptions balance out the touchdowns, does that indicate a
 “mediocre” quarterback? Are the quarterbacks with the most touchdowns really the best?)
 3. Which of the data do you think most important? Least important? Are the number of attempts
 important? Why or why not?

Discuss the answers with the class, recording the things students notice and wonder on the board or chart
paper. I After the class has responded, if someone wonders who the best quarterback is, tell the class that
is what you are going to investigate. If it does not occur in the wonderings, point out that sportswriters and
others are wondering about who is best, so you are going to investigate. (Save the other wonderings as
possible further investigations).

There are several ways this lesson can be implemented in the classroom:

1) Open-Ended Approach:
First, ask the students to think alone for a few minutes and then write down how they would start to rank
the quarterbacks. Then, put them in pairs or threes for further discussion.

Student Instructions: In your groups,

 • Exchange your ideas.
 • Decide as a group how you will begin to analyze the data. Give each member of the group a job to
 do that will help you in the work.
 • Decide whether your approach seems reasonable for the data. Explain why you think your model
 is good for rating the quarterbacks. What are the drawbacks, if any, to your model?

2) More-Structured Approach to Finding a Model:

Put students into groups to find a method to rate the players. Remind them that they will be expected to
defend their process for rating the players. Pose the following questions to help push their thinking:
 • Will a graph help?
 • What relationships might you explore graphically to help determine a formula?
 • Are all of the categories equally important? Why or why not?
 • How can you account for a quarterback who played for many years as opposed to one who played
 for much less time?
 • Can you create a formula?

©2020 Texas Instruments Incorporated 3 education.ti.com
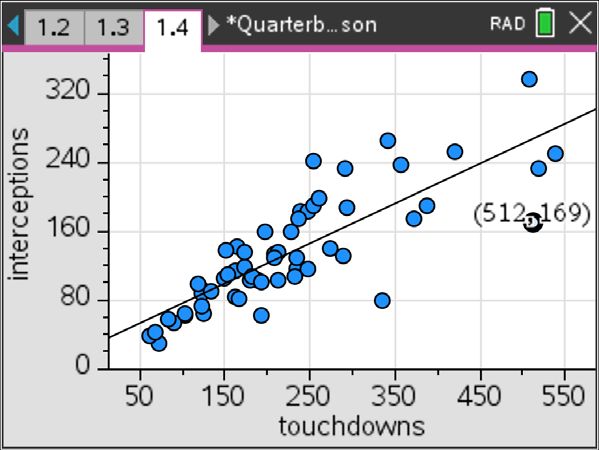
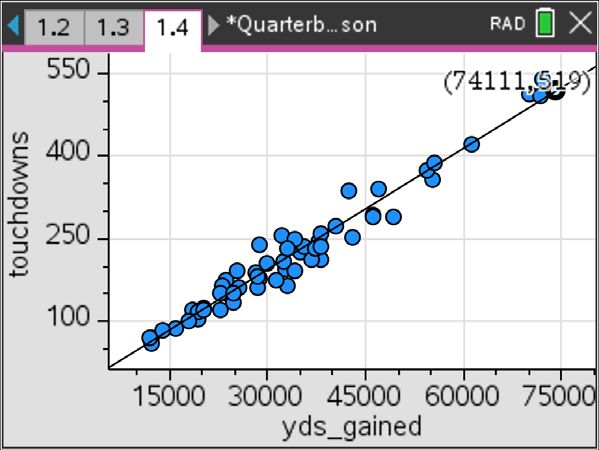
Modeling Quarterback Passer Rating
 TEACHER NOTES

What to Expect: Example Student Solutions

 EX 1: Graphing the Data

 Some students might consider graphing the data. For
 example, if a scatter plot of (completions, touchdowns)
 is graphed, the relationship between completions and
 touchdowns seems to be linear (figure 1). Help them
 consider all of the data: for example, what happens
 with a quarterback who has high numbers of both
 completions and touchdowns, but also has a lot of
 interceptions (figure 2)? Figure 1: Touchdowns vs. Yards Gained

 Figure 2: Interceptions vs. Touchdowns

Students may investigate why it might be useful to divide
by the number of attempts and should explain why the
outcomes are different (Figures 3 and 4).

 Figure 3: Touchdowns vs Yards Gained but
 now accounting for attempts

 Figure 4: Interceptions vs. Yards Gained
 but now accounting for attempts

©2020 Texas Instruments Incorporated 4 education.ti.com
Modeling Quarterback Passer Rating
 TEACHER NOTES

EX #2: Creating a Formula

Some students might create a formula; they should recognize that using averages (rates) per attempt (for
example, yards per attempt, completions per attempt, etc.) rather than counts might be useful for
comparing two players with very different numbers of attempts – dividing by the number of attempts can
accomplish this. One possible such model might be the following, where the interception rate is subtracted
from the others.

 + + − =

Notice that Y (measured in yards) is much larger than the other values, so this simple sum of averages
makes the contribution of yards per attempt to the rating R much greater than any of the other averages.

To account for this, different coefficients (weights) for the terms could be introduced to adjust for the
different sizes of these averages, as well reflecting some subjective judgment of their relative importance.
For example, one such weighting might be:

 5 + 10 + 2 − 10 =

Some students might look for a way to compare each player’s performance “score” in a category (such as
touchdowns per attempt) to the best “score” achieved among all the players. For example, Graham’s
touchdowns per attempt is the best of all players at 0.066, so each player’s touchdowns per attempt could
be divided by 0.066 to get a statistic relative to Graham’s best performance, which would be 1.0 (from
0.066/0.066). Brees’ touchdowns per attempt average of 0.053 would be converted to the value
0.053/0.066 = 0.80 or 80% of the best performance in the data. A similar benchmark for each data
category could be computed, and the other players’ scores converted to this new scale. These converted
scores, now on the same scale could be combined to create an overall rating for each player.

©2020 Texas Instruments Incorporated 5 education.ti.com
Modeling Quarterback Passer Rating
 TEACHER NOTES

 Validating the Models

Students should validate their models either by asking whether the models make sense in different
scenarios related to the context or by finding other information to reflect against the model. One
strategy might be to have each group consider whether the models created by other groups make
sense.
Some questions are suggested below that might be useful in helping students think about whether
their model was reasonable:

• How do the rankings of the quarterbacks by different groups in class compare to each other? What
 might explain any big differences?
• Would different graphical representation generate different rankings that are reasonable? Why or why
 not?
• What is the highest rating someone could have from the model? The lowest? Do these extremes
 make sense?
• Popularly, several quarterbacks have been recognized as being “great” (e.g., Aaron Rodgers, Drew
 Brees, Tom Brady, …) Does the model place them appropriately? What might need to be changed in
 the model to take the statistics for these players into account?
• One of the “great” quarterbacks from many years ago was Johnny Unitas, who played with the
 Baltimore Colts from 1956 to 1973. He had 5186 attempts, made 2830 completions, 290 touchdowns
 and 253 interceptions. The total number of yards gained in passing was 39,768. Would the model
 place him in a rank that made sense? Why did he not earn a place in this set of top quarterbacks?
• One of the up and coming quarterbacks is Patrick Mahomes, of the Kansas City Chiefs with 724
 completions, 1099 attempts, 9,412 yards gained, 76 touchdowns and 18 interceptions after the 2019
 regular season. Would the model place him in a sense making rank?

 Extension

Consider the actual formula* used by the NFL to rate quarterbacks described below, where :

 A = attempts T = touchdowns Y = yards gained
 C = completions I = interceptions
Method 1. The NFL quarterback rating R is given by this formula:

©2020 Texas Instruments Incorporated 6 education.ti.com
Modeling Quarterback Passer Rating
 TEACHER NOTES

Discussion Questions:
 1. What are some interesting questions you might pose about
 this formula?
 2. An alternate approach is described below as Method 2. How
 do the two approaches compare?
 3. Find the ratings for the quarterbacks in the table using either
 the formula or the method 2, described below. How did your
 model compare to the one used by the NFL?

Method 2. Here is an alternative method of computing the NFL
quarterback rating R:

 Step 1: Complete passes divided by pass attempts. Subtract 0.3,
 then divide by 0.2
 Step 2: Passing yards divided by pass attempts. Subtract 3, then
 divide by 4.
 Step 3: Touchdown passes divided by pass attempts, then divide
 by .05.
 Step 4: Start with .095, and subtract interceptions divided by
 attempts. Divide the product by .04.

 The sum of each step cannot be greater than 2.375 or less than
 zero. Add the sum of Steps 1 through 4, multiply by 100, and
 divide by 6.

Discussion Question:

 4. Are the two methods really equivalent? Why or why not?

* https://en.wikipedia.org/wiki/Passer_rating

 5. College quarterbacks are rated using a different formula:

 8.4 + 330 + 100 − 220
 =

 How would the ranking from this formula compare to your model?
 What about to the NFL method?

 6. Choose a model (yours, the NFL or the College Ranking) to
 rate the quarterbacks in your school’s league. How well do
 you think the ranking works?

©2020 Texas Instruments Incorporated 7 education.ti.com
Modeling Quarterback Passer Rating
 TEACHER NOTES

Appendix: Data Set for Lesson

The table below shows the results of using the NFL quarterback rating formula (either Method) for these
quarterbacks. In the student handout there is a copy of this table without the rating column.

NFL Ratings based on the NFL Quarterback ranking formula (Method 1) given earlier:

 TDs Pass Yds Attempts Interceptions Rating
 completion gained

Troy Aikman 165 2898 32942 4715 141 81.6

Kent Anderson 197 2654 32838 4475 160 81.9

*Tom Brady 512 5967 70138 9318 169 97.6

*Drew Brees 519 6559 74111 9744 233 97.8

*Sam Bradford 103 1855 19449 2967 61 84.5

Marc Bulger 122 1969 22814 3171 93 84.4

*Derek Carr 122 1716 18387 2741 87 89.2

Jay Cutler 227 3048 35133 4920 160 85.5

Kurt Cousins 125 1756 20119 2641 65 94.8

Dante Culpepper 149 2016 24153 3199 106 87.8

Randall 207 2429 29979 4289 134 81.5
Cunningham

*Andy Dalton 188 2443 28100 3921 104 88.8

Len Dawson 239 2136 28711 3741 183 82.6

Boomer Esiason 247 2969 37920 5205 184 81.1

Brett Favre 508 6300 71838 10169 336 86.

*Joe Flacco 212 3499 38245 5670 136 84.1

Dan Fouts 254 3297 43040 5604 242 80.2

Rich Gannon 180 2533 28743 4206 104 84.7

©2020 Texas Instruments Incorporated 8 education.ti.com
Modeling Quarterback Passer Rating
 TEACHER NOTES

Jeff Garcia 161 2264 25537 3676 83 87.5

Otto Graham 174 1464 23584 2626 135 86.6

Trent Green 162 2266 28475 3740 114 86

David Garrard 89 1406 16003 2281 54 85.8

Brian Griese 119 1752 19440 2794 99 82.7

Matt Hasselbeck 212 3222 36638 5330 104 82.4

Sonny Jurgensen 255 2433 32224 4262 189 82.6

Colin Kaepernick 72 1011 12271 1692 30 88.9

Dave Krieg 261 3105 38147 5311 199 81.5

*Casey Keenum 61 1090 12167 1759 39 85.5

Jim Kelly 237 2874 35467 4779 175 84.4

*Andrew Luck 166 1945 23029 3208 81 89.3

* Eli Manning 357 4755 55371 7898 237 84.2

Peyton Manning 539 6125 71940 9380 251 96.5

Dan Marino 420 4967 61361 8358 252 86.4

*Marcus Mariota 69 1005 11894 1592 42 89.5

Donovan McNabb 234 3170 37276 5374 117 85.6

Steve McNair 174 2733 31304 4544 119 82.8

Joe Montana 273 3409 40551 5391 139 92.3

Warren Moon 291 3988 49325 6823 233 80.9

*Cam Newton 182 2321 28469 3891 107 86.7

Carson Palmer 294 3941 46247 6307 187 87.9

Chad Pennington 102 1632 17823 2471 64 90.1

*Matt Ryan 290 4006 46103 6131 132 94.6

©2020 Texas Instruments Incorporated 9 education.ti.com
Modeling Quarterback Passer Rating
 TEACHER NOTES

* Philip Rivers 373 4481 54299 6939 174 96

*Aaron Rodgers 336 3520 42476 5432 80 103.1

* Ben 388 4552 55527 7073 189 94.1
Roethlisberger

Tony Romo 248 2829 34183 4335 117 97.1

*Matt Schaub 133 2098 24887 3281 90 89.1

*Alex Smith 193 3082 34068 4941 101 87.3

Roger Staubach 153 1685 22700 2958 109 83.4

*Matthew Stafford 235 3334 38144 5341 129 88.4

Bart Starr 152 1808 24718 3149 138 80.5

Ryan Tannehill 122 1796 20141 2858 72 87.8

Fran Tarkenton 342 3686 47003 6467 266 80.4

Kurt Warner 208 2666 32344 4070 128 93.7

*Russell Wilson 192 2065 25201 3211 62 100.3

*Jameis Winston 83 1127 13947 1839 57 87.3

Steve Young 232 2667 33124 4149 107 96.8

* Active in 2018

Resources

https://en.wikipedia.org/wiki/List_of_National_Football_League_career_passer_rating_leaders
career stats at nfl.com
Data can also be found by searching for each individual player’s individual statistics.

©2020 Texas Instruments Incorporated 10 education.ti.com
You can also read