Analysis of the Potential for a Heat Island Effect in Large Solar Farms
←
→
Page content transcription
If your browser does not render page correctly, please read the page content below
Analysis of the Potential for a Heat Island Effect in Large Solar
                                           Farms
                                            Vasilis Fthenakis1,2 and Yuanhao Yu1
      1
          Center for Life Cycle Analysis, Department of Earth and Environmental Engineering, Columbia
                                           University, New York, NY
               2
                   PV Environmental Research Center, Brookhaven National Laboratory, Upton, NY
   Abstract — Large-scale solar power plants are being built at a    global climate due to albedo change from widespread
rapid rate, and are setting up to use hundreds of thousands of       installation of solar panels and found this to be small
acres of land surface. The thermal energy flows to the
environment related to the operation of such facilities have not,    compared to benefits from the reduction in greenhouse gas
so far, been addressed comprehensively. We are developing            emissions. However, Nemet did not consider local micro-
rigorous computational fluid dynamics (CFD) simulation               climates and his analytical results have not been verified with
capabilities for modeling the air velocity, turbulence, and energy   any field data. Donovan [3] assumed that the albedo of
flow fields induced by large solar PV farms to answer questions      ground-mounted PV panels is similar to that of underlying
pertaining to potential impacts of solar farms on local
microclimate. Using the CFD codes Ansys CFX and Fluent, we           grassland and, using simple calculations, postulated that the
conducted detailed 3-D simulations of a 1 MW section of a solar      heat island effect from installing PV on grassy land would be
farm in North America and compared the results with recorded         negligible. Yutaka [4] investigated the potential for large scale
wind and temperature field data from the whole solar farm.           of roof-top PV installations in Tokyo to alter the heat island
Both the field data and the simulations show that the annual         effect of the city and found this to be negligible if PV systems
average of air temperatures in the center of PV field can reach up
to 1.9Ԩ above the ambient temperature, and that this thermal         are installed on black roofs.
energy completely dissipates to the environment at heights of 5 to      In our study we aim in comprehensively addressing the
18 m. The data also show a prompt dissipation of thermal energy      issue by modeling the air and energy flows around a solar
with distance from the solar farm, with the air temperatures         farm and comparing those with measured wind and
approaching (within 0.3Ԩ) the ambient at about 300 m away of         temperature data.
the perimeter of the solar farm. Analysis of 18 months of
detailed data showed that in most days, the solar array was
completely cooled at night, and, thus, it is unlikely that a heat              II. FIELD DATA DESCRIPTION AND ANALYSIS
island effect could occur. Work is in progress to approximate the
flow fields in the solar farm with 2-D simulations and detail the      Detailed measurements of temperature, wind speed, wind
temperature and wind profiles of the whole utility scale PV plant    direction, solar irradiance, relative humidity, and rain fall were
and the surrounding region. The results from these simulations
can be extrapolated to assess potential local impacts from a         recorded at a large solar farm in North America. Fig. 1 shows
number of solar farms reflecting various scenarios of large PV       an aerial photograph of the solar farm and the locations where
penetration into regional and global grids.                          the field measurements are taken.
   Index Terms – PV, climate change, heat island, fluid dynamics

                       I. INTRODUCTION
  Solar farms in the capacity range of 50MW to 500 MW are
being proliferating in North America and other parts of the
world and those occupy land in the range from 275 to 4000
acres. The environmental impacts from the installation and
operation phases of large solar farms deserve comprehensive
research and understanding. Turney and Fthenakis [1]
investigated 32 categories of impacts from the life-stages of
solar farms and were able to categorize such impacts as either
beneficial or neutral, with the exception of the “local climate”
effects for which they concluded that research and observation
are needed. PV panels convert most of the incident solar
radiation into heat and can alter the air-flow and temperature
profiles near the panels. Such changes, may subsequently
affect the thermal environment of near-by populations of
                                                                     Fig. 1. A picture of the solar farm indicating the locations of the
humans and other species. Nemet [2] investigated the effect on       monitoring stations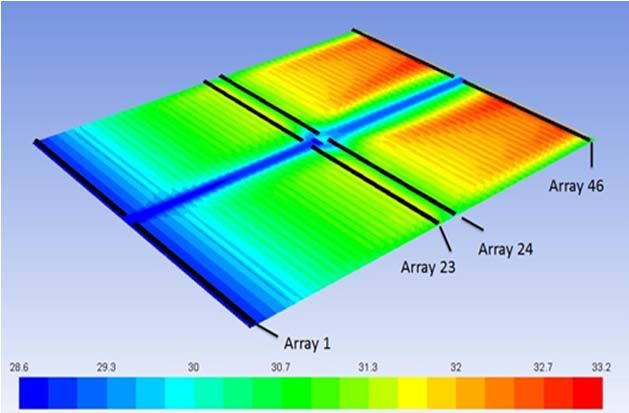
The field data are obtained from 17 monitoring stations These figures and Table 1 show that with the exception of
within and around the solar farm, including 8 weather stations Hawk 4, the closer the proximity to solar farm the higher the
(WS) and 9 Hawk stations (HK), all at 2.5 m heights off the temperature difference from the ambient (indicated by Hawk
ground. There also 80 module temperature (MT) sensors at the 6). The relative high temperatures recorded at Hawk 4, and
back-side of the modules close to each of the corresponding also the relative low temperatures at Hawks 1 and 5 are
power stations. The WS and MT provide data at 1-min explained by the prevailing wind direction, which for the time
intervals, while the Hawk provides data every 30 minutes. The period used in our analysis (8/14/2010-3/14/2011) was
WS and MT data cover a period of one year from October Southerly (158°-202°). Hawk 4 is downwind of the solar farm,
2010 to September 2011, while the Hawk data cover a period whereas Hawks 1 and 5 are upwind; the downwind station
of 18 months from March 2010 through August 2011. “feels” more the effect of the heat generated at the solar farm
than the ones upwind.
Hawk stations 3, 6, 7, 8 and 9 are outside the solar farm and
were used as reference points indicating ambient conditions.
Fig. 8 shows the decline in air temperature as a function of
The measurements from Hawk 3, 6, 8 and 9 agree very well
distance to solar farm perimeter. Distances for WS2 and WS7
confirming that their distances from the perimeter of the solar are negative since they are located inside the solar farm site.
farm are sufficient for them to be unaffected by the thermal WS2 is further into the solar farm and this is reflected in its
mass of the PV system; Hawk 7 shows higher temperatures higher temperature difference than WS7.
likely due to a calibration inaccuracy. In our comparative data
analysis we use Hawk 6 as a reference point and, since the
TABLE I
prevailing winds are from the south, we selected the section DIFFERENCE OF AIR TEMPERATURE (@2.5 M HEIGHTS) BETWEEN THE
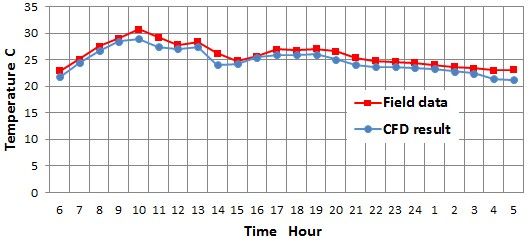
around WS7 as the field for our CFD simulations. Figures 2 to LISTED WEATHER AND HAWK STATIONS AND THE AMBIENT
7 show the difference between the temperatures in Hawk 6 Met Station WS2 WS7 HK1 HK2 HK3 HK4 HK5 HK9
and those in the weather stations WS2 and WS7 within the
Temp Difference
field, and Hawks 1, 2, 4 and 5 around the solar field. from H6 (oC)
1.878 1.468 0.488 1.292 0.292 0.609 0.664 0.289
Distance to solar
-440 -100 100 10 450 210 20 300
farm perimeter (m)
Fig. 2. Air temp WS2 vs. Hawk 6 Fig.3. Air temp WS7 vs. Hawk6
Fig. 8. Air temperature difference as a function of distance from the
perimeter of the solar farm. Negative distances indicate locations
within the solar farm.
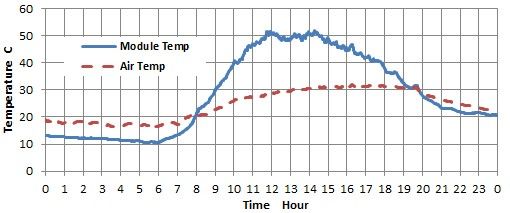
We also examined in detail the temperature differences
between the modules and the surrounding air. These vary
Fig. 4. Air temp Hawk 1 vs. 6 Fig. 5. Air temp Hawk 2 vs. 6 throughout the year but the module temperatures are
consistently higher than those of the surrounding air during
the day, whereas at night the modules cool to temperatures
below ambient; an example is shown in Fig. 9. Thus, this PV
solar farm did not induce a day-after-day increase in ambient
temperature, and therefore, adverse micro-climate changes
from a potential PV plant are not a concern.
Fig. 6. Air temp Hawk 1 vs. 6 Fig. 7. Air temp Hawk 2 vs. 6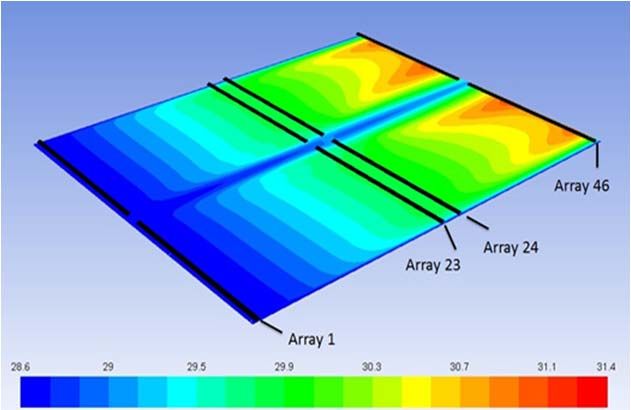
Fig. 9. Comparison of module temperature and air temperature 2.5
m off the ground on a sunny day (July 1, 2011)
III. CFD MODEL DEVELOPMENT
In preliminary simulations we tested the Ansys CFX and
FLUENT computational fluid dynamics codes (CFD) and
Fig. 10. Module temperatures from 3-D simulations of air flows and
decided to use FLUENT in detailed simulations. FLUENT
offers several turbulence schemes including multiple thermal exchange during a sunny day
variations of the k-ε models, as well as k-ω models, and
Reynolds stress turbulence models. We used the standard, Our simulations also showed that the air temperatures above
renormalized-group (RNG), and realizable k-ε turbulence the arrays at a height of 2.5 m ranged from 28.6 Ԩ to 31.1Ԩ;
closure scheme as it is the most commonly used model in the ambient temperature was 28.6 Ԩ (Fig. 11).
street canyon flow and thermal stratification studies [5].
FLUENT incorporates the P-1 radiation model which affords
detailed radiation transfer between the solar arrays, the ground
and the ambient air; it also incorporates standard free
convection and wind-forced convection models. Our choice
of solver was the pressure-based algorithm SIMPLE which
uses a relationship between velocity and pressure corrections
to enforce mass conservation and obtain the pressure field. We
conducted both three-dimensional (3-D) and 2-D simulations.
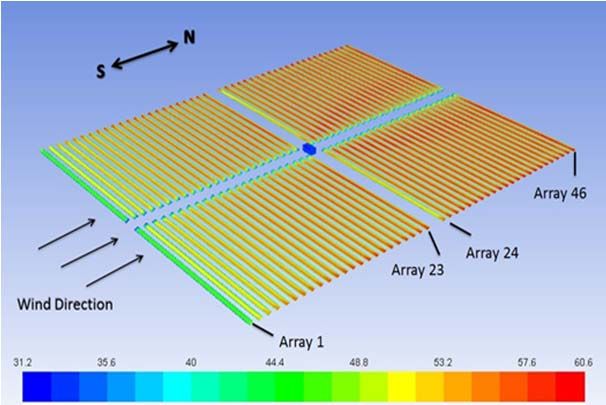
A 3-D model was built of four fields each covering an area
of 93-meters by 73-meters (Fig. 10). Each field contains 23
linear arrays of 73-meter length and 1.8-meter width. Each
array has 180 modules of 10.5% rated efficiency, placed
facing south at a 25-degree angle from horizontal, with their
bottom raised 0.5 m from the ground and their top reaching a (a)
height of 1.3 m . Each array was modeled as a single 73 m
ൈ1.8 m ൈ 1 cm rectangular. The arrays are spaced 4 meters
apart and the roads between the fields are 8 m. Fig. 10 shows
the simulated temperatures on the arrays at 14:00 pm on
7/1/2011, when the irradiance was 966 W/m2. As shown, the
highest average temperatures occur on the last array (array 46).
Temperature on the front edge (array 1) is lower than in the
center (array 23). Also, temperature on array 24 is lower than
array 23, which is apparently caused by the cooling induced
by the road space between two fields, and the magnitude of
the temperature difference between arrays 24 and 46 is lower
than that between arrays 1 and 23, as higher temperature
differences from the ambient, result in more efficient cooling.
TABLE II
MODULES TEMPERATURE (b)
Fig. 11 Air temperatures from 3-D simulations during a sunny day.
Arrays 1 23 24 46
a) Air temperatures at a height of 1.5 m; b) air temperatures at a
Temperature ℃ 46.1 56.4 53.1 57.8 height of 2.5 m.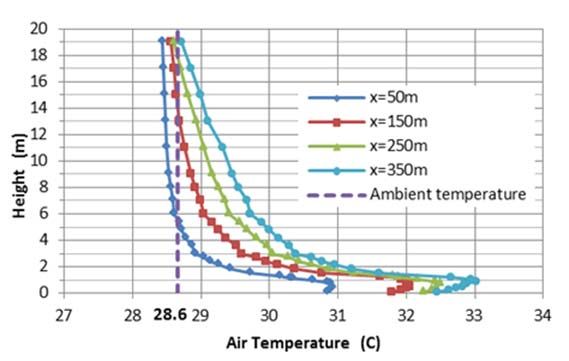
TABLE III
AIR TEMPERATURE
Temperature Ambient (Ԩ) Low (Ԩ) High (Ԩ) Average (Ԩ)
2.5m height 28.6 28.6 31.1 30.1
1.5m height 28.6 28.6 33.2 30.8
These simulations show a profound cooling effect with
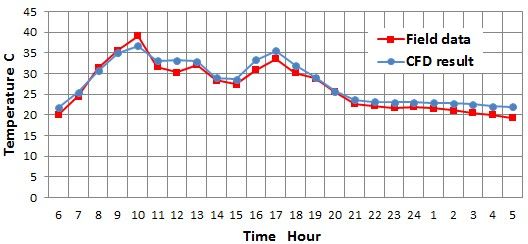
increasing height from the ground. It is shown that the Fig. 13. Comparisons of field and modeled air temperatures at a
temperatures on the back surface of solar panels is up to 30° height of 2.5 m; a sunny summer day (7/1/2011); 2-D simulations.
C warmer than the ambient temperature, but the air above the
arrays is only up to 2.5°C higher than the ambient (i.e.,
31.1Ԩ). Also the road between the fields allows for cooling,
which is more evident at the temperatures 1.5 m off the
ground (Fig. 11a). The simulations show that heat build-up at
the power station in the middle of the fields has a negligible
effect on the temperature flow fields; it was estimated that a
power station adds only about 0.4% to the heat generated by
the corresponding modules.
The 3-D model showed that the temperature and air velocity
Fig. 14. Comparisons of field and modeled module temperatures; a
fields within each field of the solar farm were symmetrical cloudy summer day (7/11/2011); 2-D simulations.
along the cross-wind axis; therefore a 2-D model of the
downwind and the vertical dimensions was deemed to be
sufficiently accurate. A 2-D model reduced the computational
requirements and allowed for running simulations for several
subsequent days using actual 30-min solar irradiance and wind
input data. We tested the numerical results for three layers of
different mesh sizes and determined that the following mesh
sizes retain sufficient detail for an accurate representation of
the field data: a) Top layer: 2m by 1m, b) Middle layer: 1.5m
by 0.6m, c) Bottom layer: 1m by 0.4m. According to these
mesh specifications, a simulation of 92 arrays (length of 388m, Fig. 15. Comparisons of field and modeled air temperatures at a
height 9m), required a total of 13600 cells. Figures 12-15 height of 2.5 m; a cloudy summer day (7/11/2011); 2-D simulations.
show comparisons of the modeled and measured module and
air temperatures.
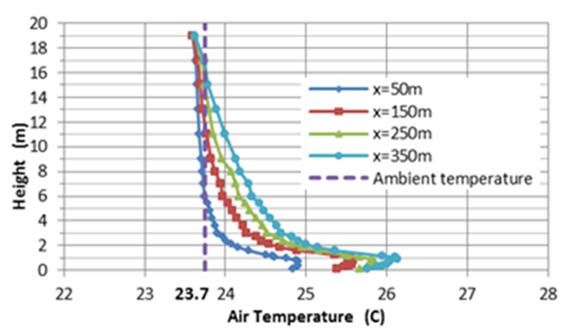
Figures 16a and 16b show the air temperature as a function
of height at different downwind distances in the morning and
afternoon during a sunny summer day. At 9 am (irradiance
500 W/m2, wind speed 1.6 m/s, inlet ambient temperature
23.7Ԩ), the heat from the solar array is dissipated at heights of
5-15m, whereas at 2 pm (irradiance 966 W/m2, wind speed
2.8m/s, inlet ambient temperature 28.6Ԩ , the temperature of
the panels has reached the daily peak, and the thermal energy
takes up to 18 m to dissipate.
Fig. 12. Comparisons of field and modeled module temperatures; a
sunny summer day (7/1/2011); 2-D simulations.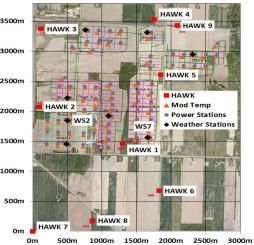
ambient and that it declines to the ambient temperature at 5 to
                                                                   18 m heights. The field data also show a clear decline of air
                                                                   temperatures as a function of distance from the perimeter of
                                                                   the solar farm, with the temperatures approaching the ambient
                                                                   temperature (within 0.3Ԩ), at about 300 m away. Analysis of
                                                                   18 months of detailed data showed that in most days, the solar
                                                                   array was completely cooled at night, and, thus, it is unlikely
                                                                   that a heat island effect could occur.
                                                                     Our simulations also show that the access roads between
                                                                   solar fields allow for substantial cooling, and therefore,
                                                                   increase of the size of the solar farm may not affect the
                              (a) 9:00 am                          temperature of the surroundings. Simulations of large (e.g., 1
                                                                   million m2) solar fields are needed to test this hypothesis.

                                                                                         ACKNOWLEDGEMENT
                                                                   We are grateful to First Solar for providing data for this study.

                                                                                              REFERENCES
                                                                   [1] D. Turney and V. Fthenakis Environmental, "Impacts from the
                                                                        installation and operation of large-scale solar power slants,"
                                                                        Renewable and Sustainable Energy Reviews, vol. 15, pp. 3261-
                                                                        3270, 2011.
                                                                   [2] F.G. Nemet. "Net radiative forcing from widespread deployment
                              (b) 2:00 pm                               of photovoltaics," Environ. Sci. Technol., vol. 43, pp. 2173-
                                                                        2178, 2009.
Fig. 16 Air temperatures within the solar farm, as a function of    [3] M. Donovan, "Memorandum: impact of PV systems on local
height at different downwind distances. From 2-D simulations            temperature, " SunPower, July 6, 2010.
during a sunny summer day (7/1/2011) at 9 am and 2 pm.                  http://www.rurdev.usda.gov/SupportDocuments/EA_5_17_13_
                                                                        RUS_ PartA.pdf
                                                                   [4] Y. Genchi, M. Ishisaki, Y. Ohashi, H. Takahashi, & A. Inaba,
                         IV. CONCLUSION                                 "Impacts of large-scale photovoltaic panel installation on the
                                                                        heat island effect in Tokyo, " in Fifth Conference on the Urban
  The field data and our simulations show that the annual               Climate, 2003.
average of air temperatures at 2.5 m of the ground in the          [5] Theory Guide, ANSYS Fluent HELP 13.
center of simulated solar farm section is 1.9Ԩ higher than the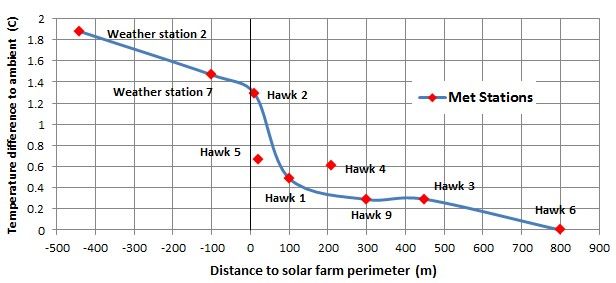
You can also read