The Impact of COVID-19 Public Health Measures on Diagnosis of Advanced HIV Disease, Cryptococcal Antigenaemia and Cryptococcal Meningitis in South ...
←
→
Page content transcription
If your browser does not render page correctly, please read the page content below
The Impact of COVID-19 Public Health
Measures on Diagnosis of Advanced HIV
Disease, Cryptococcal Antigenaemia
and Cryptococcal Meningitis in South
               Africa

              15 June 2020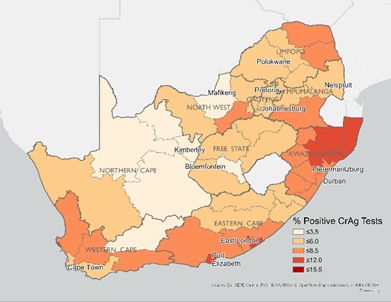
BACKGROUND

Cryptococcal meningitis continues to be one of the top                The spread of coronavirus disease (COVID-19) to South
causes for HIV-related deaths each year, across the African           Africa in early 2020 has impacted on South Africa’s health
continent and in South Africa specifically, and is most               system and also led to public health measures to reduce
common in persons with advanced HIV disease (CD4 count                the spread of the virus.10 The South African government
less than 200 cells/µL).1–3 Cryptococcal antigen (CrAg),              initially recommended social distancing in mid-March,
a highly-specific biomarker for cryptococcal disease, can             banned all large gatherings and restricted international
be detected in blood weeks to months prior to the onset               travel. This transitioned to a full-scale lockdown starting on
of cryptococcal meningitis symptoms.4 Routine screening               the 27 March, after which the movement of people and
for CrAg is operational nationwide at all public-sector CD4           use of public transit was strictly controlled and limited to
laboratories, where blood samples with a CD4 count of                 essential workers or the procurement of essential goods.
less than 100 cells/µL, a marker of very advanced HIV disease,        This lockdown, later known as Level 5 lockdown, was
are automatically screened for CrAg so patients can be                relaxed on 1 March 2020 as the country moved to Level 4
subsequently assessed for meningitis and treated with                 lockdown. During this period, people in selected jobs were
appropriate antifungal therapy.5,6                                    able to return to work, and public transit resumed, though
                                                                      at a limited capacity. Additionally, public exercise hours and
Advanced HIV disease and cryptococcal disease most                    a night-time curfew were instated.
often occurs in individuals who are newly diagnosed and
have not yet initiated antiretroviral therapy (ART) or those          Using routine laboratory and clinical surveillance data, we
who have previously been on ART but have interrupted                  analyse the impact of these COVID-related public health
treatment.7,8 Access to HIV care is key to identifying patients       restrictions on public health sector a) advanced HIV disease
with advanced HIV disease and appropriately screening for             diagnosis, b) routine CrAg screening, and c) cryptococcal
CrAg so that patients can be either pre-emptively treated to          meningitis diagnoses in South Africa from February through
prevent development of cryptococcal meningitis or can be              to May 2020.
safely and rapidly initiated on ART.9

 METHODS

CrAg test results are captured along with CD4 results in              extract of all CD4 tests and accompanying CrAg results for
the National Health Laboratory Service (NHLS) laboratory              all NHLS laboratories from 3 February 2017 through to 24
information system, TrakCare. The NICD Surveillance                   May 2020. All data were de-duplicated using laboratory
Data Warehouse (SDW) routinely extracts and processes                 episode numbers for test-level data and SDW-assigned
data stored in the NHLS TrakCare system for use in NICD               unique ID numbers for patient-level data.11 Cryptococcal
surveillance. To obtain surveillance results in this report,          meningitis case data were obtained from the NICD GERMS-
epidemiologists from the NICD’s Centre for Healthcare-                SA national surveillance database and we included CSF-
Associated Infections, Antimicrobial Resistance and                   positive cases confirmed in the laboratory by culture,
Mycoses (CHARM) worked with SDW to compile an                         India ink, or CSF cryptococcal antigen testing.

 RESULTS

Over the 16-week period from 3 February 2020 through 24               of 5 613 CrAg tests were performed weekly. A decrease in
May 2020, a total of 72 144 blood CrAg tests were performed           weekly testing volumes was then observed following the
on samples with CD4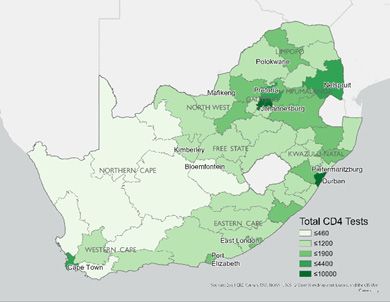
7000

                                                    6000

                                                    5000

                          Total Weekly CrAg Tests
                                                    4000

                                                    3000

                                                    2000

                                                    1000

                                                      0

                                                           Week Commencing

Figure 1. Total CrAg Tests by Week in Public Health Sector Starting 3 February to 25 May 2020, South Africa, n = 72 144

During the period of declining test volumes following lockdown, an initial spike in the proportion of
positive CrAg tests was simultaneously observed between the weeks of 23 March and 13 April (Table 1).
This indicates that, although fewer individuals received CrAg screening during the initial phase of lockdown,
those who were screened had a higher likelihood of testing positive for disseminated cryptococcal disease. .

Table 1. Total CrAg Tests, Positive CrAg Tests and Positivity Rate in the Public Health Sector by Week Starting 3 February to 25
May 2020, South Africa, n= 5 664 / 72 144 (7.9%)

 Week commencing          COVID-19 national                      Positive Tests        Total Tests     Percent Positive
                          intervention
 03-Feb-20                None                                   394                   5 698           6.9%
 10-Feb-20                None                                   412                   6 020           6.8%
 17-Feb-20                None                                   447                   5 779           7.7%
 24-Feb-20                None                                   336                   5 009           6.7%
 02-Mar-20                None                                   384                   5 458           7.0%
 09-Mar-20                None                                   392                   5 719           6.9%
 16-Mar-20                Social distancing                      394                   5 441           7.2%
 23-Mar-20                Social distancing/Lockdown             374                   4 679           8.0%
 30-Mar-20                Lockdown – Level 5                     388                   4 214           9.2%
 06-Apr-20                Lockdown – Level 5                     295                   3 799           7.8%
 13-Apr-20                Lockdown – Level 5                     333                   4 225           7.9%
 20-Apr-20                Lockdown – Level 5                     328                   4 434           7.4%
 27-Apr-20                Lockdown – Level 4/5                   160                   2 224           7.2%
 04-Mar-20                Lockdown – Level 4                     355                   4 785           7.4%
 11-Mar-20                Lockdown – Level 4                     316                   4 660           6.8%
 18-Mar-20                Lockdown – Level 4                     356                   4 472           8.0%

                                                                  3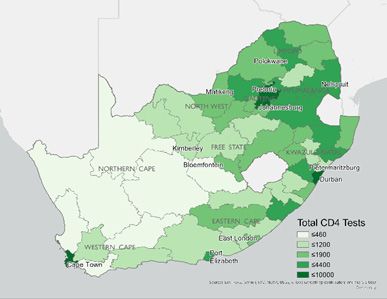
Weekly CrAg Cases                                                                                                                         Weekly CrAg Cases
                                6000

                                                                                                                                                                          500
                                                                                                                                      Total Weekly CrAg Cases
                   CrAg Tests
                                5000
                        Tests

                                                                                                                                                Total Weekly CrAg Tests
                                                                                                                                                                          400
                CrAg
            Weekly
                                4000
      Weekly

                                                                                                                                                                          300
Total Total
                                3000

                                                                                                                                                                          200
                                2000

                                                                                                                                                                                03-feb   17-feb   02-mar   16-mar   30-mar   13-apr   27-apr   11-may
                                       03-feb   17-feb   02-mar                  16-mar   30-mar     13-apr   27-apr   11-may
                                                         Week Commencing                                                                                                                          Week Week
                                                                                                                                                                                                       Commencing
                                                                                                                                                                                                            Commencing
                                                                        Week Commencing
         Figure 2. Weekly CrAg Tests and Cases in the Public Health Sector during COVID Restrictions, 3 Feb 2020 – 24 May 2020, South
         Africa (dashed vertical lines represent lockdown events)

         Although the percentage of positive CrAg tests did increase during the initial weeks of lockdown, total weekly
         numbers of CrAg-positive tests still decreased sharply, mirroring the trend observed in weekly testing numbers
         (Figure 2). This indicates that, although individuals who were screened for CrAg during the initial weeks of
         lockdown were more likely to be CrAg-positive, overall fewer CrAg-positive individuals were screened over
         the period, suggesting the possibility that cryptococcal disease cases went undetected during the period.

                                                                                 8000

                                                                                 7000

                                                                                 6000

                                                                                 5000
                                                              Total CrAg Tests

                                                                                 4000

                                                                                 3000
                                                                                                   2017         2018
                                                                                 2000

                                                                                                   2019         2020
                                                                                 1000

                                                                                     0

                                                                                                                                Week Commencing

         Figure 3. Historical Comparison of Weekly CrAg Tests in the Public Health Sector for the Period 3 February to 24 May, n = 72 144
         (dashed vertical lines represent lockdown events)

                                                                                                                                  4
Comparing the trends in weekly CrAg testing volumes during lockdown to those of 2017, 2018, and 2019
during the same time of year, CrAg testing in 2020 followed a similar trend leading up to lockdown as in
previous years (Figure 3). However, the decline in testing that began near the time of social distancing was
sustained at the onset of lockdown where a recovery was observed in previous years. A similarly pronounced
dip in testing numbers was observed across years, with exception of 2019, over the last 2 weeks of April, possibly
related to several public holidays occurring at this time. However, although 2020 trends resembled that of
previous years, overall testing numbers were considerably lower than those over the same period in the past. .
140
120
100
80
Total CSF+ Tests
60
40
2017 2018
20
2019 2020
0
Week Commencing
Figure 4. Historical Comparison of Weekly CSF-confirmed Cryptococcal Meningitis Cases in the Public Health Sector for the
Period 3 February to 24 May, n = 1 369 (dashed vertical lines represent lockdown events)
The numbers of laboratory-confirmed cases of cryptococcal meningitis during the lockdown period,
however, do not appear to have appreciably been affected when compared to previous years (Figure 4).
2017-2019 2020
Figure 5. Comparison of the Average of Total CD4 Tests < 200 cells/µL across 2017-2019 to the Total CD4 Tests < 200 cells/µL in
2020 over the same period of 27 March – 24 May, by district
5In terms of advanced HIV disease diagnosis, defined as CD4 < 200 cells/µL, a decline in total cases
detected was observed across all districts (n=52) in South Africa when comparing the first 8.5
weeks of lockdown period (27 March – 24 May) to the average of the same period for 2017-2019.
2017-2019 2020
Figure 6. Comparison of Average of Total CrAg Tests across 2017-2019 to Total CrAg Tests in 2020 over the same period of 27
March – 24 May, by district
The 2020 weekly average of CrAg test volumes exhibited a similar decline across all 52 districts over 8.5 weeks
of lockdown (27 March – 24 May) when compared to the average weekly average of tests for 2017-2019.
2017-2019 2020
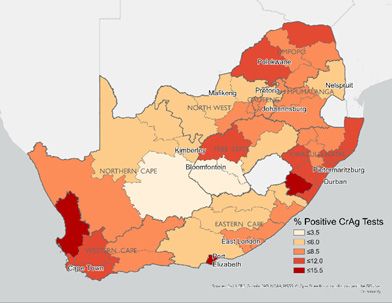
Figure 7. Comparison of the Percent Positive CrAg Tests from 2017-2019 to the Percent Positive CrAg Tests in 2020 over the
same period of 27 March – 24 May, by district
The proportion of positive CrAg tests during the 8.5-week lockdown period in 2020 increased
in 44 of 52 districts compared to the proportion of positive tests for 2017-2019. The proportion
of positive tests was lower than that of previous years in the remaining 8 districts, all rural
except one major metropolitan district – Buffalo City Metro containing the city of East London.
1
Average of total CD4 tests < 200 cells/µL across 2017-2019 calculated by adding all CD4 tests less than 200 cells/µL from 27 March to 24 May for 2017, 2018, and
2019 and dividing by 3
2
Average of total CrAg tests across 2017-2019 calculated by adding all CrAg tests from 27 March to 24 May for 2017, 2018, and 2019 and dividing by 3
6DISCUSSION
During the COVID-related social distancing and lockdown the lockdown period demonstrates that this effect of care-
period beginning on 16 March 2020, a general decline in CrAg seeking delay or avoidance due to lockdown restrictions
screening as well as diagnoses of advanced HIV disease and has occurred nationwide. An increase in the percentage of
cryptococcal antigenaemia was observed. Despite a higher positive CrAg tests in most districts may indicate that very
percentage of those CrAg-tested being identified as CrAg- ill individuals continued to seek care, while asymptomatic
positive, overall cryptococcal antigenaemia case numbers cases may have delayed seeking care and are currently
were still lower than expected compared to previous years. missed by routine screening, though further research will
This suggests that the COVID-related lockdown measures be required to confirm this. The 8 districts with a decrease in
may have led to fewer individuals seeking HIV care in which the percentage of positive CrAg tests were predominately
they would receive a CD4 count (i.e. baseline testing or re- rural, meaning that transportation may have presented
initiation of treatment) and subsequently be identified as an issue even prior to lockdown measures and may have
having advanced HIV disease and screened for CrAg. On been exacerbated by lockdown to the point that even
the other hand, CSF-confirmed diagnoses of cryptococcal individuals with symptoms of advanced HIV disease-related
meningitis do not appear to have been affected by illness were unable to seek care.15 One exception to this was
lockdown measures. We speculate that these observations Buffalo City Metro District, which contains the city of East
due to several factors, although these explanations are yet to London. It is unclear why both absolute numbers of cases
be confirmed. First, lockdown measures severely impacted and percentage of positive tests declined here, though East
the availability of public transportation and the ability of London did have several high-profile COVID outbreaks.
individuals to move freely beyond their homes. Secondly, This may have contributed to reduced HIV care-seeking
the treatment of COVID-19 cases at public health facilities behaviour by individuals in the area.
may have influenced some to avoid healthcare settings
and the perceived risk of COVID-19 exposure. These factors Given the decline in advanced HIV and cryptococcal
may have especially influenced individuals with mild or no disease testing during lockdown, it is likely that cases have
symptoms of advanced disease and cryptococcal disease or been missed. Ongoing surveillance will be important to
other opportunistic infections to delay or entirely avoid care- determine if these possible missed cases later lead to a spike
seeking.12,13 However, in the case of cryptococcal meningitis, in diagnosed cryptococcal meningitis. However, many AIDS-
the severity of symptoms and urgent need for medical care related deaths, including cryptococcal meningitis, occur
may have overridden the barriers encountered by lockdown outside the healthcare system and are thus beyond the
restrictions. 14 scope of routine laboratory-based surveillance, meaning
that even if a spike in cases or deaths does indeed occur, it
The decline in both advanced HIV disease and cryptococcal may go undetected. 16
disease case detection across all South African districts during
CONCLUSIONS
COVID-related lockdown measures put in place by the South African government in mid-March have had the unintended
consequence of reducing diagnosis of advanced HIV disease and cryptococcal antigenaemia. Increased vigilance in laboratory
and healthcare surveillance systems will be necessary to detect and respond to any subsequent increase in the development
of cryptococcal meningitis as well as other life-threatening opportunistic infections that may result from this.
7REFERENCES
1. Radha Rajasinghma, Smith RM, Park B, Jarvis JN, Govender N, Chiller TM, et al. Update on the Global Burden of Disease of
HIV-Associated Cryptococcal Meningitis. Unpublished. 2016;
2. Govender NP, Meintjes G, Mangena P, Nel J, Potgieter S, Reddy D, et al. Southern African HIV Clinicians Society guideline for
the prevention, diagnosis and management of cryptococcal disease among HIV-infected persons: 2019 update. South Afr
J HIV Med. 2019 Nov 8;20(1):16.
3.
4. National Institute for Communicable Diseases. GERMS-SA annual report [Internet]. 2017 [cited 2020 Jun 12]. Available from:
http://www.nicd.ac.za/publications/archives/
5. Kaplan JE, Vallabhaneni S, Smith RM, Chideya-Chihota S, Chehab J, Park B. Cryptococcal antigen screening and early
antifungal treatment to prevent cryptococcal meningitis: a review of the literature. J Acquir Immune Defic Syndr 1999.
2015 Apr 15;68 Suppl 3:S331-339.
6.
7. Govender N. Phased implementation of a public health programme: cryptococcal antigen screening and treatment
in South Africa [Internet]. 2017. Available from: http://www.nicd.ac.za/wp-content/uploads/2017/12/CAST_NET_4_
Jan_2017_protocol_V1_Submit.pdf
8. Govender NP, Glencross DK. National coverage of reflex cryptococcal antigen screening: A milestone achievement in the
care of persons with advanced HIV disease. S Afr Med J. 2018 Jun 26;108(7):534-535–535.
9. Calmy A, Ford N, Meintjes G. The Persistent Challenge of Advanced HIV Disease and AIDS in the Era of Antiretroviral Therapy.
Clin Infect Dis. 2018 Mar 4;66(suppl_2):S103-SS105.
10. Chihana ML, Huerga H, Cutsem GV, Ellman T, Goemaere E, Wanjala S, et al. Distribution of advanced HIV disease from three
high HIV prevalence settings in Sub-Saharan Africa: a secondary analysis data from three population-based cross-sectional
surveys in Eshowe (South Africa), Ndhiwa (Kenya) and Chiradzulu (Malawi). Glob Health Action. 2019 Dec 13;12(1):1679472.
11. World Health Organization. Guidelines for the diagnosis, prevention, and management of cryptococcal disease in HIV-
infected adults, adolescents and children. Geneva; 2018 Mar.
12. South African Government. COVID-19 / Novel Coronavirus [Internet]. [cited 2020 Jun 12]. Available from: https://www.gov.
za/Coronavirus
13. Bassett IV, Huang M, Cloete C, Candy S, Giddy J, Frank SC, et al. Assessing the completeness and accuracy of South African
National Laboratory CD4 and viral load data: a cross-sectional study. BMJ Open [Internet]. 2018 Aug 1 [cited 2019 Dec
10];8(8). Available from: https://bmjopen.bmj.com/content/8/8/e021506
14. World Health Organization. Social Stigma associated with COVID-19: A guide to preventing and addressing social
stigma [Internet]. 2020. Available from: https://www.who.int/docs/default-source/coronaviruse/covid19-stigma-guide.
pdf?sfvrsn=226180f4_2
15. Logie CH. Lessons learned from HIV can inform our approach to COVID-19 stigma. J Int AIDS Soc [Internet]. 2020 May 4
[cited 2020 Jun 12];23(5). Available from: https://www.ncbi.nlm.nih.gov/pmc/articles/PMC7197953/
16. Mapuroma R, Cohen C, Kuonza L, Musekiwa A, Tempia S, Tshangela A, et al. Healthcare seeking behaviour for common
infectious syndromes among people in three administrative regions of Johannesburg, South Africa, 2015: a cross-sectional
study. Pan Afr Med J. 2019;33:159.
17. Harris B, Goudge J, Ataguba JE, McIntyre D, Nxumalo N, Jikwana S, et al. Inequities in access to health care in South Africa. J
Public Health Policy. 2011;32:S102–23.
18. Karstaedt AS. Profile of cause of death assigned to adults on antiretroviral therapy in Soweto. S Afr Med J. 2012 Jun
28;102(8):680-682–682.
6Data Source
National Institute for Communicable Diseases, Centre for Healthcare-
Associated Infections, Antimicrobial Resistance and Mycoses
Contact
Prof Nelesh Govender:
neleshg@nicd.ac.za
Greg Greene:
gregg@nicd.ac.zaYou can also read