Data Mining Analysis on Ships Collision Risk and Marine Traffic Characteristic of Port Klang Malaysia Waterways from Automatic Identification ...
←
→
Page content transcription
If your browser does not render page correctly, please read the page content below
Proceedings of the International MultiConference of Engineers and Computer Scientists 2019
IMECS 2019, March 13-15, 2019, Hong Kong

         Data Mining Analysis on Ships Collision Risk
        and Marine Traffic Characteristic of Port Klang
             Malaysia Waterways from Automatic
               Identification System (AIS) Data
             M. Mustaffa, S. Ahmad, M.I.H.M. Nasrudin, K.A. Sekak, N.A. Aini, A.M.M.Ali, M.F.M. Taib,
                                M.Z.A.Yahya, O.H.Hassan, A.K. Razali, M.H.M.Jais

                                                                             in the highest level.
  Abstract— Port Klang is one of the busiest ports in the worlds                There are rapid increase in data receive each day as Port
  and have played an important role to ensure the import and                 Klang continue becoming one of the most important trading
  export activities towards Malaysian economy sector. Port
                                                                             hub in Malaysia. However, recent study show that with the
  Klang located in a busy marine sea route of Strait of Malacca
                                                                             North Sea route opening, the traffic pattern at Port Klang
  received a great amount of vessels making it a high density
  port and more likely exposed to the collision risk. From the               will be affected so that the ship collision risk is reduced [7,
  analysis of Automatic Identification System (AIS) data, the                8, 10]. The finding of the study shows that there will always
  marine traffic pattern of the study area will be characterized.            changes in the traffic pattern.
  The raw AIS data collected through AIS receiver that was
  installed at Universiti Teknologi Mara, Shah Alam, Malaysia.
  The data was collected from July 2016 until December 2016.                       II. AUTOMATIC IDENTIFICATION SYSTEM (AIS)
  A web-based application was developed to decode the raw                                       BACKGROUND
  data collected for analysis and characteristic purpose. The
  decoded raw data were presented statically and through                        AIS is system used on ships and by vessel traffic services
  graphical method. The variable that need to be consider such               (VTS) for tracking purposes. AIS contain a lot of data that
  as number of vessels, type of vessels, course over ground, and             have huge potential to be used as information in term of
  speed over ground of the vessels. The path for dangerous                   marine navigational safety. However there are few system
  category vessels was also plotted.                                         and method to analyze it to be transform to more useful
                                                                             data for the navigator. The marine traffic pattern of the
     Index Terms— AIS data, big data analysis, Data mining,                  study area is needed to be characterized [1].
  ship collision, traffics density, ship navigation.                            Due to the high number of traffic density, adding with
                                                                             geographically narrow strait, marine navigational hazard
                                                                             will emerge. Thus, an organized monitoring system of
                                                                             vessels traffic is an important aspect in marine navigation.
                           I. INTRODUCTION                                   One of the main focuses of application is to provide safe

  T   raffic density is an approach to studying the traffic flow
      and predicts its behavior in future time horizons. The
                                                                             navigation of strait waterways [6]. Collision can be prevent
                                                                             by appropriate training of officer in charge to analyze AIS
                                                                             data. [4, 5].
  definition of traffic density is relative to the traffics
  existence domain in the space or area as a time-varying                       AIS transponder is a compulsory equipment for each all
  high-level view of travel [11].                                            larger sea-going vessels (>300 GT), all passenger vessel
       Malaysia is a country that surrounded by sea. Thus, its               and new ship. AIS transponder need to be installed on
  economic trading activities have been depending on its                     board before allowed sailed on the sea [3]. The
  ports and shipping activities. Both ports and shipping are                 International Maritime Organization instructed the
                                                                             installation in order to ensure a safe navigation among
  crucial aspect to enhance Malaysian trade as the result, the
                                                                             ships [6].
  economic prosperity rise yearly [1]. Due to its location that
                                                                                AIS are designed to provide information about the ship to
  located in Straits of Malacca, Malaysia is one of the busiest
                                                                             other ships and to coastal authorities automatically for ship
  shipping waterways. Traffic pattern and ship collision risk                300 gross tonnage and above engaged on international
  is closely related in maritime study. Both aspects is                      voyages, cargo ships of 500 gross tonnage and upwards not
  important so that the safety aspect of marine navigation is                engaged on international voyages and all passenger ships
                                                                             irrespective of size[2].
     Manuscript received December 7, 2018. This work was supported by the
  Ministry of Higher Education, Malaysia under Fundamental Research Grant
                                                                                Characteristic of marine traffic pattern and density are
  Scheme (FRGS/1/2017/STG02/UITM/02/4).                                      more likely harder to be characterized. A study suggest a
     M. Mustaffa is with Faculty of Applied Sciences, Universiti Teknologi   visualization model using Automatic Identification System
  MARA,       40450     Shah    Alam,     Selangor,   Malaysia     (Email:
  masnawimustaffa@gmail.com).

ISBN: 978-988-14048-5-5                                                                                                         IMECS 2019
ISSN: 2078-0958 (Print); ISSN: 2078-0966 (Online)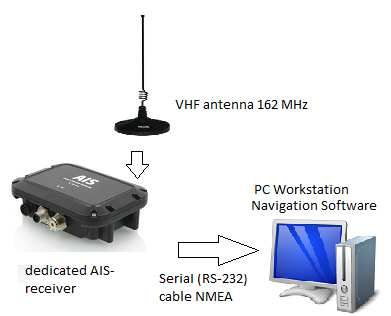
Proceedings of the International MultiConference of Engineers and Computer Scientists 2019
IMECS 2019, March 13-15, 2019, Hong Kong

  (AIS) to estimate the ship’s real-time maritime traffic         median for September is 211 vessels. The highest number
  situation [9]                                                   recorded is 275 on 13/09/2016 and 110 is the lowest on
                                                                  28/09/2016. The total number of vessels recorded is 5699
                                                                  vessels.
                     III. METHODOLOGY
                                                                     For October (Fig. 6), the median for is 202 vessels. The
     The raw data collected for this study is obtained from the   highest number recorded is 255 on 7/10/2016 and 94 is the
  AIS receiver which was placed on top of 5th floor building      lowest on 11/10/2016. Logically, the number is unreliable
  in our campus, Malaysia, at altitude of 31 meter and facing     since it is far off compared to the median value. The zero
  Port Klang waterways and Malacca Strait for a better            value from the graph on 12th, 15th, 16th, 17th, 25th, 26th,
  coverage.                                                       and 27th of October is missing from the AIS database.
                                                                  There are high likely there are certain number of vessels on
                                                                  the date. The total number of vessels recorded for October
                                                                  is 4846 vessels

                 Fig 1. Equipment Setup [8]

     The process of analyzing the raw has been developed in           Fig 2. Number of recorded ships from July 2016 to
  web-based environment and as a one-stop web-based                                   December 2016
  monitoring system [12,13]. This analyzing of raw data is to
  allow the loading of AIS files in its natural format which
  are process as discrete bundle of information. The AIS data
  collected by the receiver is in ASCII (American Standard
  Code for Information Interchange) data packet.

                 IV. RESULTS AND DISCUSSIONS
    A. Daily Data
     In general, the number of vessels trend is differ and
  unique from each month as shown in Fig 2. Besides, there
  are few unavailable set of data for several days in August,
  September, October, November and December. In July, the
  traffic pattern showing a clustered trend as shown in Fig 3.
  There are no particular trends showed by the number of
  vessels with total of 6731 vessels recorded. The highest
  number recorded is 275 vessels in 8/07/2016 and 6/07/2016               Fig 3. Marine traffic statistic for July 2016
  record the lowest number with only 107 vessels. The
  average number is 212 vessels. The total number of vessels
  recorded for July is 6580 vessels.
     For August as shown in Fig 4, the number of vessels is
  fluctuating each day with trend packing closely to the
  median of the graph. The median for August is 189 vessels.
  The highest number recorded is 263 on 16/08/2016 and 113
  is the lowest on 21/08/2016 and 23/08/2016. The total
  number of vessels recorded in August is 5693 vessels.
  There are no data recorded on 20/08/2016 and 26/08/2016.
     For September (Fig. 5), the number of vessels can be
  considered constant with ranging from 275 to 110 with no
  drastic change in the value except from 1st to 3rd of
  September 2016 where there are no data recorded. The
  anomaly in the trend might also due to the error. The                 Fig 4. Marine traffic statistic for August 2016

ISBN: 978-988-14048-5-5                                                                                             IMECS 2019
ISSN: 2078-0958 (Print); ISSN: 2078-0966 (Online)
Proceedings of the International MultiConference of Engineers and Computer Scientists 2019
IMECS 2019, March 13-15, 2019, Hong Kong
The number of vessels generally increasing each day August, 13th September, 7th October, 29th November and
with a decreasing start until 5/11/2016 before increasing 6th December as the date give the highest traffic density.
generally until the end of November as shown in Fig 7.
The median for is 198 vessels. The total vessel recorded is
B. Hourly Data
5141. The highest number recorded is 294 on 2911/2016
and 78 is the lowest on 20/11/2016. Logically, the number The pattern and statistical characteristic for number of
is unreliable since it is far off compared to the median vessels in hourly have been plotted as shown in Fig. 10. It
value. The zero value from the graph on 11th, 12th, 13th, divided into three main groups. The first group is morning
and 27th of November is missing from the AIS database. starting from 1 a.m.to 2 a.m., then 9 a.m. to 11 a.m. for the
There are high likely there are certain number of vessels on day groups. For evening group, 4 p.m. to 5 p.m. recorded
that date. There might be due to some errors occurs during the highest traffic density.
data collection period Risks of collision are more likely to occur during this
range of time stamp. However, the traffic flow is higher in
the morning group where there are big numbers of vessels
going in and out of the waterways thus increasing the
chance of collision. On the sample from 8th July, there are
31 vessels going in and out of the study location, the
highest for the morning group. The biggest number of
vessels going in and out was recorded on 16th August with
49 vessels. This indicates that the highest traffic density
doesn’t necessarily give the higher risk of collision.
Fig 5. Marine traffic statistic for September 2016
.
Fig 7. Marine traffic statistic November 2016
In the evening group, the biggest different was 76 vessels
making it having the highest risk of collision in term of
number of vessels in the time stamp. The data was collected
on 13th of September. In the other sample, the difference
are ranging only from 3 vessels to 10 vessels maximum
Fig 6. Marine traffic statistic for October 2016 making it low in risk collision
The number of vessels increasing each day up until
06/12/2016 where it reach the highest number of vessels C. Type of Vessels Data
recorded of 315 vessels in the month of December with as Type of vessels in the Port Klang waterway area was
shown in Fig 8. Then there are no AIS data received by the determined and recorded. There are more than 25 different
data receiver until 13th December. The median is 192 type of vessels manage to be recorded. From the total, few
vessels. The lowest number recorded is 108 on 31/12/2016. types was sorted out from the consideration of the study as
The total number of vessels recorded is 4799 vessels. their frequency using the Port Klang coastal area waterways
Fig 9 shows the statistical characteristic of number of are too small. In the day time, vessels such as fishing
vessels that use the Port Klang coastal area waterways vessels, law enforcer and pleasure craft only recorded in
throughout the study period. From the graph generally, the range of 0 to 5. Thus, the risk of collision for these types of
highest number of vessels recorded was on the middle of vessels is lower compared to other type of vessels.
the month. In the beginning and the end of the month, the Vessels such as carrier, cargo, container, tanker, tug,
pattern is not constant for each month. There are big vehicles and passenger carrier and others was identified as
different each month especially on the end of the study the dangerous type of vessels. Fig 11 shows the number of
period. For example November record its second highest vessels for different type of vessels for the highest density
while December record its lowest number of vessels. traffic day in each month through the study period. The
The daily heaviest traffic for each month have been type of vessels from 8th July, 16th August, 13th September,
recognized. The data was collected from 8th July, 16th 7th October, 29th November and 6th December was used.
ISBN: 978-988-14048-5-5 IMECS 2019
ISSN: 2078-0958 (Print); ISSN: 2078-0966 (Online)Proceedings of the International MultiConference of Engineers and Computer Scientists 2019
IMECS 2019, March 13-15, 2019, Hong Kong
Container and tanker is the most frequent vessels that travel
using Port Klang coastal area. Container and tanker is the
most frequent vessels that travel using Port Klang coastal
area.
Fig 11. Number of vessels for different type of vessels for
highest density day in each month
Fig 8. Marine traffic statistic for December 2016
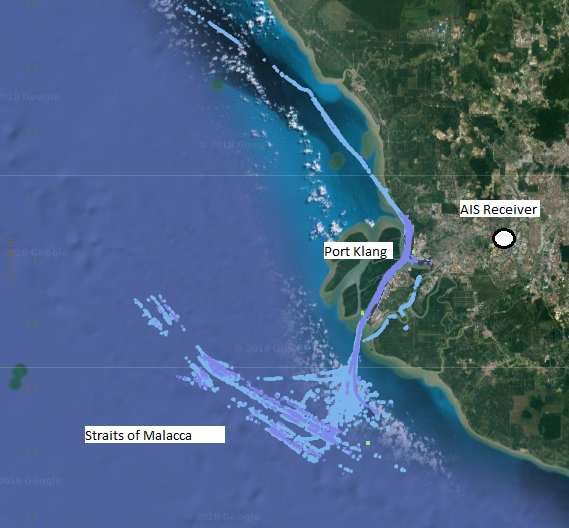
D. Vessels Trajectory
The general trajectory for dangerous category vessels
such container, and tanker was plotted on the satellite
image (Fig. 12) . Form the plotting of a sample from 8th of
July 2016, a general pathway of those type of vessels can be
determined. For the risk of ship collision, there are high
likely of occurrence because there are few data transmitted
when the vessels approaching Port Klang coastal area. The
AIS data received delayed for about 73 km from the last it
was transmitted. Although it was further from the Port
Klang coastal area where the density is higher, more
packed and congested, the delay of information is
dangerous as the information of the surrounding vessels is
Fig 9. Number of vessels recorded in the study area from
unknown. This make the decision making for a safer route
July to December 2016
that should be taken can’t be made in an appropriate time
range until the danger is too near. This make the risk of
collision are more likely to be happened in this type of
scenario.
Fig 10. Density of vessels by hour
Tanker and container generally become the most
frequent type of vessels using the study area waterways.
From the sample taken, on 8th July (31.21%), 16th August
(26.86%), 29th November (30.4%), and 6th December
(31.07%), tanker is the highest number of vessels recorded.
While the rest, 13th September (37.73%) and 7th October
(30.04%) recorded container as their highest number of
vessels using the waterways. Fig 12. Density of vessels trajectory
ISBN: 978-988-14048-5-5 IMECS 2019
ISSN: 2078-0958 (Print); ISSN: 2078-0966 (Online)Proceedings of the International MultiConference of Engineers and Computer Scientists 2019
IMECS 2019, March 13-15, 2019, Hong Kong
V. CONCLUSION [9] Cheng Tsou, “Online Analysis Process On Automatic
This study shows that the number of vessels using the Identification System Data Warehouse For Application In
study area waterways ranging from 78 vessels on 20th Vessel Traffic Service”, J Engineering for the Maritime
Environment, vol. 230, no. 1, pp. 199-215, Feb. 2016
November to the highest recorded on 6th December with
[10] M. Mustaffa, S Ahmad, N H Ahmat, "Mapping Vessel Path
315 vessels. of Marine Traffic Density of Port Klang, Malaysia using
The anomaly of data such as the big drop of number of Automatic Identification System (AIS) Data", International
vessels from day to the next day (6th to 7th December), Journal of Science and Research (IJSR), 4(11):245-248, Nov.
retrieve data for a few days, and big delayed of AIS data 2015, DOI: 10.21275/v4i11.NOV151099
transmitted by the vessels affect the study and data analysis [11] Masnawi Mustaffa, Shaharudin Ahmad, Radhiah Mohd Nor,
process as the exact value can’t be determined.. The result Nur Hidayah Binti Zahari, "Preliminary Study on Air Traffic
of the current study are necessary to characterize the Port Density of Peninsular Malaysia using Visual Flight Path
Klang coastal area. The risk of collision can be determined Trajectories from Automatic Dependent Surveillance-
Broadcast (ADS-B) Data", International Journal of
by taking a suitable precaution steps when the trend of high
Engineering & Technology (IJET), Vol 7, No 4.25 (2018),
density traffic pattern scenario emerge. So that the safety of DOI: 10.14419/ijet.v7i4.25.22238
the waterways of the study area can be improved as it play [12] Wan Faezah Abbas, Masnawi Mustaffa, Sulaiman Shaari,
an important role for nation economic trading. Ahmad Maliki Omar ,Helme Mohd Yusop, H.,
“Development of Photovoltaic Monitoring System", Web
Portal", International Conference In Software Engineering &
ACKNOWLEDGMENT Computer Systems 2009 (ICSECS'09), pp. 186-191, Jan
2009, ISBN: 967-5080-75-3
This research was supported by Fundamental Research [13] M. Mustaffa, W.F. Abbas, P. Mazlan, R.A.H.A. Kadir, L.
Grant Scheme (FRGS) Grant No. Rimon and A.R. Ghazali, H., “The Photovoltaic Monitoring
FRGS/1/2017/STG02/UITM/02/4. Author would like to Centre Portal: From Inception to Development and
thank Office of Research Management Centre (RMC), Maintenancel", 9th International Seminar in Sustainable
UiTM and Ministry of Higher Education for sponsoring the Environment & Architecture (SENVAR2008), , Jan 2008,
DOI: 10.13140/RG.2.1.5173.4485
research.
REFERENCES
[1] Harati-Mokhtari, A., Wall, A., Brooks, P., & Wang, J.,
"Automatic Identification System (AIS): Data Reliability and
Human Error Implications,” Journal of Navigation, vol. 60,
no. 3, pp. 373-389, Sep 2007.
[2] Jun Min Mou, Cees van der Tak, Han Ligteringen, "Study on
Collision Avoidance In Busy Waterways By Using AIS data,"
Ocean Engineering, ol. 37, no.5–6, pp. 483-490, April 2010.
[3] PAN Jiacai, JIANG Qingshan, HU Jinxing, SHAO Zheping,
“An AIS data Visualization Model for Assessing Maritime
Traffic Situation and its Applications”, Procedia
Engineering, vol. 29, pp. 365-369, 2012.
[4] Marine Accident Investigation Branch, "Report on the
investigation of the collision between ACX Hibiscus and
Hyundai Discovery in the approaches to the eastern
Singapore Strait TSS at 0756 local time on 11 December
2011", Southampton,U .K.: MAIB, pp. 39., June 2013.
[5] Muhammad Badrus Zamana, Eiichi Kobayashib, Nobukazu
Wakabayashic Adi Maimun, “Risk of Navigation for Marine
Traffic in the Malacca Strait using AIS”, Procedia Earth and
Planetary Science, vol. 14, pp. 33-40, 2015
[6] N.S.F Abdul Rahman , A.H. Saharuddin, R. Rasdi, “Effect
Of The Northen Sea Route Opening To The Shipping
Activities At Malacca Straits”, International Journal of e-
Navigation and Maritime Economy, vol. 1, pp. 85-98, Dec.
2014
[7] Hendra Saputra, Mufti Fathonah Muvariz, Sapto Wiratno,
Satoto, Jaswar Kotob “Estimation Of Exhaust Ship Emission
From Marine Traffic In The Straits Of Singapore And Batam
Waterways Using Automatic Identification (AIS) Data”,
Jurnal Teknologi, vol. 77, no. 23, pp. 47-53, 2015
[8] M. Mustaffa, M. Abas, S Ahmad, N. A. Aini, W. F. Abbas,
S. A. C. Abdullah, N. I. A. Razak, M. Y. Darus, "Marine
Traffic Density Over Port Klang, Malaysia Using Statistical
Analysis of AIS Data: A Preliminary Study", Journal ETA
Maritime Sci., vol. 6, pp. 333-341 , 2016, DOI:
10.5505/jems.2016.60352
ISBN: 978-988-14048-5-5 IMECS 2019
ISSN: 2078-0958 (Print); ISSN: 2078-0966 (Online)You can also read