COVID-19 modelling update: Considerations for a potential third wave - NICD
←
→
Page content transcription
If your browser does not render page correctly, please read the page content below

COVID-19 modelling update: Considerations for a potential third wave
29 April 2021

Purpose
The purpose of this brief is to assist government planners and decision makers as well as the general
public in tracking the start of a potential third wave, explore potential characteristics of a third wave,
and provide planning support in particular to the National and Provincial Departments of Health and
National Treasury. Note that the currently modelled scenarios do not yet include the impact of COVID-
19 vaccination and do not estimate the timing of a third wave, due to substantial uncertainty with
regards to the possible emergence of novel variants and the remaining unpredictability of a change in
population behavior. Lastly, while the five behavioural scenarios summarised below represent a
reasonable range of behavioral reactions to increasing case numbers, including new restrictions on
the part of the government and other individual-level behaviour modifications on the part of the
population, more extreme scenarios are possible, for example if there was better adherence to NPIs
during the third wave than during the second wave (which we believe to be unlikely), or if government
were to adopt no protective measures at all (which we believe to be equally unlikely).

 Summary:
 • In the absence of a new variant:
   • The peak of the 3rd wave is expected lower than the 2nd wave.
   • The time from initial increase in transmission to the peak is on average 2-3 months.
   • Across all age groups, hospital admissions are expected to be lower than levels in the 2nd
     wave.
   • Hospital admissions at a provincial level are dependent on the
      • seroprevalence after 2nd wave, age distribution, and prevalence of comorbidities
      • individual responses to increasing case numbers that reduce the potential for transmission
          (e.g., by reducing contacts)
      • strength of and adherence to restrictions.
 • Monitoring trends in cases is the best indicator of when a 3rd wave is likely to begin. The
   appendix has guidance on how to do this using the SACMC Epidemic Explorer.
 • The emergence of a highly transmissible new variant may result in a 3rd wave of the same size as
   the 2nd wave or worse, especially if the variant provides an opportunity for immune escape.
 • Delaying the start of the 3rd wave allows for more time for vaccination.
 • The size of the third wave depends in large parts on the number of contacts people have.

Please direct all questions concerning this report to Dr Harry Moultrie, National Institute of
Communicable Diseases (harrym@nicd.ac.za).

                                                                                                        1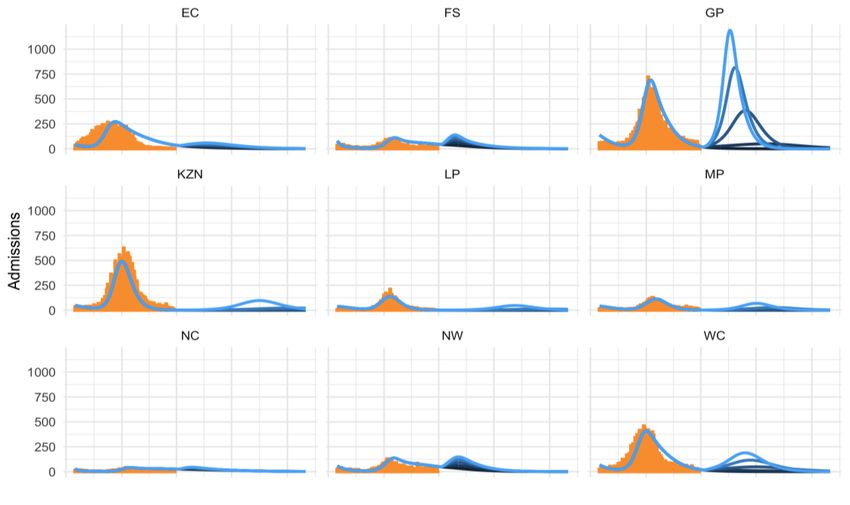
1. Potential drivers of a third wave
The most likely drivers of a third wave are a) behaviour change after the end of the last wave; b)
ongoing viral mutation; c) seasonal factors; and d) reinfection due to the waning of immunity
conveyed by previous infection.

Behaviour change includes increased contacts, especially during holiday travel and large events such
as religious gatherings, generally reduced adherence to non-pharmaceutical interventions (NPIs) such
as mask wearing, and the easing of restrictions. Viral mutation could lead to the potential emergence
of new, more transmissible and/ or fatal SARS CoV-2 variants and possible immune escape. Seasonal
factors, i.e. cold weather over the winter months, could increase transmission due to increased
contacts indoors, decreased ventilation, and/ or increased susceptibility to respiratory infections.
Finally, although previous exposure to SARS CoV-2 is high and rising in South Africa (see next
paragraph), immunity conveyed by previous symptomatic or asymptomatic infection may wane with
time.

2. Estimates of seroprevalence at the end of the second wave
A number of studies have estimated the seroprevalence of SARS CoV-2, a measure of previous
exposure to the virus, in South Africa between November 2020 and February 2021. These studies
covered locales in all provinces, with the exception of Limpopo, and different target populations, but
none were representative across provinces or the South African age profile. Additionally, studies
arrived at conflicting estimates for some provinces, such as Gauteng and Northern Cape where
average seroprevalence estimates between different studies decreased over time. The resulting
estimates by age show large variations within age groups, with wider ranges in the older age groups
due to small samples. Despite this, across months a clear upward trend is discernible, with most
estimates from January or February 2021 arriving at values of 30% to 40% seroprevalence. Lastly,
South African lineage data from GISAID, despite having small samples and being available for only a
few provinces, conveys a clear pattern of a fast takeover of the new variant, B.1.351, within a few
months.

3. Simulating a potential third wave
We have updated the National COVID-19 Epi Model to incorporate most of the aspects potentially
driving a 3rd wave mentioned above, in particular, behaviour change, seasonality, and reinfection.
However, we assume that for the next months, B.1.351 will be the only variant in circulation and do
not currently include the impact of additional viral mutation and immune take-over by a potential new
variant due to the uncertainty around the timing of the emergence and characteristics of these
variants. Additionally, we have stratified the model into 7 different age groups and, within the adult
population, into three different COVID-19 risk groups (healthcare workers, population with
comorbidities, and all other adults). We have calibrated the model to the seroprevalence data and the
data on the prevalence of the new lineage presented above as well as data on hospitalisations and
deaths during the second wave from the DATCOV database. (See the appendix for a short description
of the updated model, now called the National COVID-19 Vaccine Model.)

The results presented below focus on the impact of behaviour change, acknowledging substantial
uncertainty in the timing and the rate of change in both nationally directed and individual behaviour,
in particular reduced NPI adherence due to fatigue. In order to acknowledge this uncertainty, we

                                                                                                    2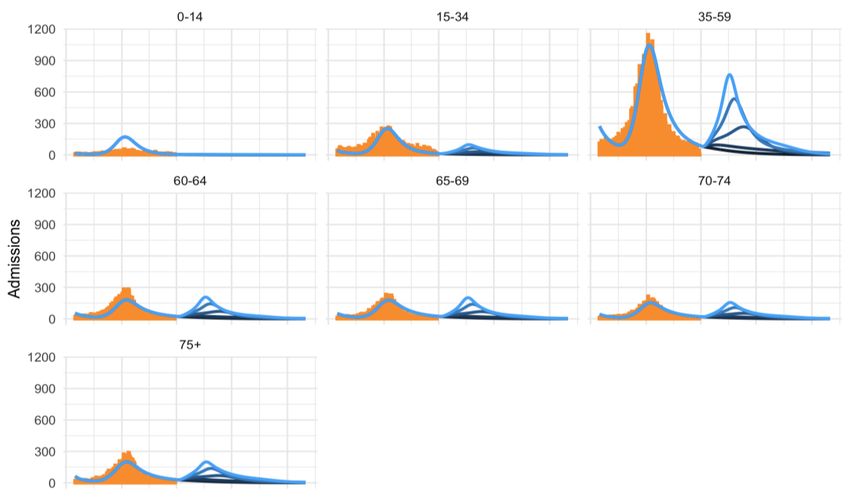
present the results of five main scenarios that characterise the responses to resurgence along a
spectrum of combined NPI adherence, and government restrictions, in response to a resurgence.

Across scenarios, in the absence of a new variant, we expect the peak of the 3rd wave to be lower than
the 2nd wave. We however see that a slow, weak behavioural response increases admissions for
severe/ critical COVID-19 cases across most age groups (Figure 1). Younger age groups are expected
to have fewer admissions than in the second wave. Our provincial projections (Figure 2) show
substantial variation of the size of the third wave between provinces, reflective of different age
distributions and prevalence of comorbidities, with the third wave being highest in GP across all
scenarios, due to the higher concentration of working-age adults and people with co-morbidities in
the province, and the lower estimates of seroprevalence. Across provinces, the time from initial
increase in transmission to the peak is on average 2-3 months. It should be noted however, that these
results are subject to substantial uncertainty due to the incompleteness of the seroprevalence and
other underlying data, and unknown future population behaviour. The model projections will be
updated as new data becomes available.

Figure 1: Third wave scenarios: Impact on hospital admissions, by age group (comparing 2nd and 3rd
waves)

Source: Orange bars: second wave data from DATCOV/ NICD; blue curves: Model projections

                                                                                                    3
Figure 2: Third wave scenarios: Impact on hospital admissions, by province (comparing 2nd and 3rd
waves)
Source: Orange bars: second wave data from DATCOV/ NICD; blue curves: Model projections
4. Quantifying the potential impact of a third wave
In summary, across all scenarios we estimated the impact of the third wave to be lower than that of
the first and, in particular, the second wave (Table 1). Importantly, there is a large variation between
the five third wave scenarios (Figure 3), stressing the impact that individual behaviour has on the size
of the next peak.
Table 1: Impact of 1st, 2nd and 3rd waves on hospital admissions, hospital deaths and total deaths
(numbers rounded to the nearest 100)
Wave 3
Wave 1* Wave 2** Fast, strong Slow, weak
response response
Hospital admissions 104,100 150,000 11,100 100,500
Hospital COVID-19 deaths 18,600 34,300 4,600 40,000
All COVID-19 deaths (in and out
40,000+ 88,500+ 7,800 70,200
of hospital)
* 5 March 2020 – 30 September 2020
** 1 October 2020 – 31 March 2021
+
estimated at 85% of excess deaths1
1
Correlation Of Excess Natural Deaths With Other Measures Of The Covid-19 Pandemic in South Africa. Burden
of Disease Research Unit, South African Medical Research Council (23 February 2021).
https://www.samrc.ac.za/sites/default/files/files/2021-03-03/CorrelationExcessDeaths.pdf
4Figure 3: Impact of 1st, 2nd and 3rd waves on hospital admissions, hospital deaths and total deaths
5Appendix
The National COVID-19 Vaccine Model (NCVM)
The National COVID-19 Vaccine Model (NCVM) is an epidemiological model that has been adapted
from the National COVID-19 Epi Model (NCEM) which was developed by the South African COVID-19
Modelling Consortium and applied to the first wave of the South African epidemic. The NCEM is a
stochastic compartmental transmission model that estimates the total and reported incidence of
COVID-19 cases, hospitalisations, and deaths in South Africa. The spatially-explicit model is calibrated
to model the spread of infection in the 9 provinces of South Africa. The model follows a generalised
Susceptible-Exposed-Infectious-Removed (SEIR) structure accounting for disease severity
(asymptomatic, mild, severe and critical cases) and treatment pathways (outpatient services, inpatient
non-ICU and ICU beds). The National COVID-19 Vaccine Model has been adapted from NCEM to
incorporate additional features suitable to modelling vaccination and the B.1.351 lineage now
prevalent in South Africa. The NCVM is a stochastic, multi-strain, age-structured, compartmental
model of COVID-19 (Figure A1).
Figure A1: The National COVID-19 Vaccine Model
People with
Health workforce All other adults
comorbidities
6The model’s additional features include:
Age structure: The population has been subdivided into age classes accounting for age-related
differences in susceptibility to and severity of COVID-19 and to allow for age-related disease
characteristics and age-targeted vaccination.
Multi-strain: Both the wild type SARS-CoV-2 infection and the new lineage (B.1.351)
dominating transmission in South Africa’s second wave of infections have been incorporated.
The structure assumes no co-infection but allows natural immune escape after infection with
wild type virus, allowing people to be infected with the new lineage. Likewise, imperfect
natural immunity allows reinfection with the same lineage, with a lower transmissibility.
Vaccination: The model has been developed to account for vaccination of the susceptible and
naturally immune populations with vaccines of 1 or 2 doses allowing for vaccine waning,
imperfect protection and the ability to protect against infection or disease.
Priority populations: Age-stratified priority populations are defined as Healthcare Workers,
Population with Comorbidities and Everyone Else with the ability for future vaccine
distribution to be tailored to these populations with respect to the type of vaccine, the timing
of vaccination, and population age (Figure A2). The transmission characteristics of priority
populations are also captured.
7Guidance on the use of SACMC Epidemic Explorer resurgence metrics to detect the start of
a new wave2
A new wave at the provincial or national level is currently declared when 7-day moving average of
case incidence reaches 30% of the previous peak. It is important to note that, when possible,
protective action should be taken in response to the resurgence metrics well in advance of the new
wave threshold being crossed. An early response is necessary to reduce transmission, which can
reduce the size of the peak and may even prevent a new wave. Non-pharmaceutical interventions like
masking, social distancing and other precautions, necessary to ensure cases remain at low levels
across the country, become even more important as cases start to increase.
The SACMC Epidemic Explorer dashboard (https://sacmcepidemicexplorer.co.za/) can be used to
monitor for increasing case trends in your province or district. The main dashboard metrics are:
• Upticks and upswings are both ways of detecting consistently increasing case numbers. Upticks
measure increases that occur day after day. Upswings indicate increasing trends but allow for more
variation from day to day.
• A sustained increase is a composite metric built from upticks and upswings and indicates a
consistent increase over more than a week. Stretches of orange in the Sustained Increase Monitoring
plots are cause for concern.
• The case threshold metric describes the weekly number of cases per 100,000 people.
• The percentage change metric describes how much incidence has changed over the last seven days.
Positive values indicate increases. This metric is particularly sensitive when case numbers are small
and should never be considered on its own. (For example, an increase of 10 cases from 100 cases to
110 cases is a +10% change, whereas an increase of 10 cases from 5 cases to 15 cases is a +200%
change.)
The following occurrences (alone or simultaneously) provide a strong warning that a new wave might
be beginning:
• A sustained increase that lasts for a week or longer
• Moderate or large increases in weekly incidence of (percent change metric >10%) when case
numbers already high (case threshold metric > 30 new cases per week per 100,000 population).
The following occurrence is also of concern but not necessarily a strong indicator of a new
wave beginning:
• Large increases in weekly incidence of (percent change metric >20%) when case
numbers are moderate to high (case threshold metric between 10-30 new cases per
week per 100,000 population).
2
Terms in bold and blue refer to SACMC Epidemic Explorer tabs and metrics of the same name. These metrics
are explained in more detail on the individual tabs on the Resurgence Analytics page of the dashboard, with
examples available through the green buttons.
8You can also read