Understanding the Demand for Uber Air - SCAG Modeling Task Force May 22, 2019 - Southern California ...
←
→
Page content transcription
If your browser does not render page correctly, please read the page content below
Understanding the
Demand for Uber Air
SCAG Modeling Task Force

May 22, 2019

Agenda

01 Urban Aerial Ridesharing
02 Demand Modeling Motivations
03 Survey Overview
04 Basic Data Exploration
05 Models & Applications
06 Conclusions & Next Steps
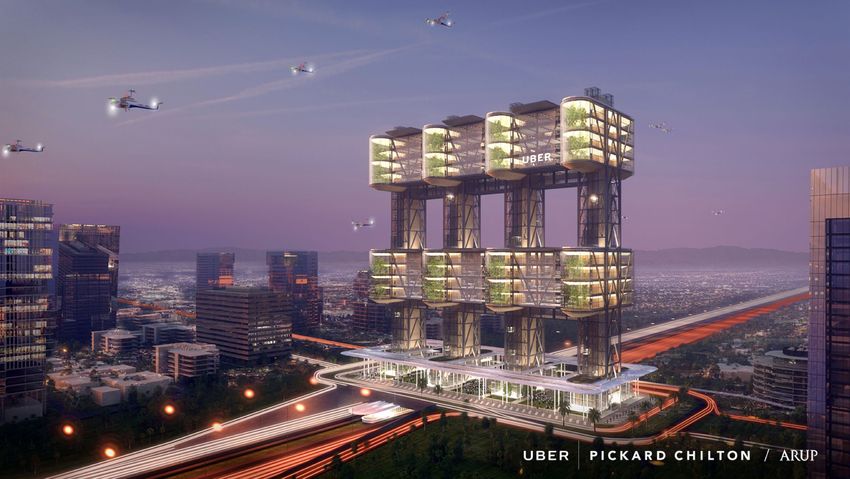
Urban Aerial
Ridesharing
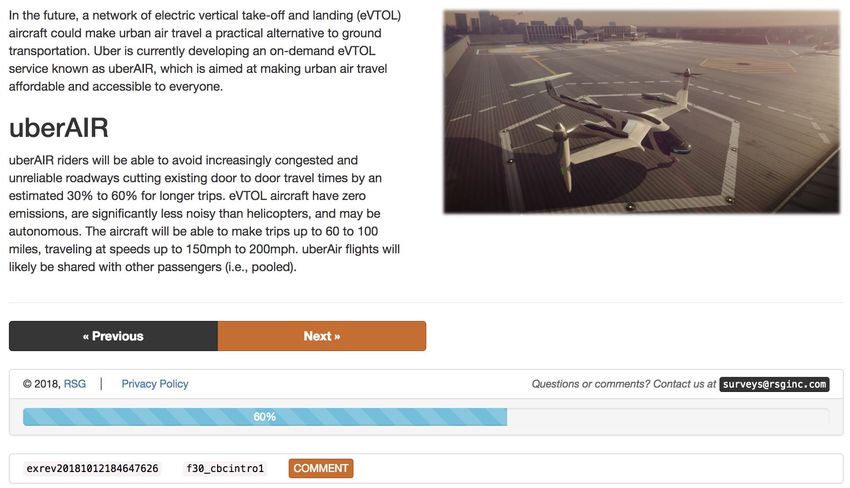
Urban aerial ridesharing
open up immense
mobility bandwidth.

Vision

Uber Elevate team envisions a future when
people can push a button and get a flight on
demand.

         “Fast-Forwarding to a Future of
         On-Demand Urban Air Transportation”
         released October 27, 2016

         https://www.uber.com/elevate.pdf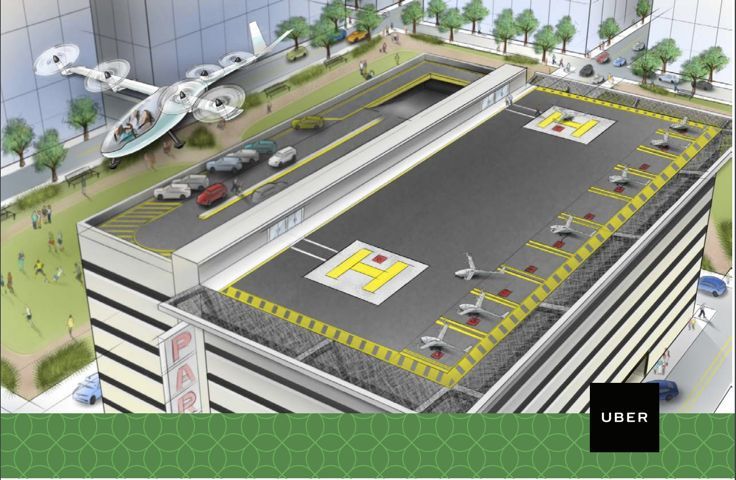

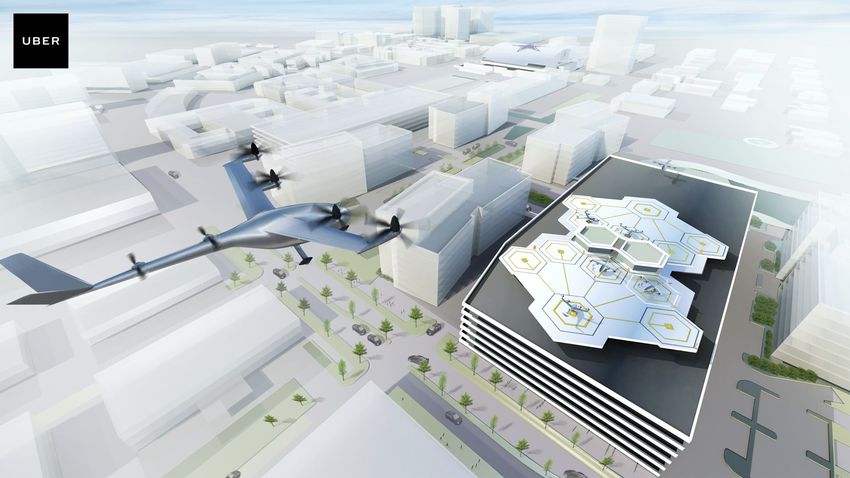
Uber Air Network at Scale
Timeline

                                          Path to scale
  Summit
                                          2024
  2019

           Demonstrator   Uber Air
           Flight         Launch
                          2023
           2020
                          LA, DFW, Intl
Motivations
Motivation

As we continue to lay the technical, operational,
and policy foundations for commercial operations
in 2023, we need to understand what the future
Uber Air network will demand from us.
How do we predict the future?

Market Size                                   Network Design                              Hardware Requirements
How many people will want to use an           Where are the optimal locations to build    How should VTOL and battery hardware
aerial ridesharing service? Can this really   Skyports? How do Skyport networks need to   be designed? How sensitive are key metrics
be a service for the masses? How do people    evolve over time? What levels of            like throughput and profitability to various
trade off time, inconvenience, and cost?       throughput do Skyports need to serve?       design decisions?
Tools

Flux Optimizer is a set of tools and algorithms that
enable us to simulate what the Uber Air network
could look like.

        Demand    Node              Dynamic
        Model     Optimization      Routing
Demand Modeling
Mode    Induced
Shift   Demand
population movement:

Location based service
data + SCAG model

45M
Total Addressable
Market
Survey Overview
Social    Airport

                                      Commute   Events

                                      Errands   Leisure

Which mode are you going to choose?
Stated Previous travel behavior
What transportation modes have you used in
the last month? What have you taken trips for
Vehicle Ownership Conjoint
Given different price points of traditional
vehicle, autonomous vehicle and other
Preferences in the past? rideshare services, if you had to replace your
up to three of your household vehicles, what
would you do?
Survey
Reference trip information Sociodemographics
Outline Think of a recent trip you took. What was it
for? When did you take it? How often do you
What is your household income? Household
structure? How many cars do you own?
make this trip? How much did you pay for it? What’s your age? Gender?
Mode Choice Conjoint Attitudes and Perceptions
Based on the transportation options and Are you an early adopter? Would you fly in a
attributes presented, which one would you small plane? Do you think autonomous
pick for your reference trip in a future with vehicles will be mainstream in the near
AVs and Uber AIR? future?Uber Air Intro
Respondents Overview

2
Markets (Dallas & LA),
                           ~50%
                           Evenly distributed across two
                                                           ~3K
                                                           Total qualified respondents
Uber cohorts and           markets: 1,499 from LA and      for the mode choice conjoint
general population         1,532 from DFW

22%
Respondents rejected due
                            68%
                            Respondents’ reference trip
                                                             29%
                                                             882 respondents are Uber
to geographic screening     over 7 miles haversine           cohorts: airport travelers,
                            distance                         commuters, venue goers,
                                                             frequent users
Conjoints Overview
10
Mode choice scenarios for
8
Mode alternatives include
~21K
Number of scenarios where
each qualified respondent personal vehicle, transit, single Uber Air is present
rideshare, pooled rideshare,
Uber Air, taxi, bike, scooter
3
Vehicle ownership choice
2+9
Ownership and other
~4K
Total vehicle ownership
scenarios for each qualified primary mode vehicle survey respondents
respondent replacement alternativesExperiment Design Space
(PART)
Mode Options Shown Operator Types Additional Passengers Price Travel Time
Logic Attribute Attribute Attribute Attribute
Single ridesharing Always - Human Driver N/A 6 levels Total travel time (6 levels)
(e.g. uberX) - Autonomous
Pooled ridesharing Always - Human Driver - Up to 1 additional pax 6 levels Total travel time (6 levels)
(e.g. uberPool) - Autonomous - Up to 3 additional pax
- Up to 5 additional pax
Transit Always N/A N/A 6 levels Total travel time (6 levels)
(rail, subway, bus)
Personal Vehicle If available N/A N/A N/A Total travel time (6 levels)
uberAIR Long trips - Human Driver - No other pax 6 levels - Access time (6 levels)
- Autonomous - Up to 1 additional pax - Wait time (6 levels)
- Up to 3 additional pax - Flight time (6 levels)
- Egress time (6 levels)Survey Overview (Scenario Example)
Survey Overview (Scenario Example)
Basic Data
Explorations
Survey Overview
Survey Overview (Representativeness)

Respondents                                                            Census
Respondents had to be over 18 years old to participate in the survey   This is the Texas age population pyramid based on US Census
and their age was provided in ~5-year bins up to 70 years of age.      estimates for 2015, which should be somewhat indicative of the
                                                                       population distribution in Dallas. Note the apparent difference on the
                                                                       younger male subpopulation.
Survey Overview (Representativeness)
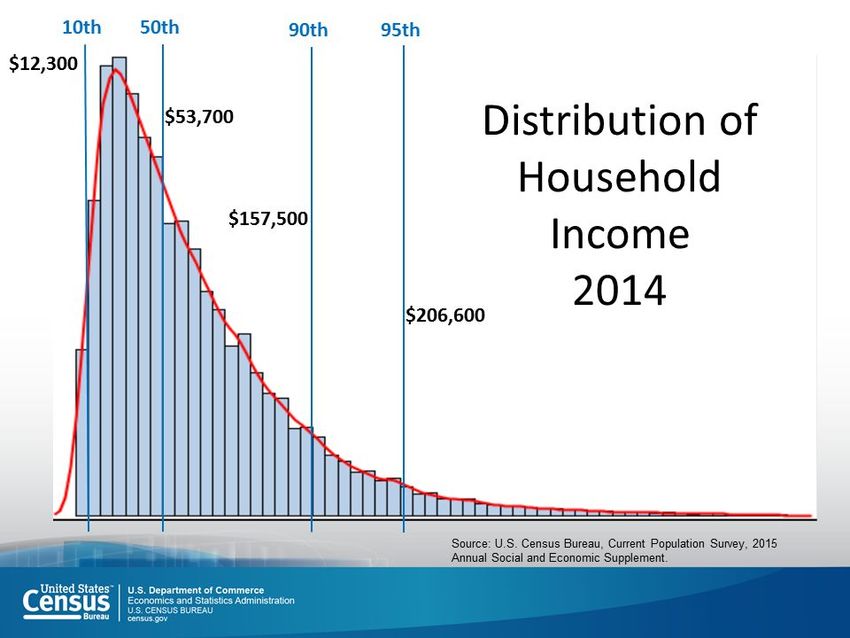
$12,300
Respondents Census
Most respondents provided their annual household income levels This is the distribution of US household income in 2015, including the
(before taxes), which were recorded in bins specified by the following {10, 50, 90, 95} quantiles. Note the similarity with the income
income level thresholds ${0, 35, 50, 75, 100, 150, 200, 250, 500}. distribution in our sample.Survey Overview (Representativeness)
+ +
Respondents NHTS
The histogram reveals a higher frequency of lower vehicle households, Higher frequency of {2, 3, 4}-vehicle household at the expense of lower
which could be due to the oversampling of the Uber user cohort. vehicle household numbers. Limited to Core Based Statistical Areas for
LA & Dallas (31080, 19100).Survey Overview (Representativeness)
Respondents NHTS
Distribution based on the respondents’ best guess of their annual VMT. Annual VMT distribution based on 23,630 vehicles from the two
relevant CBSAs in this study.Survey Overview Sample vs NHTS # veh Differences caused by oversampled 0-veh households in Uber cohort and 1-veh households in the respondent population.
Model Estimation
and Application
Mode Choice                                                                        Which mode to take
                                                                                       for the ODT

 Specification
                                                               Personal                    Single         Pooled
                                                                          Transit                                    Uber Air
                                                                Vehicle                  Rideshare       Rideshare

Main components:
 ●   Total travel time
 ●   Trip fare interacted with trip purpose, income and trip distance
 ●   Trip attributes, e.g. pooling, autonomy, reference mode
 ●   Person characteristics, e.g. age, gender, income
What input data do we
need?
Individual
demographic Attributes of But what about
information and different modal the attributes of
trip data choices UberAIR?
We get this from ODT. We get this from Map
Services for existing
modes.Uber AIR attribute
generation using Flux
Economic Model Node Opt Vehicle Model
Fares Skyport
Vehicle Speeds
(first and last mile, flight) Locations
First and Last Flight time
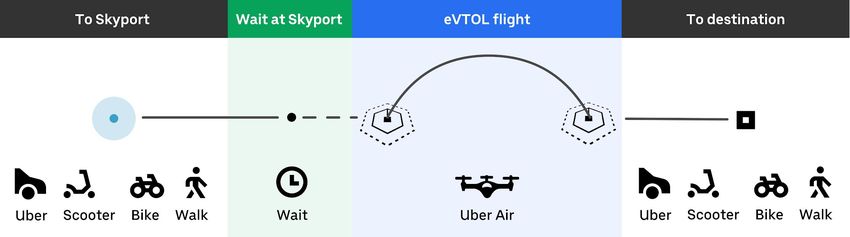
mileApplication Trip data + Ground Modes
attributes (Map
demographics
Services)
Input:
clustering
● City ground movements Vehicle
nodes/ Fare
speed
○ Trips + inferred demographics optimized structure
TAM profile
○ Map services nodes
● Choice model coefficients
○ Estimated from stated preference survey
● TAM criteria odt:
○ Distance criteria uber Air itinerary
(multiple), ground
○ Time saving criteria
modes itinerary
● Candidate nodes / optimized nodes
● Uber Air fare structure
● Observed preferences for calibration (SCAG data)
Choice model
odt:
uber Air itinerary
(multiple), ground
modes itinerary
Node
Micro-simulate
Optimization
trip request
Engine
UBER CONFIDENTIAL & PROPRIETARYModel Calibration
Why should we calibrate?

We previously assumed that      alternative-specific constant         This ASC term might not be
the error term is independent   (ASC) in the utility equation         the same as that of the
and identically distributed.    captures average error of             population.
                                unobserved attributes for             We will adjust the constant such that mode
                                that alternative                      choice percentages generated by the model
                                                                      match that of actual mode choice selections.
                                                                      Of course, we remove UberAIR from the
                                                                      model in order to compare it with actual
                                                                      data. Where do we get the data?
                                where the deterministic part of the
                                formulation is

                                             +C              +C
Calibration procedure
1. Original ASCs
2. Calculate aggregated
mode shares using the
ASCs
3. Adjust the ASCs by adding
the log of the ratio of target
share to calculated share.
Reference:
Discrete Choice Methods with Simulation, Kenneth Train.
4. Update ASCs
End if reach convergence.
Else, go back to step 2Data Inputs Southern California Association of
for Governments Regional Demand Model
Output Matrix
Calibration
We need to combine city data with our Have build a complex regional travel model for
internal rideshare data to generate the most
their constituent counties.
accurate view of current mode choices.
Number of Trips beyond seven miles by mode
and trip purpose in SCAG used as target market
share.Conclusion and Next Steps
Assumptions to
keep in mind

ODT input data is not 100%                     SCAG model results are not                         The Stated Preferences
of the population                              actual.                                            survey is a sample of stated
Trip flow derived from mobile services is a     SCAG modeling is a complex series of               behaviors.
sample collector and aggregator. It covers     processes that attempts to build out the
                                                                                                  There can be inconsistencies between
about 20-30% of the trips made in a given      regional transportation model from scratch.
                                                                                                  respondents’ stated behavior and their actual
area. The remaining is extrapolated from the   We treat it as a source of truth, but the actual
                                                                                                  behavior. Moreover, the respondents are only
initial.                                       ground truth is probably different.
                                                                                                  a sample of the general population.
Conclusions & Future Work
Uber Air product insights Model framework to
Males with higher income, millennials, for understand future mobility
airport trips. As a multimodal journey, people
We have built out a model framework and
are looking forward to a seamless trip detailed steps to solve these subproblems,
experience. People at this moment still
that can be shared with autonomous vehicles
express disutility toward autonomy.
or new mobility teams.
THANK YOU!
More complex specs Model calibration and
The results in this presentation use relatively validation
simple choice model specifications. Other
We have reached out to South California
specifications like LCCM could lead to more
Association of Governments to request their
detailed market segmentations. The survey
regional model result to calibrate the choice
also includes attitude & preference questions
model. Same procedures are being done for
that could be used to improve our market
Dallas.
segmentations.You can also read