Employee Attrition Predictive Model Using Machine Learning - IRJET
←
→
Page content transcription
If your browser does not render page correctly, please read the page content below
International Research Journal of Engineering and Technology (IRJET)                                          e-ISSN: 2395-0056
         Volume: 07 Issue: 05 | May 2020                   www.irjet.net                                              p-ISSN: 2395-0072

         Employee Attrition Predictive Model Using Machine Learning
  Adarsh Patel1, Nidhi Pardeshi2, Shreya Patil3, Sayali Sutar4, Rajashri Sadafule5, Suhasini Bhat6
          1,2,3,4Student, Dept. of Information Technology Engineering, P.E.S’s Modern College of Engineering,
                                                       Pune, Maharashtra, India
       5,6Asst. Professor, Dept. of Information Technology Engineering, P.E.S’s Modern College of Engineering,

                                                       Pune, Maharashtra, India
---------------------------------------------------------------------***---------------------------------------------------------------------
Abstract - Employees are considered as backbone of an                    Dissatisfaction, salary not as per expectation, poor
organization. Success or failure of the organization depends             relationship with team members, poor working
on the employees who work for an organization. The                       environment, lack of opportunity for career development,
organizations have to face the problems when trained, skilled            overtime, workload etc. In order to tackle this issue, we
and experienced employees leave the organization for better              developed a system that uses employee data to analyze
opportunities. The study was mainly undertaken to identify               reasons for employee attrition. This application is applicable
the dissatisfaction factor of employees and for what reasons             for employees who have completed their probation period. If
they prefer to change their jobs. Once the dissatisfaction               the employee has recently joined the organization, then it is
factor/s of employees has/have been identified, the                      difficult to predict their dissatisfaction factors as they are not
organizations can take actions accordingly and it may help               a confirmed employee before their allocated probation
them to reduce the attrition rate. In this paper we try to build         period.
a system which will predict employee attrition based on
Employee dataset from Kaggle website. We generated                       This system is able to predict which employee may leave an
heatmap to show the relations between the attributes. For                organization with what reason, so that they can take several
prediction purpose, we have used four different machine                  corrective actions in order to ensure that employees stay in
learning algorithms such as KNN (K-Nearest Neighbor), SVM                the organization and can reduce the attrition. Some of the
(Support Vector Machine), Decision Tree, Random Forest. This             employee retention strategies to control attrition are
paper suggest reasons which optimize the employee attrition              motivating employees, expose employees to newer roles,
in any organization.                                                     taking constant feedback from employees, etc. We applied
                                                                         different machine learning algorithms such as SVM (Support
Key Words:      Dissatisfaction factor, Organization,                    Vector Machine), KNN (K-Nearest Neighbor), Decision Tree
Attrition, Predict Employee Attrition, Employee-                         and Random Forest. Graphical representation is also
Attrition dataset, Machine Learning Algorithm.                           provided for better understanding of insights.

1. INTRODUCTION                                                          1.1 Literature Review

Employee Attrition is a reduction in manpower in any                     Employee Attrition is mainly the normal flow of people out
organization where employees resign [1]. Employees are the               of an organization, due to career or job change, relocation,
valuable assets of any organization. It’s necessary to know              illness and so on [2]. Employee Attrition is the percentage of
whether the employees are dissatisfied or are there any                  employees leaving the organization for what so ever reasons.
other reasons for leaving the respective job. These days for             Employees can leave the organization for many personal as
better opportunities, employees are eager to jump from one               well as professional reasons. So basically there are two types
organization to other. But if they leave jobs unexpectedly, it           of turnover, one is voluntary turnover which is decided by
may cause huge loss for organization. New hiring will                    the employee, and the other type of turnover is decided by
consume money and time, and also the freshly hired                       the company and that is why it is called involuntary turnover
                                                                         [6]. Involuntary turnover generally happens when
employees take time to make the respective organization
profitable. Retention of skilled and hardworking employees               performance of the employee is not up to the expectations.
is one of the most critical challenges faced by many                     Retention is also necessary for the growth and stability of an
organizations. Hence, by improving employee satisfaction                 organization [6]. The high attrition rate causes when there
and providing a desirable working environment, we can                    are more employment opportunities in the market. Currently
certainly reduce this problem significantly [1]. When an                 the employee attrition is one of the major issue faced by HR
Employee leaves an organization, the reasons are                         managers. There are so many working employees who are
determined by a variety of factors, some of the reason of                not satisfied due to one of the aspect which is not fulfilled by
leaving the organization could be better-paying job outside, a           the organization which results in higher attrition rate.
bad relationship with boss, pursuing higher studies,
relocating due to family reasons, fired from organization, job

© 2020, IRJET       |       Impact Factor value: 7.529        |    ISO 9001:2008 Certified Journal             |   Page 3855
International Research Journal of Engineering and Technology (IRJET)                                   e-ISSN: 2395-0056
         Volume: 07 Issue: 05 | May 2020               www.irjet.net                                           p-ISSN: 2395-0072

2. DESIGN AND ARCHITECTURE                                            3.1.1 K-Nearest Neighbors

                                                                      K-Nearest Neighbor is considered a lazy learning algorithm
                                                                      that classifies data sets based on their similarity with
                                                                      neighbors. It is one of the most fundamental and simple
                                                                      classification methods and one of the best choices for a
                                                                      classification study of the data [7]. The classification using
                                                                      KNN involve determining neighboring data points and then
                                                                      deciding the class based on the classes of the neighbors.

                                                                      3.1.2 Support Vector Machine

                                                                      Support Vector Machine is kind of classification technique. It
                                                                      is a model used for classification and regression problems. It
                                                                      can solve linear and non-linear problems. The idea of SVM is
                                                                      simple: The algorithm creates a line or a hyper plane which
                                                                      separates the data into classes [9]. When unknown data is
                                                                      given as input it predicts which class it belongs to. The
                                                                      margin between the hyper plane and the support vectors are
                                                                      as large as possible to reduce the error in classification.
              Fig 2.1 - Architecture Diagram
                                                                      3.1.3 Decision Tree
The proposed system consists of different machine learning
algorithms. To build model, we take employee dataset which            As the name implies all decision tree techniques recursively
includes all past and present records of the employees, then          separate observations into branches to construct a tree for
we perform data preprocessing (Data Preprocessing is that             the purpose of improving the prediction accuracy. Decision
step in which the data gets transformed, or encoded, to bring         tree is a conventional algorithm used for performing
it to such a state that the machine can easily analyze it). We        classifications based on the decisions made in one stage. This
have divided dataset into two parts one is train data and             provides tree structured representation of the decision sets
second one is test data. Most of the data is used for training        [10].
and smaller portion of data is used for testing (Train: 70%,
Test: 30%). The aim of training is to make a prediction
correctly as often as possible. The test data is used to see
                                                                      3.1.4 Random Forest
how well the machine can predict new answers and to
                                                                      Random Forest is used for both Classification and Regression
validate machine learning model behavior.
                                                                      problems in ML. It is based on the concept of ensemble
Afterward, using different machine learning algorithms we             learning, which is a process of combining multiple classifiers
have build the model. After building model, user can give the         to solve a complex problem and to enhance the performance
new input data to the system. Furthermore, user can choose            of the model. Instead of depending on one decision tree, the
algorithm according to their choice and check the result.             random forest takes the prediction from each tree and
Output of the system is in two forms - one is graphical               prediction which have majority of votes will be the final
representation and other is in polar form that is ‘Yes’ or ‘No’       output. As the number of trees increases the accuracy also
format. After evaluating result the reason behind the                 increases and prevents it from the over fitting problem.
attrition is also given by the system.
                                                                      3.2 Dataset Analysis
3. TECHNOLOGIES USED IN THE PROPOSED SYSTEM
                                                                      Data collection refers to the collection of relevant data from
3.1 Machine Learning                                                  all available sources to perform analysis. The data used for
                                                                      this employee attrition analysis was obtained from Kaggle
Machine Learning is most important technology towards                 Website [11]. This data set contains 1470 records and 35
data analysis for quality prediction and evaluation. There            attributes. The categorical values are converted to numeric
are various algorithms in machine learning which are used             values in order to make the classification algorithm more
to predict the appropriate class of new or unseen data. In our        effectual. For example, categorical attribute ‘Business Travel’
system we used different machine learning algorithms to               contains three values such as Travel-Rarely, Travel-
find out the reasons for employee attrition. The machine              Frequently, Non-Travel. Hence it is converted to 1, 2 and 3
learning algorithms which are used in system are described            respectively.
below:

© 2020, IRJET      |    Impact Factor value: 7.529        |       ISO 9001:2008 Certified Journal        |   Page 3856
International Research Journal of Engineering and Technology (IRJET) e-ISSN: 2395-0056
Volume: 07 Issue: 05 | May 2020 www.irjet.net p-ISSN: 2395-0072
3.2.1 Heatmap
Fig. 3.3
Fig. 3.3 represents the bar graph of the Department verses
Attrition. In sales department there are total 446 employees
and out of that 92 are leaving so attrition rate is 20.63%.
Likewise in research and development department out of
961 employees 133 are leaving so attrition rate is 13.84%.
There are 63 employees in human resource and 12 are
Fig. 3.1 - Heatmap leaving so attrition rate is 19.05%.
The above Fig. 3.1 represents the heatmap which helps to
identify attributes with the strong or weak correlation.
3.2.2 Some graphs with explanation
Here are several graphs generated by the system with
respect to attrition:
Fig. 3.4
Fig. 3.4 represents the bar graph for Gender verses Attrition.
There are total 882 male employees out of which 150 are
leaving, so the attrition rate is 17.01%. Likewise total 588
employees are female out of which 87 are leaving, so the
attrition rate is 14.80%.
Fig. 3.2
Fig. 3.2 represents the bar graph of comparison among the
Business Travel with respect to Attrition. Attrition rate of
Travel Rarely is 14.96%, Travel Frequently is 24.91% and
Non-Travel is 08.00%. Attrition rate of Travel Frequently is
higher than other as there are 277 employees who are under
the category of Travel Frequently and there are 69
employees who are leaving the organization. There are 1043
employees who Travel Rarely and out of which only 156
employees are leaving hence the attrition rate is low. For
Non Travel total 150 employees are there and 12 employees
are leaving.
Fig. 3.5
© 2020, IRJET | Impact Factor value: 7.529 | ISO 9001:2008 Certified Journal | Page 3857International Research Journal of Engineering and Technology (IRJET) e-ISSN: 2395-0056
Volume: 07 Issue: 05 | May 2020 www.irjet.net p-ISSN: 2395-0072
Fig. 3.5 represents the bar graph of the Overtime and 5. CONCLUSION
Attrition. There are total 416 employees who work overtime
and out of them 127 employees are leaving, so attrition rate This paper determines which machine learning algorithm is
is 30.53%. There are 1054 employees who are not working performs well in predicting the employees who are likely to
overtime and out of that 110 are leaving, so attrition rate is leave the respective organization. From the result, we can
10.44%. conclude that Random Forest performs better than the other
classifiers. It is observed that, the cause of employee attrition
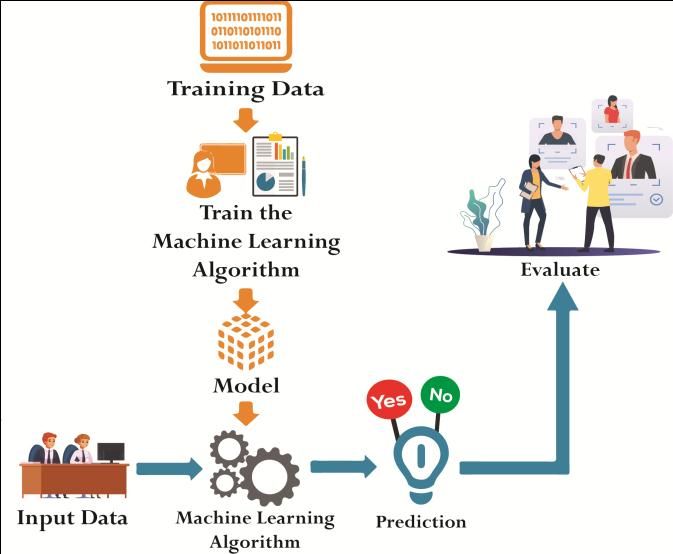
4. RESULT AND EVALUATION is because of both external and internal factors. This study
might help organization for knowing the factors of employee
In above dataset, there are various attributes like attrition and can take appropriate steps to minimize the
department, gender, overtime, business travel, etc. Based on attrition rate.
these values, model which was build with the help of
different machine learning algorithms which will predict REFERENCES
whether employees will leave the organization or not. The
predicted values are compared with test values to calculate [1] Dilip Singh Sisodia, Somdutta Vishwakarma,
the accuracy of the each algorithm. The table given below Abinash Pujahari, “Evaluation of machine learning
describes various factors, so we can easily conclude which models for employee churn prediction,”
algorithm is best for our model. From the table, we can infer International Conference on Inventive Computing
that Random Forest gives highest accuracy on the HR- and Informatics (ICICI 2017).
Employee-Attrition dataset whereas Decision Tree gives the
lowest accuracy for the same dataset. [2] M.Sudheer Kumar, Obulesu Varikunta,
K.Ramakrishna, “Employee Attrition and Retention
Strategies in Manufacturing: An Empirical Study in
Decision Random Amara Raja Batteries Limited,” International Journal
Attributes/Model KNN SVM
Tree Forest of Innovative Technology and Exploring
Accuracy 0.8639 0.8684 0.8163 0.8843 Engineering (IJITEE), Volume-8, Issue-7, May, 2019,
pp. 2962-2968.
Precision 0.8196 0.8364 0.8224 0.8723
[3] Mrs. Jaya Sharma, “Employee Attrition and
Sensitivity or Recall Retention in a Cut-Throat Competitive Environment
or True Positive 0.8621 0.8697 0.8165 0.8852
in India: A Holistic Approach,” Paripex - Indian
Rate
Journal of Research (PIJR), Volume 4, Issue 2, Feb
F-Measure 0.8403 0.8520 0.8193 0.8786 2015.
Specificity or True
0.9921 0.9790 0.8897 0.9895 [4] Dr. B. Latha Lavanya, “A Study on Employee
Negative Rate
Attrition: Inevitable yet Manageable,” International
Journal of Business and Management Invention,
False Positive Rate 0.0079 0.021 0.1103 0.0105
Volume 6, Issue 9, September. 2017, pp. 38-50.
False Negative Rate 0.1379 0.1303 0.1835 0.1148 [5] Heng Zhang , Lexi Xu , Xinzhou Cheng , Kun Chao ,
Table-1: Results of Different Classifier Xueqing Zhao, “Analysis and Prediction of Employee
Turnover Characteristics based on Machine
Learning,” The 18th International Symposium on
Communications and Information Technologies
(ISCIT 2018).
[6] Diwakar Singh, “A Literature Review on Employee
Retention with Focus on Recent Trends,”
International Journal of Scientific Research in
Science and Technology (IJSRST 2019), Volume 6,
Issue 1, pp. 425-431.
[7] L. E. Peterson (2009), “K-nearest neighbor,”
Scholarpedia, vol. 4, no. 2, p. 1883. [Online].
Available: http://www.scholarpedia.org/article/K-
nearest_neighbor
Fig. 4.1 - Performs Comparison of Different classifier
© 2020, IRJET | Impact Factor value: 7.529 | ISO 9001:2008 Certified Journal | Page 3858International Research Journal of Engineering and Technology (IRJET) e-ISSN: 2395-0056
Volume: 07 Issue: 05 | May 2020 www.irjet.net p-ISSN: 2395-0072
[8] Random Forest Algorithm. [Online]. Available: Suhasini L. Bhat
https://www.javatpoint.com/machine-learning- Asst. Professor at Dept. of
random-forest-algorithm Information Technology, P.E.S.
Modern College of Engineering,
[9] Support Vector Machines (SVM). [Online]. Pune, Maharashtra, India
Available: https://towardsdatascience.com/https-
medium-com-pupalerushikesh-svm-f4b42800e989
[10] S. Saranya, J. Sharmila Devi, “Predicting Employee
Attrition Using Machine Learning Algorithms and
Analyzing Reasons for Attrition,” International
Journal of Advanced Engineering Research and
Technology (IJAERT), Volume 6, Issue 9, September
2018, pp. 475-478.
[11] Kaggle, “HR-Employee-Attrition.” [Online].
Available:
https://www.kaggle.com/pavansubhasht/ibm-hr-
analytics-attrition-dataset
BIOGRAPHIES
Adarsh Patel
Student at Dept. of Information
Technology, P.E.S’s Modern College
Of Engineering, Pune, Maharashtra,
India
Nidhi Pardeshi
Student at Dept. of Information
Technology, P.E.S’s Modern College
Of Engineering, Pune, Maharashtra,
India
Shreya Patil
Student at Dept. of Information
Technology, P.E.S’s Modern College
Of Engineering, Pune, Maharashtra,
India
Sayali Sutar
Student at Dept. of Information
Technology, P.E.S’s Modern College
Of Engineering, Pune, Maharashtra,
India
Rajashri S Sadafule
Asst. Professor at Dept. of
Information Technology, P.E.S.
Modern College of Engineering,
Pune, Maharashtra, India
© 2020, IRJET | Impact Factor value: 7.529 | ISO 9001:2008 Certified Journal | Page 3859You can also read